Soybeans Channeling Higher Towards 1800The main view of this trade idea is on the Daily Chart.
The commodity Soybeans appears to have found some support around the 1350 price level. The commodity is in a trend channel higher and once that trend channel holds, could rally towards 1800 over the next couple of months. This view will be negated if Soybeans fall below 1420.
Technical Indicators
The technical indicators are aligned to this view. Soybean’s Supertrend has been in a buy mode since the end of October 2022. The commodity has been above its respective Moving Average, the 50-Day MA, since November 1st, 2022. The Awesome Oscillator is above 0 and green while the RSI is above 50 and increasing.
The intra-day trend following indicators of the Soybeans also display uptrends in the 15-Min, 2-Hour and 4-Hour time frames. Short to medium term support is seen around the 1425.
Recommendation
The recommendation will be to go long at market, with a stop loss at 1420 and a target of 1800. This produces a risk/reward ratio of 2.45.
Disclaimer
The views expressed are mine and do not represent the views of my employers and business partners. Persons acting on these recommendations are doing so at their own risk. These recommendations are not a solicitation to buy or to sell but are for purely discussion purposes.
At the time of writing, I have exposure to Soybean futures.
Search in ideas for "COMMODITY"

NGAS: Will Demand for Natural Gas Increase With Climate Change?Natural Gas's all-time price action/chart suggest that it is due for a sizeable, generational bull run, to start within the next 3 years. One could blame it on war or climate change or politics but I am not smart enough to determine which may be the actual cause, if any. I can instead deduct from NGAS' wavemap that we are unlikely to enjoy the low prices we've seen during the early 90s or at late as Spring 2020.
I've never looked at an inflation chart or have been able to determine what's next for us in that regard but I think this commodity alone can give us some decent expectations. What happens if/when it costs 20x more to keep your home cool in the summer (or warm in the winter)?
With an extended diagonal wave in primary Wave 1 of NGAS, we can expect that primary Wave 3 will be likely extended beyond the 1.618 level. We cannot say that this will occur for sure but it is as likely as it ever is. After finding possible support below $5 in 2024, this commodity could make citizens want to hit the rewind button irl. By 2037-2040, Natural Gas could and should be more than the price of Oil.
At this point and time, I genuinely believe that NGAS will go 40X within the next 15 years. This is indication that I've found through continued analysis of price action. I have no reason to doubt this perspective but am well aware that it could be invalidated upon any given day. For continued analysis of this worldwide commodity and help with taking advantage of a possibly upcoming generational swings, come surf with me and the Digital Surf Trading Community.

Bitcoin Adjusted For Commodity & M2SLChart shows historical price of Bitcoin adjusted against both the Global Commodity Price Index and M2SL, and may serve as a visual aid to illustrate Bitcoin price adjusted for rise in commodity prices while taking into account increase in money supply.
This chart therefore accentuates and magnifies the recent downturn by taking into account both rising commodity prices due partially to increase in Money Supply and money supply increase itself. One could make the case that this chart distorts the price of Bitcoin. One could also make the case that the chart illustrates Bitcoin's shortcomings as an inflation hedge.
Regression analysis shows retrace from cycle ATH to ATL becoming more severe with each downturn. By this measure, we might try to look for 88% retrace on this chart.

Descending Triangle on Soybean Oil, Target at 3755Trend Analysis
The main view of this trade idea is on the 4-Hour Chart. The commodity soybean oil (SOYUSD) is in a descending triangle setup pattern. The resistance line is seen with lower highs on 7200 and 6495 respectively. The support line is observed around 5450. A breakdown in support will take SOYUSD towards 3755. A negation of this pattern will be seen if the commodity breaks above the resistance trend line, above 6490.
Soybean Oil is in a sell mode as it approaches support around 5450 on the longer termed Daily chart.
Technical Indicators
The technical indicators are bearish for SOYUSD. There has been negative crossovers on the short (50-MA), medium (100-MA) and long (200-MA) fractal moving averages. The RSI is trading below 50 and there has been a negative crossover on the KST as the commodity’s price approaches support.
Recommendation
The recommendation will be to go short at market, with a stop loss at 6490 and a target of 3755. This produces a risk/reward ratio of 1.68.
Disclaimer
The views expressed are mine and do not represent the views of my employers and business partners. Persons acting on these recommendations are doing so at their own risk. These recommendations are not a solicitation to buy or to sell but are for purely discussion purposes. At the time of publishing I have exposure to Soybean Oil.

August Could Be The Start Of A Bumpy Period In MarketsLast week, in an interview on CNBC, legendary trader and investor Stanley Druckenmiller sounded an alarm. He told reporters on the financial news network, “I can’t find any period in history where monetary and fiscal policy were this out of step with the economic circumstances, not one…I will be surprised if we’re not out of the stock market by the end of the year, just because these bubbles can’t last that long.” He went on to say there is a “raging mania in all assets.”
Jackson Hole could send ripples across markets like in 2020
The market expects the beginning of tightening
The delta variant provides another excuse
What does “transitory” really mean?
Fasten your seatbelts for a very rocky ride in markets- The dollar and bonds have become risk barometers than the VIX
In 2021, cryptocurrencies rose in a parabolic move to record highs. Even though they corrected, prices remain far above last year’s levels. The explosive rallies reflect the decline in the faith in government and central bank control of the money supply.
The tidal wave of central bank stimulus and tsunami of government stimulus has weighed on fiat currency’s purchasing power. The stock market has risen to all-time highs because, for many investors, TINA, there is no alternative to stocks. As Leon Cooperman, the ex-Goldman Sachs partner and hedge fund manager, once said, “Buying bonds amounts to picking up pennies in front of a steamroller.” Commodity prices are trending higher in a bullish relay race that began at the March and April 2020 lows. Gold reached a record peak in August 2020. Grain and oilseed prices rose to eight-year highs earlier this year. In May, lumber, copper, and palladium reached record peaks. NYMEX crude oil futures recently rose to the highest level since 2014. Natural gas traded to highs above $4 for the first time since the peak winter season in late 2018. The last time natural gas was north of $4 per MMBtu was in 2014. Ethanol moved to its highest price since 2014, and coal to a level not seen since 2008. Last week, coffee futures traded at over the $2.15 level for the first time since 2014 before correcting. Commodities, stocks, cryptocurrencies, and other asset prices are trending higher. Residential real estate is not only a seller’s market, but prices have moved to insane levels in some regions. The bottom line is accommodative monetary and fiscal policies have planted turbocharged inflationary seeds, and markets have responded.
Stanley Druckenmiller knows it is not a question of if significant volatility grips markets across all asset classes, but when it occurs. August 2021 could be a very bumpy period in markets as the traditionally volatile fall season is on the horizon.
Jackson Hole could send ripples across markets like in 2020
The markets are anxiously awaiting word from the US central bank at its annual August gathering in Jackson Hole, Wyoming. Aside from fishing, hiking, and other outdoor activities, the Fed tends to use the offsite experience as an occasion to roll out monetary policy changes. Even though the 2020 summer meeting was virtual, the Fed took the opportunity to introduce a not-so-subtle change in inflation targets, shifting them from 2% to an average of 2%.
After the highly inflationary CPI data over the past three months and a slew of other validations that the economic condition is far above the “target,” the Fed’s tone changed. At the recent meetings, the rhetoric became subtly more hawkish than dovish. However, this week, the central bank took a dovish step back as COVID-19’s delta variant is causing infections to rise. The variant could be a convenient reason for the Fed to maintain the accommodative status quo.
The market expects the beginning of tightening
Recent Fed minutes told markets the central bank debated whether they would begin tapering quantitative easing with mortgage-backed securities or government bonds. When the tapering starts, the Fed Funds rate hikes will eventually follow.
The subtle change in the rhetoric increased market expectations that tighter credit is on the horizon. However, the market does not always get what it expects, and the Fed and US Treasury are notorious doves since 2008.
The delta variant provides another excuse
If the central bank digs deep into the excuse box, which sits next to the toolbox full of accommodative tools, it may come up with the rising number of COVID-19 delta variant cases as justification for the status quo. The powers in Washington DC will not mind as Democrats desperately want to hold onto and even expand the majority in the House of Representatives and the Senate. Liquidity and stimulus continue to prop up the economy, but the flood of the pair comes with a steep price tag.
If the Fed decides to delay tapering QE or set a schedule to increase the Fed Funds rate from zero percent, it will only push off the inevitable. The bottom line is that artificially low interest rates and $120 billion each month in debt purchases are transitory policies to stabilize economic conditions.
What does “transitory” really mean?
The Fed’s mantra in 2021 is “transitory” when describing rising inflationary pressures. After the May CPI data, all the focus turned to lumber prices and skyrocketing home prices. In the wake of the June CPI, bottlenecks in the supply chain causing a semiconductor shortage and lack of supplies of new and used cars were thrust to the center of the excuse stage.
Meanwhile, markets have been in an inflationary relay race to the top, with one asset passing the baton to the next. The stock market remains near record highs. Cryptocurrencies exploded, reaching incredible peaks in April and May, which is a direct challenge to the central bank and government control of the money supply. Commodity prices have been a merry-go-round of increasing prices. Real estate levels are out of this world. My wife and I bought a new home in late 2016. This week, smaller houses on our block were selling at over 100% above the price we paid.
“Transitory” means temporary, and that a condition will pass. The Fed refused to define its measurement period for the “average 2% inflation rate,” calling it “discretionary.” Uncertainty is growing, and markets appear ready to respond.
Fasten your seatbelts for a very rocky ride in markets- The dollar and bonds have become risk barometers than the VIX
The price of any asset is always the correct price because it is the level where buyers and sellers meet in a transparent marketplace. The Fed may control short-term interest rates via the Fed Funds rate, but long-term interest rates reflect the market’s perception of credit. Ironically, the bond market has been taking on the Fed since August 2020.
In a series of counter-intuitive moves, the US 30-Year Treasury bond futures fell from 183-06 in August 2020 to a low of 153-29 during the final week of March while the Fed purchased an average of $120 billion each month in debt securities. As inflation data began to make the Fed think about tightening over the past few months, the bonds have risen, reaching the most recent high at 167-04 in mid-July. The bond market has been moving contrary to the central bank’s signals with the futures near the highs at just below the 165 level as of July 30.
Meanwhile, the dollar index reflects the US currency’s value against other world reserve foreign exchange instruments. Since the euro is the second-leading reserve currency, the dollar index has a 57.6% exposure to the European currency. The dollar index tends to move higher and lower with interest rate differentials. In the wake of last year’s pandemic, the rate gap between the dollar and the euro narrowed substantially.
As the weekly chart illustrates, the dollar index fell from its highest level since 2002 at 103.96 in March 2020 to a low of 89.165 in early 2021, a drop of 14.2%, a substantial move for the US dollar. Since May, the index rallied, reaching the 93.195 level in July. The dollar index was at just over the 92 level on July 30. The index fell after the July FOMC meeting when the central bank appeared more dovish than the prior month.
The high in March 2020 was a flight to quality during the worst period of asset liquidation caused by the pandemic. The decline came as US rates fell. The latest rally is on the back of the prospects for rising US rates compared to European rates and the potential for volatile markets over the coming weeks and months. The dollar and bond market are likely to reflect volatility better than the VIX index. The VIX reflects implied volatility of put and call options on S&P 500 stocks. Since market participants tend to panic during downside corrections, the VIX rallies when stocks fall. However, the stock market’s rise could be a symptom of inflationary pressures where all asset prices are rising, and that could continue given the tidal wave of central bank liquidity and tsunami of government stimulus.
Even if the Fed bites the bullet and tightens credit, the process will be laborious. The central bank does nothing quickly unless it faces an unprecedented event, as we witnessed in 2008 with the financial crisis and 2020 on the back of the pandemic. Going from hawkish to dovish is a short-term affair while reversing course to a tighter approach to credit is done at a snail’s pace, in the interest of “market stability.” Meanwhile, with the 2022 midterm elections on the horizon and a green and progressive agenda in Washington DC, the spending will continue. Government stimulus in the trillions overwhelms any tweaks the Fed may make over the coming months.
The price tag for inflationary policies is massive. The market is waiting for the Fed to unwrap its plans at the August Jackson Hole event. The FOMC got a lot more inflation than it bargained for when it boosted its target to an unknown and unmeasurable “discretionary” level last year. Fasten your seatbelts; markets are in for a wild ride over the coming weeks and months. The fall tends to be a volatile time in the stock market. Corrections in 1929, 1987, and 2008 came during the fourth quarter. Follow those trends as they are your only friend. The central bank and government policies may have been friendly for markets since the early 2020 lows but feeding the inflation beast with liquidity and stimulus is like giving bigger fixes to a junkie. According to Stan Druckenmiller, a rude awakening could be on the horizon. I can’t disagree, as all the seeds of financial insanity have begun to bloom. Either raging inflation or raging stagflation would roil the markets, and one of the two conditions seems unavoidable.
We could look back at August 2021 as the beginning of an unprecedented and volatile period in markets. Fasten those seatbelts, hedge your bets and investments, and prepare for a head-spinning ride. It is far better to be safe and ready than unprepared and sorry when it comes to your assets.
Get free early access to articles using the designated link below. Sign up for the Monday Night Strategy Call using the link provided below.
Trading advice given in this communication, if any, is based on information taken from trades and statistical services and other sources that we believe are reliable. The author does not guarantee that such information is accurate or complete and it should not be relied upon as such. Trading advice reflects the author’s good faith judgment at a specific time and is subject to change without notice. There is no guarantee that the advice the author provides will result in profitable trades. There is risk of loss in all futures and options trading. Any investment involves substantial risks, including, but not limited to, pricing volatility, inadequate liquidity, and the potential complete loss of principal. This article does not in any way constitute an offer or solicitation of an offer to buy or sell any investment, security, or commodity discussed herein, or any security in any jurisdiction in which such an offer would be unlawful under the securities laws of such jurisdiction.

LONG UGA @ $28.50 for Gasoline Futures bounce from $1.64Gasoline Futures (RBOB Gasoline Futures) likely counter trend bounce here off 200weekSMA support at $1.66 to reclaim long-term moving average support of 50monthSMA at $1.70, then rally to test 100weekSMA resistance at $1.80.
Technical Analysis:
- Gasoline Futures (RBOB Gasoline Futures) now testing long-term support of 200weekSMA at $1.66.
- $1.66 also strong price support from Feb 2018 for potential double bottom pattern
- Daily & Weekly RSI extremely oversold
- Daily MACD record lows
- 50monthSMA long-term support sitting at $1.70 to continue uptrend from 2016 lows
- Potential bottom hammer candle on hourly chart today at $1.66
Fundamental Analysis:
Over recent weeks, we have seen an almost perfect bearish storm in the Crude Oil market that sent the price of futures from a high of $76 to low of $61, a decline of about 19% in less than one month. Rising production, increasing inventories, a strong dollar, concerns over trade, and the realization that the sanctions on Iran include some exceptions, all led the price of the energy commodity lower in a dramatic corrective move. These factors have had a greater impact on its bi-product Gasoline, which is also undergoing a seasonal bearish period during the winter months. However, we feel this move has been overextended to the downside as there are still 3 fundamental reasons why oil is close to low and could spark a counter trend rally in Gasoline.
- Turmoil in the Middle East could result in a decrease in production and rapid price increase
- OPEC expected to cut production at their bi-annual meeting Dec. 6th
- Pullback of USD from highs due to US election results could relieve some of the bearish weight on commodity prices
- Demand for the energy commodity remains strong with increasing population and rising heating oil cracks

AUDUSD - Top of Structure, Potential SellThe big jump for USDCAD during the last NY session could be a precursor for commodity prices to fall again.
AUDUSD being a strong commodity currency pair has rebounded to a high which gives us a large space to profit from a sell should commodity prices really resumes depreciation.
AUDUSD is now trading at the top of a symmetrical triangle and the top of a rising channel, and additionally a strong resistance level at 0.7440.
On a side note, DXY has also held off at 95, a sign that shows that the Dollar still holds a potential to climb back to 95.5.

AUD/USD M/T shortHi guys,
In effect, this is an extension of my aussie trade posted pre-Trump (26th October 2016) in which we bagged 500 pips.
AUDUSD has seen rapid recovery off the back of both dollar weakness (mainly due to lack of details of the US administration's economic plans) and rapidly rising commodity prices, in particular iron ore (/it has rallied 10% recently, mainly based on speculation).
At present, the commodity currencies are more overvalued than any of their G10 counterparts at 15% in TWI terms, almost as much as they were a couple of years ago before they corrected substantially lower due to weaker commodity prices and rate cuts from the central banks (RBA in this case). Long term FX valuations point to AUD/USD fair value at 0.70.
RBA have sounded more optimistic on growth recently but $MS and others expect a slowdown in the housing sector, which could trigger an RBA cut. It is likely that the RBA wants to limit AUD upside in the n/t and is ready to soft its tone in case the FX rate appreciates excessively. Moreover, as the market could well price in more aggressive action by the Fed, relative mon pols support USD against AUD in coming months.
Iron ore futures need a reality check, which is my main reason for taking this trade (as well as favourable price action, esp on the weekly charts). RBA expects additional iron ore output from Brazil, as well as potential return of some output in China, to weigh on iron ore prices in the near term and doesn't see iron ore sticking around $90/metric ton. One could argue for days about whether iron ore prices should have rallied etc but one thing is for sure (as sure as you can be in this game!): iron ore prices need a correction. I see propensity for a correction down to as low as $80.
Looking at price action, upward momentum seems to be waning (bearish RSI div + 2 weekly dojis). A correction towards the 50% retracement of the Nov-Dec 2016 move seems likely, in my view.
GL all!

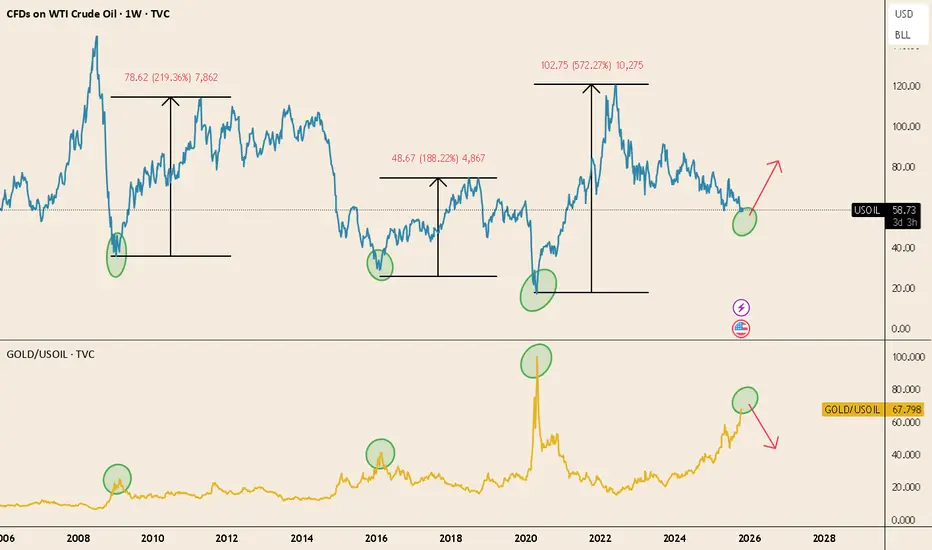
Oil vs Gold: Transition to the Next Commodity CycleThe chart compares WTI crude (top) and the Gold/Oil ratio (bottom) on a weekly basis.
Historically, when the Gold/Oil ratio spikes — meaning gold becomes very expensive relative to oil — it tends to mark the end of the precious metals phase and the beginning of the broader commodity cycle.
In the past three cycles:
-2009 → 2011: Oil +219%
-2016 → 2018: Oil +188%
-2020 → 2022: Oil +572%
We’re seeing the same setup again:
TVC:USOIL sits at long-term support.
Gold/Oil ratio has reached historical extremes.
In each of these cases, gold had already led the move — followed by silver, industrial metals, and finally oil — the last to rally as growth and inflation expectations picked up.
If history rhymes, this could mark the rotation point where energy begins to outperform within the commodity complex.
"NICKEL" Commodity CFD Market Bullish Heist Plan🌟Hi! Hola! Ola! Bonjour! Hallo!🌟
Dear Money Makers & Robbers, 🤑 💰
Based on 🔥Thief Trading style technical and fundamental analysis🔥, here is our master plan to heist the "NICKEL" Commodity CFD market. Please adhere to the strategy I've outlined in the chart, which emphasizes long entry. Our aim is the high-risk Red Zone. Risky level, overbought market, consolidation, trend reversal, trap at the level where traders and bearish robbers are stronger. Be wealthy and safe trade.💪🏆🎉
Entry 📈 : Traders & Thieves with New Entry A bull trade can be initiated on the MA level breakout of 16130.000
However I advise placing Buy limit orders within a 15 or 30 minute timeframe. Entry from the most recent or closest low or high level should be in retest.
Stop Loss 🛑: Using the 2H period, the recent / nearest low or high level.
Goal 🎯: 16500.000 (or) Escape Before the Target
Scalpers, take note 👀 : only scalp on the Long side. If you have a lot of money, you can go straight away; if not, you can join swing traders and carry out the robbery plan. Use trailing SL to safeguard your money 💰.
Fundamental Outlook 📰🗞️
The Nickel commodity CFD is expected to move in a bullish direction, driven by several key factors.
BULLISH FACTORS:
Supply Constraints: The global nickel supply is expected to be constrained due to production disruptions and declining ore grades at major mines.
Increasing Demand: The demand for nickel is expected to increase, driven by the growing demand for stainless steel and electric vehicle batteries.
China's Nickel Imports: China's nickel imports are expected to increase, which could support nickel prices.
Indonesian Export Ban: Indonesia's export ban on nickel ore is expected to reduce global supply and support nickel prices.
Technical Analysis: The nickel chart is showing a bullish trend, with a potential target of $20,000 - $22,000 per ton.
UPCOMING FUNDAMENTAL ANALYSIS:
Chinese Economic Data: The upcoming Chinese economic data, including GDP growth and industrial production, is expected to show a strong economy, which could support nickel demand.
US Economic Data: The upcoming US economic data, including GDP growth and durable goods orders, is expected to show a strong economy, which could support nickel demand.
Nickel Inventory Levels: The upcoming nickel inventory levels report is expected to show a decline in inventories, which could support nickel prices.
Mining Production: The upcoming mining production report is expected to show a decline in production, which could support nickel prices.
MARKET SENTIMENT:
Bullish Sentiment: 60%
Bearish Sentiment: 30%
Neutral Sentiment: 10%
Trading Alert⚠️ : News Releases and Position Management 📰 🗞️ 🚫🚏
As a reminder, news releases can have a significant impact on market prices and volatility. To minimize potential losses and protect your running positions,
we recommend the following:
Avoid taking new trades during news releases
Use trailing stop-loss orders to protect your running positions and lock in profits
Please note that this is a general analysis and not personalized investment advice. It's essential to consider your own risk tolerance and market analysis before making any investment decisions.
Keep in mind that these factors can change rapidly, and it's essential to stay up-to-date with market developments and adjust your analysis accordingly.
💖Supporting our robbery plan will enable us to effortlessly make and steal money 💰💵 Tell your friends, Colleagues and family to follow, like, and share. Boost the strength of our robbery team. Every day in this market make money with ease by using the Thief Trading Style.🏆💪🤝❤️🎉🚀
I'll see you soon with another heist plan, so stay tuned 🫂

Long term Bitcoin channel ideaI want to share this idea, as it's quite possible. In 2021 it hit me as a sad realization that Bitcoin might not be in an exponential market anymore. I had this idea that perhaps bitcoin was leveling out into a commodity channel. Bitcoin is a commodity after all, so it sort of makes sense it would look more like the channels commodities with long term average supply and demand carry.
As we hit the upper limits of the channel I would be cautious about returning to support.

SILVER_WAVE 3Silver broke out of corrective triple three pattern after having risen in an impulsive wave 1 starting Oct.3 ending Oct.20.
Talking of chart patterns the commodity also broke out of the falling wedge chart pattern.
Other than a minor pullback on hourly/half hourly chart there should not be much resistance for this commodity to quicky achieve its projected wave 3 target close to approx. $25.
Note*- This chart is for educational purpose only

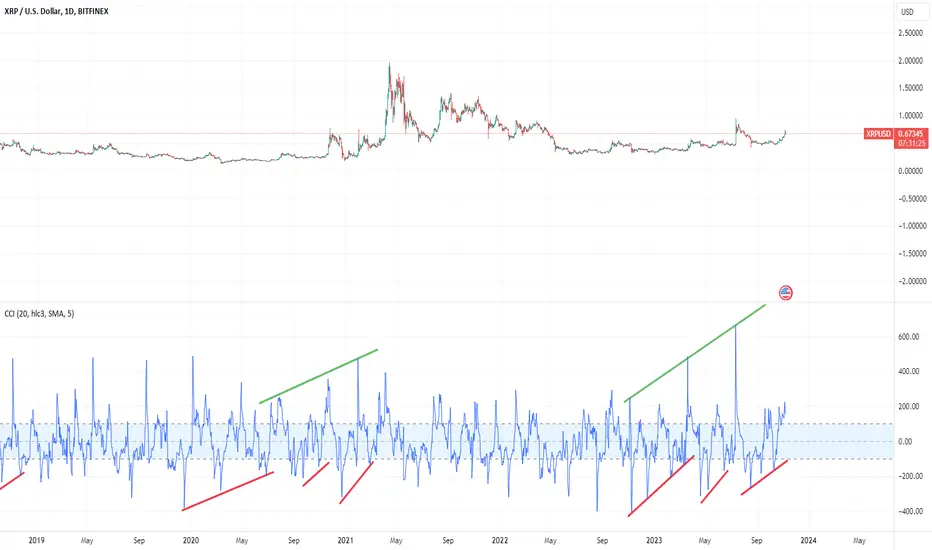
Zanny XRP analysis. Commodity Channel Index. lines everyehereLooking at XRP yesterday with longterm Commodity Channel index. I found this a useful way to look at historical trends. maybe xrp's biggest cycle? Time will tell. I have never looked at commodity channel index before. perhaps someone has similar or varying ideas on such matters.
Higher for LongerUS inflation data in July 2023 provided mixed signals. While Consumer Price Index (CPI) is moving in the right direction, producer price inflation suggest pipeline pressures are picking up. Core CPI, which excludes often-volatile food and energy costs, rose only 0.2% for a second month in a row . However, US producer prices picked up in July, owing to increases in certain service categories. This likely buys more time for the Federal Reserve (Fed) to deliberate on the future path of monetary policy.
The flows into bond exchange traded funds (ETFs) have been volatile. Over the past year, investors were starting to embrace duration. Investors were positioned for recession, inflation crash, and Fed cuts - evident from $31.7bn inflows to Treasury bond ETFs on pace for a record year2. However, investors are starting to pull out of the biggest bond ETFs devoted to Treasuries. More than $1.8 billion came out of the $39 billion iShares 20+ Year Treasury Bond ETF last week, the most since March 20203. Sentiment toward long-dated Treasuries has soured over the past month amid growing conviction that the Fed will keep interest rates at elevated levels for an extended period. We expect rates to remain higher for longer and are unlikely to see the Fed cut rates until the Q1 of next year amidst a stronger US economy.
Don’t celebrate on disinflation just yet
Overall, the US economy continues to show extraordinary resilience despite monetary constraints and credit tightening. While inflation has shown encouraging signs of decline, we caution that the level remains high. Strong July retail sales raise the risk of a re-acceleration in inflation. The four biggest categories of the ex-auto’s component saw outsized gains: non-store retailers, restaurants & bars, groceries, and general merchandise. Amidst a tight US labour market, with unemployment at historic lows and wages continuing to rise, the downward pricing momentum in the service sector is likely to be at a slower rate. Commodity prices are also beginning to rebound from the weakness seen in Q2 2023. Energy prices have been rising on the back of Organisation of Petroleum Exporting Countries and its allies (OPEC+) production cuts. If commodity prices extend their recent momentum, it could pose upside risks to inflation.
Fed Officials remain divided
Messaging on a somewhat mixed inflation outlook from the Fed Officials remains a mixed bag. One faction remains of the view that rates hikes over the past year and a half has done its job while another group contends that pausing too soon could risk inflation re-accelerating. Fed governor’s Michelle Bowman and Christopher Waller remain in the hawkish camp, hinting at more rate increases being needed to get inflation on a path down to the 2% target.
Futures markets are assigning about a 11% chance of a 25-basis-point rate hike when the Fed next meets on 19 and 20 September4. Additionally, rate cuts have now been completely taken off the table until perhaps later in the Q1 2024. The latest Fed minutes reveal commentary from officials, including the hawks, such as Neel Kashkari, suggest a willingness to pause again in September, but to leave the door open for further hikes at the upcoming meetings5.
Opportunity for a yield seeking investor
It’s been an impressive turnaround since the pandemic when negative real yields became the norm. TINA- ‘There Is No Alternative’ to equities, is over now that evidence of the shift to a 5% world appears stronger than ever. Today investors have the opportunity to lock in one of the highest yields in decades, with US two-year yields paying close to 5% exceeding the yields at longer maturities without the volatility witnessed in the 10-year sector. A resilient US economy is likely to keep interest rates and bond yields higher for longer.
Sources
1 Bureau of Labour Statistics as of 10 July 2023
2 BofA ETF Research, Bloomberg as of 9 August 2022 - 9 August 2023
3 Bloomberg as of 14 August 2023
4 Bloomberg as of 17 August 2023
5 federalreserve.gov as of 16 August 2023
This material is prepared by WisdomTree and its affiliates and is not intended to be relied upon as a forecast, research or investment advice, and is not a recommendation, offer or solicitation to buy or sell any securities or to adopt any investment strategy. The opinions expressed are as of the date of production and may change as subsequent conditions vary. The information and opinions contained in this material are derived from proprietary and non-proprietary sources. As such, no warranty of accuracy or reliability is given and no responsibility arising in any other way for errors and omissions (including responsibility to any person by reason of negligence) is accepted by WisdomTree, nor any affiliate, nor any of their officers, employees or agents. Reliance upon information in this material is at the sole discretion of the reader. Past performance is not a reliable indicator of future performance.

XPTUSD ( Platinum / USD ) Commodity Analysis 18/07/2021Technical Analysis:
As you can see, there exist a Hidden Bullish Divergence with MACD and it is the very sign of bullish trend continuation as the Price is Bullish Bounding in an ascending channel.
We draw Fibonacci retracement from the low to the top of previous impulsive wave for specifying the Bullish Cycles and the Possible Pivot Points and Reaccumulation levels in the correction wave condition, which are defined as the Fibonacci and Support and Resistance levels on the chart.
Currently The commodity is consolidating and Reaccumulating on Fibonacci Golden Zone.
naturally XPTUSD is moving in ascending channel presently.
we believe that the commodity is getting ready in order to shoot to the defined targets by Fibonacci Projection of the Past impulsive wave

CC Cacao: Trade Commodity THIS EasterHi Traders, Investors and Speculators of the Charts 📈📉
Ev here. Been trading crypto since 2017 and later got into stocks. I have 3 board exams on financial markets and studied economics from a top tier university for a year.
Are you looking to make a trade out of Easter weekend? Look no further than Cocoa futures, or chocolate.
Cocoa is a soft commodity that is used to produce chocolate, and it is traded on several global commodity exchanges. One of the most significant exchanges for trading cocoa futures is the ICE Futures US (Intercontinental Exchange Futures U.S.). The exchange offers futures contracts for cocoa, which allows investors to speculate on the future price of cocoa beans. The cocoa futures contract on the ICE Futures US is traded under the symbol CC. Each CC contract represents 10 metric tons of cocoa beans, and the contract price is quoted in U.S. dollars per metric ton. The contract months for trading cocoa futures are March, May, July, September, and December.
The price of cocoa can be influenced by several factors, including supply and demand, weather conditions, and political instability in cocoa-producing regions. For example, adverse weather conditions, such as drought or flooding, can reduce cocoa yields and increase prices. Similarly, political unrest or conflicts in cocoa-producing countries can disrupt supply chains and lead to higher prices. Easter Weekend is a time known well for Easter bunny egg hunts and other chocolate delights, meaning that demand increases for cocoa in the months leading up to Easter. Considering that from a chart analysis the price of Cocoa has already increased over the past few months, it is the ideal time to consider a short right after Easter.
Easter has become a global celebration, and many cultures around the world have their unique ways of celebrating the holiday. For example, in Greece, the week leading up to Easter is called "Holy Week," and it is a time of fasting and religious observances. On Easter Sunday, families gather to celebrate with a feast of lamb and other traditional foods.
In the United States, Easter is celebrated with the Easter Bunny, who brings baskets of candy and treats to children. The Easter Bunny has its origins in German folklore, where it was a symbol of fertility and new beginnings. The tradition was brought to America by German immigrants in the 1700s.
In many Latin American countries, Easter is celebrated with parades and processions, where people carry statues of Jesus and the Virgin Mary through the streets. In Spain, there is a tradition called "Semana Santa," or "Holy Week," which involves elaborate processions and celebrations.
In India, the Christian community celebrates Easter by attending church services and exchanging gifts and greetings with friends and family. The holiday is also an opportunity for people of different faiths to come together and celebrate the arrival of spring.
In conclusion, Easter is a holiday that is celebrated around the world as a time of new beginnings, renewal, and the victory of life over death. Whether celebrated with bunnies and candy or religious observances and parades, Easter is a time for people of all cultures and faiths to come together and celebrate the beauty and wonder of spring.
_______________________
📢 Show us some LOVE 🧡 Follow for daily updates and trade ideas on Crypto , Stocks , Forex and Commodities 💎
We thank you for your support !
CryptoCheck

easyMarkets Brent Oil Daily - Quick Technical OverviewBrent oil continues to trade between two trendlines, a short-term upside one taken from the low of December 9th and a downside line drawn from the high of July 28th. As long as the commodity remains between those two lines, we will stay neutral.
If the downside line gets violated, we will start examining higher areas as potential targets, however, more buyers may join in if Brent oil jumps above the 89-dollar mark. Additionally, the commodity could also rise above the 200-day EMA, which also could be seen as a bullish indication.
Alternatively, a break below the aforementioned upside line and an additional move below the 80.43 zone may attract more sellers into the game, possibly clearing the way to the 75.00 area.
Disclaimer:
easyMarkets Account on TradingView allows you to combine easyMarkets industry leading conditions, regulated trading and tight fixed spreads with TradingView's powerful social network for traders, advanced charting and analytics. Access no slippage on limit orders, tight fixed spreads, negative balance protection, no hidden fees or commission, and seamless integration.
Any opinions, news, research, analyses, prices, other information, or links to third-party sites contained on this website are provided on an "as-is" basis, are intended only to be informative, is not an advice nor a recommendation, nor research, or a record of our trading prices, or an offer of, or solicitation for a transaction in any financial instrument and thus should not be treated as such. The information provided does not involve any specific investment objectives, financial situation and needs of any specific person who may receive it. Please be aware, that past performance is not a reliable indicator of future performance and/or results. Past Performance or Forward-looking scenarios based upon the reasonable beliefs of the third-party provider are not a guarantee of future performance. Actual results may differ materially from those anticipated in forward-looking or past performance statements. easyMarkets makes no representation or warranty and assumes no liability as to the accuracy or completeness of the information provided, nor any loss arising from any investment based on a recommendation, forecast or any information supplied by any third-party.

Copper (COPPER/INR) Commodity Analysis 18/07/2021 Technical Analysis:
As you can see, there exist a hidden Bullish Divergence with MACD which is the sign of bullish trend continuation as Copper has started its bullish wave since March 2020. It is moving in an ascending channel. We draw Fibonacci retracement from the low to the top of last impulsive wave which are defined as the Fib levels on chart. The commodity fell to 78% Fibonacci Retracement and it is consolidating and accumulating on Fibonacci Golden Zone currently. we believe this commodity is getting ready to shoot to the higher targets which are defined by Fibonacci Projection tool of the past wave.

ASX 200 drills lower thanks to commodity stocksAustralia’s main share index, the ASX 200, closed lower on Wednesday by 0.5%. This fall could have been a lot worse If not for technology and financial stocks mitigating the rout in other major Australian sectors.
Australian Securities Exchange’s Metals & Mining Index fell by a massive 5.6%. Heavyweights in the mining sectors, Rio Tinto (ASX: RIO), Newcrest Mining (ASX: NCM), and Fortescue Metals Group (ASX: FMG) lead the way, falling by 7.4%, 6.6%, and 4.9%, respectively.
The ASX Energy Index also declined by 5.8% as crude oil prices plummeted 9% overnight Tuesday. Two of the most significant index drivers, Woodside Energy (ASX: WDS) and Whitehaven Coal (ASX: WHC), slumped by 6.9% and 3.7%, respectively.
Virus and lockdown concerns appear to be the main factors suppressing commodity and energy stocks in Australia.
Domestic tech stocks did briefly push the ASX 200 into green territory intraday but were ultimately overcome by the strong headwinds of commodity stocks. The big tech winner of the day was Zip Co (ASX: ZIP), rising by a phenomenal 12.8%. Financials were also up by 0.9% as three of the "Big-four" seek to benefit from the Reserve Bank of Australia lifting its benchmark interest rate by another 50-basis points.
On the technical side, we can see on the daily chart that the ASX200 has been on a clear downtrend since April.
The index is currently moving in a tight range between 6700 and 6560.
A break above the resistance at 6700 could potentially retest the 6810-level area, creating a lower high of the downtrend before continuing to the downside. In consideration of the long-term scenario, a close below 6560, depending on market sentiments, could eventually drive the index down to the 6000 psychological support level.
The ASX 200 might struggle to maintain short-term upside movements. At least until China moves past its Covid concerns and lockdowns in the country no longer threatens to sideline its commercial operations and consumer demand.

Could We See the USOIL Reaching Its Previous High Again ? 1- Market Overview:
On the daily time frame, we can see that the USOIL is in a clear upward movement where a series of higher highs and lows has been posted. On the 3rd of March, the commodity rallied hugely and reached a high of 129.39 USD per barrel, the highest price since May 2011. Now, the price formed a triangle where it managed to break it to the upside after finding buyers around the 93.70 USD support level.
2- Long Scenario:
In this part of our analysis, we will provide you with what likely will occur in the coming days for the USOIL. Since the main direction of the trend is to the upside as shown in the overview part of the analysis, it is more likely to see the USOIL continues its move to the upside. Remember that the trend is your friend, so if everyone is buying, it is much wiser to consider a long position instead of a short one. In addition, the market succeeded to break the triangle to the upside which shows that the buyers are in control of the market and could push it furthermore to the upside toward the previous high (129 US Dollar).
3-Short Scenario :
The least likely scenario for this analysis is to see the USOIL reversing and move lower. The commodity might first face a resistance from buyers around the 93 USD mark level before tumbling toward the 85 USD price. If the buyers could not sustain the huge number of sellers around this zone the market could tumble again to the support zone which is the 66 US Dollar by posting lower lows and lower highs. So, first we should look for a breakout of the previous low around the 93 USD mark and then posting a new low below the 85 USD mark before reaching the 66 US Dollar.

the next commodity and gold super bullish really awful...really hard to predict the gold price based on commodity spikes,
because there is a disconnect between it after 1999
very easy to hit 300% spike to 3000$ zone
but dunno would gold still beat commodity performance on 700% or I did do wrong on the math

CADJPY : The War Between Safe-Haven and Commodity CurreniesCADJPY Analysis: The War Between Safe-Haven and Commodity Currencies
Over the past two weeks when was released the news that the attack in Ukraine began, we saw a shift of money directed to safe-haven currencies.
As you may know, the three main safe havens are considered USD, JPY, and CHF.
When we are in these situations USD, JPY and CHF tend to increase their price values change quickly.
However, this time everything developed in a different way. We can see a clear adaptation of the market to the relevant situation.
From February 24 22 to March 03 22 between the currencies in the CAD and JPY charts, the Canadian dollar showed that it was stronger. Very different from a normal situation.
As we all already know, the war between Russia and Ukraine will create problems with oil and natural gas reserves.
Canada, on the other hand, is a major oil producer, and the value of its currency is closely linked to the value of oil. These are also called commodity currencies.
So as long as the price of oil was projected to rise to $ 150 from many financial institutions like JP Morgan or the Bank of America, the Canadian dollar appreciated against one of the strongest safe-haven currencies, the Japanese Yen (JPY).
Also, the Japanese Yen (JPY) is showing its strength because not everyone thinks different way, so this is expanding the pattern formation to take the form of a "Bullish Flag Pattern" or a "Double Zigzag" "Elliott Wave."
As long as the price is still within the model, we can predict the next movement, which should be bullish again.
A price break decrease under the support area would increase the momentum of the decline.
I hope you enjoyed reading
Thank you!

Coffee causing a stir in commodity markets- Aneeka Gupta, Director, Macroeconomic Research, WisdomTree
Coffee prices are trading at their highest level in 10 years and is the second-best performing commodity Year to date (Ytd)1. A combination of a production shortfall in Brazil (the world’s largest coffee producer) due to extreme weather conditions coupled with supply disruptions should continue to propel coffee prices higher in 2022.
Lower inventory levels to keep prices vulnerable to supply shocks
The coffee harvest has a biennial cycle. This implies that a crop year with a good harvest (the “on year”) will be followed by a crop year with a lower harvest (the “off-year”). The last crop in Brazil was disappointing not only because it was an off-year, but Brazil also faced unfavourable weather conditions resulting in weaker supply. This was evident from Companhia Nacional de Abastecimento’s (“CONAB”) latest estimate for Brazil’s 2021/22 coffee crop, which is down 25.7% over the prior year3. As a consequence of lower output, global ending inventories are expected to decline from 7.9mn bags to 32mn. The weaker forecast represents the lower availability of coffee for exports, following weather setbacks to the 2021 harvest and logistical bottlenecks. Further obstacles have emerged towards the latter half of 2021 in the form of elevated shipping costs and high fertilizer prices, which are also likely to lend a tailwind to coffee prices. According to the United States Department of Agriculture (USDA), Brazil’s coffee exports are expected to slump by 12.45mn bags over the prior year to 33.22mn bags in 2021/224. A decline of that level would represent the largest decline in volume terms by a distance and the sharpest fall in percentage terms at 27% since 1985/86. USDA has been citing more cases of “defaults”, where coffee farmers failed to deliver pre-agreed contracts on the physical market because of excessive hoarding of coffee beans amidst the steep rise in prices. USDA also expects global consumption to rise by 1.8 million bags to 165.0 million, with the largest gains in the European Union, the United States, and Brazil.
Outlook for 2022/23 clouded in uncertainty
While the Brazilian 2022/23 coffee crop will be an on year (of the biennial cycle), there is still plenty of uncertainty shrouding the outlook of the coffee crop. According to Fitch, the La Nina5 weather phenomenon could cause further problems for the upcoming crop. The arrival of the La Nina weather phenomenon, which tends to bring dryness in the southern part of South America for the second consecutive year, has also dampened the outlook for the coffee crop in the upcoming season.
Conclusion
The supply tightness on the physical market has also pushed the front end of the coffee futures curve into backwardation from contango, thereby yielding a positive roll yield of 0.2% versus -1.4% a month back. Coffee stocks in the International Continental Exchange’s (ICE) warehouses have declined further and currently find themselves at a 9-month low of 1.78mn bags. Net speculative positioning in coffee remains 1-standard deviation above the 5-year average underscoring the bullish sentiment towards coffee. While the recent rise of the Omicron variant could threaten demand as countries decide to restrain mobility, we believe the fast-spreading variant could also complicate supply-chain disruptions and potentially drive Arabica prices higher.
Sources
1 Bloomberg, tracking commodity futures price from 31 December 2020 to 8 December 2021
2 Bloomberg Ticker - KCA Comdty, price performance from 31 December 2020 to 8 December 2021
3 Companhia Nacional de Abastecimento (Conab) – Brazil leading coffee forecasting agency
4 United States Department of Agriculture – Coffee: World Markets and Trade Report
5 La Niña is a complex weather pattern that occurs every few years, as a result of variations in ocean temperatures in the equatorial band of the Pacific
This material is prepared by WisdomTree and its affiliates and is not intended to be relied upon as a forecast, research or investment advice, and is not a recommendation, offer or solicitation to buy or sell any securities or to adopt any investment strategy. The opinions expressed are as of the date of production and may change as subsequent conditions vary. The information and opinions contained in this material are derived from proprietary and non-proprietary sources. As such, no warranty of accuracy or reliability is given and no responsibility arising in any other way for errors and omissions (including responsibility to any person by reason of negligence) is accepted by WisdomTree, nor any affiliate, nor any of their officers, employees or agents. Reliance upon information in this material is at the sole discretion of the reader. Past performance is not a reliable indicator of future performance.
