CRB Commodity Index predictionCRB Commodity Index prediction
When it gets highs the equity takes opposite affect
so its inversely proportional
Search in ideas for "COMMODITY"

$XOM hot commodity!$XOM has been one of the hot commodity for the past the few months. gas prices keeps surging up and up due to various reasons.
for now, oil started to cool down after hitting the ATH and continues trend lower below ema line for the past few days
for momentum move. although its started to pulls back, there's a possibilities that it might bounce back up due to war conflict
between the two countries Ukraine and Russia. once the war is officially started the oil might start move again due to possible high demand.
overall, the market is still very bearish and specially the tech market. please trade cautiously.
Day trade or scalp target play: 02/22/22
Buy call above 76.90 sell at 78.90
Buy puts below 76.10 sell at 75.31
Hello everyone,
welcome to this free technical analysis . ( mostly momentum play )
I am going to explain where I think this stock is going to go over the next day or week play and where I would look for trading opportunities
for day trades or scalp play.
If you have any questions or suggestions which stock I should analyze, please leave a comment below.
If you enjoyed this analysis, I would definitely appreciate it, if you smash that LIKE button and maybe consider following my channel.
Thank you for stopping by and stay tune for more.
My technical analysis is not to be regarded as investment advice. but for general informational proposes only.

Massive pullback in commodity prices might be coming...We might seeing around 30-40% pullback in commodity prices in the coming days which will be a buy of a lifetime opportunity because after this pullback I don't think we will ever look back while the world will be heading into a new place.

AUD - a play on a weaker EM and commodity picture Having liked AUDCAD longs as trade, the focus shifts away from here to how markets digest rates pricing – and notably that of US rates, where US swaps are pricing a 50% chance of a 50bp hike in the March FOMC meeting, and a small chance of an inter-meeting hike – something I feel is a very low probability.
Equity vol has kicked up and EM FX may start to look a touch more vulnerable here, so should we see EM under pressure driven by a reduction in carry, then the AUD may underperform as a proxy. A lot rides on commodity prices in the near term, but if EM and commodities are going to struggle then of course the AUD is going to the vehicle that is used to express that negative stance.
We saw a failed break of the 3 Feb high, with a shooting star candle, so we can see the bears are getting some say here. A break of the rising trend, married with higher implied vol (AUDUSD 1-week IV sits at 10.43%) and the bid may come out of the market, and I’d be looking for a move back to the 70-handle. A tough one, as trends are not developing either way and there’s lots of chop and no momentum on the 4-hr or daily timeframe. Happy to trade the trend break in small size and a worrying equity picture.
Chris
@chrisweston_PS

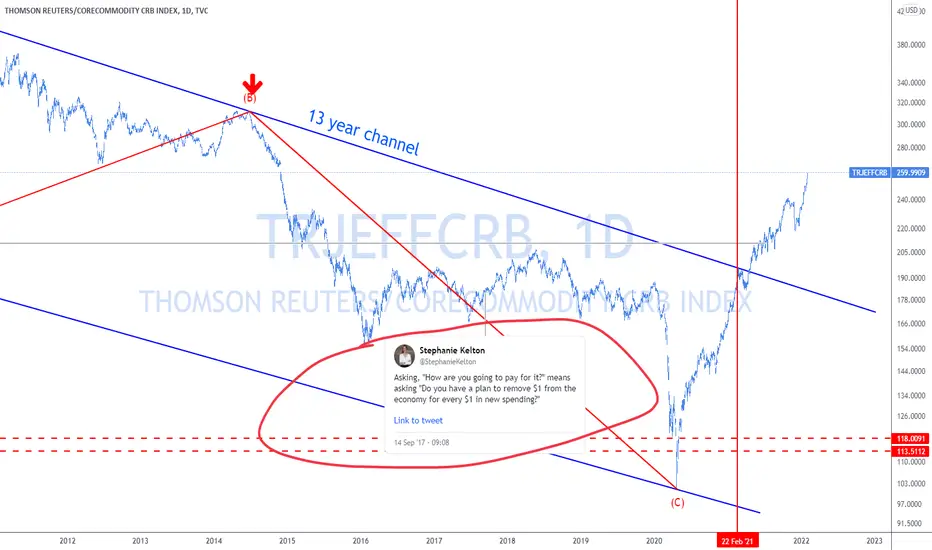
CRB Commodity Index UpdateBack on Apr 28, 2021, I posted a warning that commodities were about to explode higher.
Since then the cute storytellers have tried in aver way possible to divert people's attention from the real reason for inflation
Endless trillions of dollars printing. To this day the misinformation campaign continues.
AA - Long SqueezeAA cleared the earnings hurdle today and maintained prices levels despite another market down day.
1. Strong daily and weekly trend.
2. 4 bar squeeze.
3. Visible price levels and sitting at volume profile levels.
4. Commodity cycle with inflation to help with tailwind.
5. XME is at the top of channel and AA is strong within the ETF.
Entry: 59.50, 58.05 and 56.65
Stop Loss - 53.45
Profit Target - 61.50.
Good Luck!

Incoming Perfect Storm for Commodity CurrenciesI'm highly advising not to be long any commodity currencies following the BOJ
--
Trade Safe - Trade Well
Regards,
Michael Harding 😎 Chief Technical Strategist @ LEFTURN Inc.
RISK DISCLAIMER
Information and opinions contained with this post are for educational purposes and do not constitute trading recommendations. Trading Forex on margin carries a high level of risk and may not be suitable for all investors. Before deciding to invest in Forex you should consider your knowledge, investment objectives, and your risk appetite. Only trade/invest with funds you can afford to lose

Live stream - Daily Market Setups - Forex, Crypto, Commodity, InDaily Market Setups for Crypto, Forex, Commodity and Indices

Live stream - Daily Market Setups - Forex, Crypto, Commodity, InDaily Market Setups for Crypto, Forex, Commodity and Indices

GOLD | XAUUSD ALWAYS LOOKS GOOD TO BUYHello Traders,
XAUUSD always looks good for a buying opportunity, its a commodity that does not lose in value and typically its better to buy gold then sell it, you will have more success with it this way.
Also looking at technicals everything is trending towards the upside and a recent bullish engulfing candle confirms the trade to buy.

XRP is a digital commodityI evaluate XRP as a digital commodity unlike most youtubers/influencers/etc. that evaluate it as a security by market cap with predictions of $ 4 - 10 (short wave five -> possible though). So $ 250 (candle shadow) is my best educated guess, just the time horizon is difficult/impossible to predict. But it will most likely not happen next year.
Once the trading volume gets high, speculators could drive the price even higher -> the potential conclusion that XRP is not a security + fear of missing out could make the extented wave five happen which is so common in commodities as you can see in the three examples. The 1.618 extension gets exceeded, reached or almost reached very often.
A two week close above $ 1.60 (key level) could start the real bull run for XRP.
Also, I saw people talking about an ending diagonal for the wave five which is not possible because it has to be 3-3-3-3-3, unlike a leading diagonal which can be 5-3-5-3-5 or 3-3-3-3-3. And wave one of five already made five waves.

Copper (MCX) Short Term ReversalThe commodity has reached upper trendline and may undergo a correction within range. Trade is supported by resistance Nearby.
Risk Reward Ratio - 2:1
SL is placed above resistance zone & the upper trendline. The target is placed near swing low.

Interest rates are going to kill commodity prices and stocksInterest rates are going to crash commodity, stock prices and bonds.

Fractal dynamics analysis of commodities by CRB INDEXFractal dynamics analysis of commodities represented by the CRB INDEX in fractal relationship with the Morgan Stanley stock moved forward by 90 months, this road map detects the similarity of the Wyckoff phases and becomes a binoculars on the future of the direction of the commodity price , this study highlights a long-term future bullish trend in commodities.

I'm bullish on commodities in generalCrude oil confirmed this megaphone pattern which has a technical target at around $ 85. That target would break a 13 year old downwards sloping resistance. First Cobalt could follow the commodity market for a lucrative wave three but be careful with this pennystock as further correction (double three) is possible.

Palladium Back At $2,000!Following the peak of the Covid pandemic in March 2020 when price declined by 48%,
price turned around and gradually moved back to the upside, eventually breaching
the all-time high 11 months later.
In May 2021, price created a new all-time high at $3,017 before heading back down
towards the weekly 50 simple moving average.
The 50 simple moving average was an important catalyst in the growth of price and
appeared as though is was going to hold as support again in August 2021.
Price breached this indicator and has since moved further down to the next obvious
level of support: the psychological $2,000 round number.
If this support zone holds strong, we should soon see a bounce back to the upside
and a bull trend resumption.
The bigger picture shows us that price is in a long-term period of consolidation,
which began in February 2020. The all-time high in May 2021 was just a fake breakout.
For now, this commodity will likely prove challenging to invest in, so the safest option
is to wait for a break and close above the all-time high at $3,017 before considering
any long opportunities.
See below for more information on our trading techniques.
As always, keep it simple, keep it Sublime.

VEDL Aluminum processor.
Being that we are in a commodity super cycle im looking to play this one long as the price of metals continues to rise. there is a projected shortage in the Aluminum market and seeking a company that has the ability to mine the product

The CPI Fantasy And Commodity PricesRodney Dangerfield was one of my all-time favorite comedians. He was a master at the one-liner, and while his catchphrase was “I don’t get no respect,” he got plenty.
Rodney passed in 2004, but his legacy lives on in films. His role as Thornton Melon in the 1986 comedy classic Back to School continues to have a cult following. As he sat in an economics class, the professor created a theoretical company that sold widgets, the favorite product of academics. The lesson included funding the company and developing a marketing strategy for the widgets. Rodney’s character, already a wealthy businessman, attempted to point out the realities of starting a business, but the professor objected. Rodney then glibly asked the economist if his factory was in “fantasy land.”
While the film was a fictional comedy, there is a fine line between fiction and nonfiction. The US Federal Reserve continues to call rising inflationary pressures “transitory.” Long ago, the economists massaged the consumer price data to extract a core that excludes food and energy prices called “core CPI.” Thornton Melon would call the core data “fantasy land” as food and energy are the critical factors that take a bite out of consumers’ budgets.
Another significant increase in the inflation barometer
Core CPI is fantasy land
Look at the evidence- It costs more to power our lives and fuel our bodies
Transitory in Fed Speak and the literal definition is not the same
The trend is always your friend- Economists are behind the curve
Another significant increase in the inflation barometer
In June and July, the previous month’s consumer price index data was off the charts, indicating rising inflation. This month, the July CPI reading rose 5.4%, another sky-high level. While the number was in line with the market’s expectations, core CPI, excluding food and energy, was up 0.3% compared to the forecast level at 0.4%. The market interpreted the core number as less inflationary as it was below the expected reading.
Core CPI is fantasy land
Economists are social scientists, making their projections and interpretations highly subjective. They argue that core CPI better reflects inflationary pressures because food and energy prices can be highly volatile. Excluding them from the inflation barometer smooths the data.
In statistics, the science of data, hedonic regression is the application of regression analysis to estimate the impact of various factors on the price of demand for a good. Hedonics is commonly used in real estate pricing as a quality adjustment for price indices. When it comes to inflation, excluding food and energy from the CPI is similar.
The problem with core CPI is that food and energy make up a significant part of budgets. Rising prices for the products that fuel our lives and provide nutrition for our bodies is taking an ever-increasing bite out of paychecks is a reality, while eliminating them distorts the actual cost of living for the majority of people. Economists massage data. The US Federal Reserve relies on statistics in its monetary policy decision-making process. Thornton Melon would say that core CPI only exists in “fantasy land.”
Look at the evidence- It costs more to power our lives and fuel our bodies
Anyone that fills their car with gasoline, heats or cools their homes, or eats, will tell you that prices are a lot higher in August 2021 than they were in August 2020. Futures prices are real-time objective data as they reflect where buyers and sellers meet in a transparent environment. The evidence pointing to the reality of rising inflation from the August 2020 high to the August 13, 2021 closing level on the nearby futures contracts is clear:
Nearby NYMEX crude oil prices increased from $43.78 to $68.44 per barrel, an increase of 56.3%.
Gasoline moved from $1.4395 to $2.2626 per gallon or 57.2%.
Heating oil and distillate prices rose from $1.3054 to $2.0779 per gallon, a 59.2% rise.
Natural gas appreciated from $2.743 to $3.861 per MMBtu or 40.8%.
Corn rose from $3.53 to $5.6825 per bushel or 61.0%.
Soybeans rallied from $9.67 to $13.73 per bushel or 42.0%.
CBOT wheat increased from $5.5175 to $7.6225 per bushel or 38.2%.
Coffee rose from $1.3080 to $1.8275 per pound or 39.7%.
Sugar moved from 13.28 cents to 19.95 cents per pound or 50.2%.
Live cattle appreciated from $1.08225 to $1.28125 per pound or 18.4%.
Lean hogs are up from 56.70 cents to 86.525 per pound or 52.6% over the period.
The substantial increases in food and energy commodities paint a very inflationary picture. Moreover, the price rises reflect wholesale levels. Retail prices have risen far more over the past year. Yesterday, I paid over $4.20 per gallon for gasoline in Las Vegas, double the price last year. Food and energy prices are the tip of an inflationary iceberg. Education, health care, and housing costs are soaring. All raw material prices have moved appreciably higher.
Transitory in Fed Speak and the literal definition is not the same
In reality, prices are soaring in the Fed’s “fantasy land,” the core CPI data does not look all that bad as they only rose 0.3% in August. However, our food and energy bills went up a hell of a lot more last month.
Over the past months, the Fed blamed rising inflationary pressures on lumber, new and used car prices, and other “transitory” factors created by bottlenecks in supply chains and other pandemic-related factors. The academic ivory tower where the economists sit is far above ground zero, where consumers shop each day.
The definition of “transitory” is not permanent. Adjectives are temporary, transient, brief, short, short-lived, fleeting, and passing. “Transitory,” in a literal sense, requires an end date. So far, the Fed has not provided that data to the market. When asked about the period the central bank measures its 2% average inflation target, Chairman Powell replied it is “discretionary” or available for use at the user’s discretion. Transitory and discretionary is Fed-speak for leave it to us. They are non-answers to critical questions about the Fed’s interpretation and policy stance. Transitory reflects the central bank’s hopes and wishes, while discretionary tells us they will figure it all out someday.
The trend is always your friend- Economists are behind the curve
The bottom line is that the most objective measures of inflation are the wholesale futures prices and the retail costs of living. Food and energy prices are only a microcosm of rising prices across all asset classes. Money’s purchasing power is eroding because of the tidal wave of central bank liquidity and tsunami of government stimulus. Even if the Fed bites the bullet and addresses rising inflation, the government continues to spend without abandon. A $3.5 trillion budget initiative before the US Congress with an infrastructure rebuilding package only increases the debt level.
The Fed is living in “fantasy land” as inflation continues to rise. In August 2020, gold made a new record high. In May 2021, lumber, copper, and palladium prices rose to all-time peaks. Grains and oilseeds rose to eight-year highs in 2021. In July, coffee futures rose to their highest price since 2014. Bull markets in the volatile commodities sector rarely move in a straight line. The ascent of prices has been nothing short of a bull market relay race, with one commodity handing the baton to the next. The most recent recipient was the sugar market, which rose to over 20 cents per pound last week, the highest price since 2017. Even if we use statistical methods to smooth the bullish price action, the underlying trends reveal that the Federal Reserve’s approach to monetary policy is far behind the inflationary curve.
Inflation can be a challenging beast to tame. As it rises, the central bank’s refusal to acknowledge and address the economic condition will reward it with the lack of respect it deserves. We live in a stark reality created by policies that continue to erode money’s value.
Rodney Dangerfield was a comedian. There is a fine line between comedy and tragedy. If the approach to monetary policy that hides behind massaged data were not so tragic, it would be funny.
Use the link below to sign up for early access to articles.

RJA - a simple commodity solutionBuy the common sell the covered calls. Collect the small premium and place the premium collected in GGN with a 10% yield.
Sell the longest dated calls against the common.
Agricultural commodities have been rising in price.
All of the usual narratives apply:
global warming disruption. US midwest crop disruption based on rainfall and global warming - or not. Commodity super cycle starting as inflation heats up. Basic food price inflation.
Pick a comfortable narrative.
I own the common.
I sell the covered calls.
all the best

ridethepig | Copper for the Yearly Close📌 Copper for the Yearly Close
First with an immediate review of the flows.
We were tracking for the capitulation low which was our moment to advance...
It was a great choice of moment to load the longs.
Extending the belief in commodity shortages which have been entering into play all year long. The highs are worth striving for, all factors remain the same with the macro picture still equal. The main cases where this will play an additional note too at China and Australia flows which is something to consider.
After clearing our first targets it's time to aim for the 4.5 main impulsive zone. A flyaway break is in play with such a bullish close, which is generally not very common. Of course the last time this happened was in the early 2000's; and we exploded.
As usual thanks for keeping the feedback coming 👍 or 👎

Palladium Ready For A Breakout?Palladium looks set to make another attempt at breaking out of the 16 month period
of consolidation, which began in February 2020.
A break above the consolidation high at $2875 was made in April this year, but that
was short-lived as price returned back into the consolidation zone after being forced
down by the $300 round number psychological resistance level.
During the sideways market movement, price has still respected the 50 simple moving
average, which has acted as support, helping price create higher lows.
Last week we had a reversal just around the 50 simple moving average, which was shown
in a recent post, and this week price is gaining momentum and heading towards
resistance at $2875.
If this level is broken then we still have the $3000 round number and the all-time high
at $3017 in the way.
The long-term movement has been bullish prior to the consolidation period, so the bias
is for a break out to the upside.
Should we finally have a breakout, then we should see a linear trend unfold as this
commodity has trended really well in the past.
See below for more information on our trading techniques.
As always, keep it simple, keep it Sublime.

Gold, Bullish Reversal ImminentGood afternoon ladies and gents,
What a week it has been. Lots of beautiful setups all week on many dollar based pairs. Whilst all of that has been going on, I've been sniping entries on Gold in preparation for the reversal that will take place soon. The Monthly & Weekly Orderflow on this pair is Bullish. Despite the sharp drop after FOMC last week, the bias remains intact and as a matter of fact, I have even more conviction in this trade.
Technically speaking, Gold should rally as it's extremely undervalued and dropped directly into my Buy Zone where I'm looking for a solid reversal structure on the H4. Although it's not fully formed yet, I have a feeling that when Gold moves, it will be aggressive and it will not be moving in any other direction other than up and until those targets above are yet.
Fundamentally speaking, Gold may rally as Inflation is as its all time highs (catalysed by the incredibly high QE rate that took place last year) and CoT reports do point towards this commodity being bullish.
Here I give you a potential entry point and stop loss that provides an RR of 1:5/1:6; however, my entries on the lower timeframe provide a superior risk to reward.
Let's see what happens.
Trade at your own risk & manage your risk effectively should you trade this idea.
Until later
- AmplaFX

Cameco Corporation - A Commodity SupercycleTaking a brief look at the current Elliott Wave structure of Cameco Corporation, we notice the following:
A Zigzag structure is currently unfolding (5-3-5 substructure), this suggests that wave (c) = 61.8%, 100%, or 123.6% of wave (a).
If this structure is indeed valid, this bullish trend may last for several years, talk about a commodity supercyle.
Let us know about your thoughts in the comments below!
Cheers!
