May 2021 Copper - Corrective PatternUpdated: Corrective Pattern.
1. Fundamental Analysis
- Lack of news comes from China, which represents physical demand.
- Waiting for news from non-china (i.e USA: readings from initial claims, unemployment rate...), which show the extent each country are recovering after pandemic.
2. Technical Analysis
- Daily: Copper remains corrective pattern in daily timeframe . And it moves as Wave A-B-C as paragraph.
- In H1: I predict that Wave B are forming, and it can reach to 4.24 - 4.30.
Keep in mind that: 4.24 is resistance zone .
Search in ideas for "COMMODITY"

BTCUSD 03/03/2021 - CorrectionAfter making ATH in Feb 22, BTC declined around 26% (From 58K to 43k).
I expect the first wave of corrective pattern were formed. Currently, i expect the Wave B are forming. If prices can breakout successfully as i mention in my chart, i think price can reach higher level (from 52.5K to 55.1K).

June 2021 - Copper (03/03/2021)Fluctuating in wide range (4.04 - 4.37)
1. Fundamental Analysis
- Waiting for readings about U.S. factory orders, initial jobless claims and durable goods orders.
- Despite Caixin PMI services and indutries were not gud as expected. But, Lots of people remains optimistic.
- Sentiments about this market are seemingly improvement, even Chile annouced their production increased.
2. Technical Analysis
- Daily, Supporting level: 4.04.
- H4, price are fluctuating in a sideway. I expect that Copper need to accumulate, and then climb to former peak. (Around 4.30)

June 2021 - CopperCopper - Correction Ahead
1. Fundamental Analysis
- US Housing Data was quite disappointing.
- Equity market decline & the fear of rising US interest rates.
- In addition, I think copper market is waiting for news which comes from US ( US government's plan for boosting produce electric vehicles) and China (confirmation about speculative buying and demand through readings of Shanghai copper warehouse stocks).
2. Technical Analysis
- This market seems overbought, and there's a sign that people are taking profit.
- Currently, i think copper contracts are moving in a range | sideway (4.08 - 4.37).
- Intraday, prices can climb higher and reach a zone (4.30 - 4.33). It could be a good opportunity for sell to probe the strength of the market)


Cotton Cash Contract - Rectangle PatternCommodity: Cotton Cash Contract
Introduction:
Hello everyone! Today, we'll be analyzing the Cotton Cash Contract on the daily scale traded on Pepperstone. After a clear downward trend, the contract seems to have entered a consolidation phase, possibly forming a rectangle pattern.
Analysis:
The rectangle pattern we're observing has been forming for around 196 days. The upper boundary of this pattern is approximately at $90, which has been tested three times so far. Meanwhile, the lower boundary is at around $77.50, with two touch points to date.
Currently, the price hasn't managed to cross above the 200 EMA. However, if we observe a breakout above the upper boundary, it would place the price above the 200 EMA, potentially paving the way for a long entry.
Upon a valid breakout, our projected price target would be $100.660, translating into a potential price rise of approximately 13%.
Conclusion:
The Cotton Cash Contract's technical analysis suggests a consolidation phase marked by a potential rectangle pattern. A breakout above the upper boundary might signal a shift to a bullish trend and could provide an opportunity for a long position.
As always, be sure to conduct your own research and risk management before investing.
Thank you for tuning into this analysis. Please like, share, and follow for more insights into the market. Happy trading!
Best regards,
Karim Subhieh

$WEZ - Wesizwe Platinum: Bullish On Long-Term CycleCommodity stocks, like the underlying commodity they generate revenues from are well known to be cycle.
Looking at Wesizwe, it is no different. Since listing in 2006, the share has declined from an all time high of R16,50 to an all time low of 31 zac over twelve years.
The EWP puts this bear market into perspective. The entire bear is a zig zag pattern labelled (A) to (C). (A) is an impulse and (C) alternated into an ending diagonal.
The share did catch a bid during the post-covid commodity boom to peak at R2,90 and the share is currently in a pullback. Support is found around the 60 zac zone but reversals can happen above that zone.
This is a long-term cyclical play so as long as price remains above 31 zac, i will look for buying opportunities.


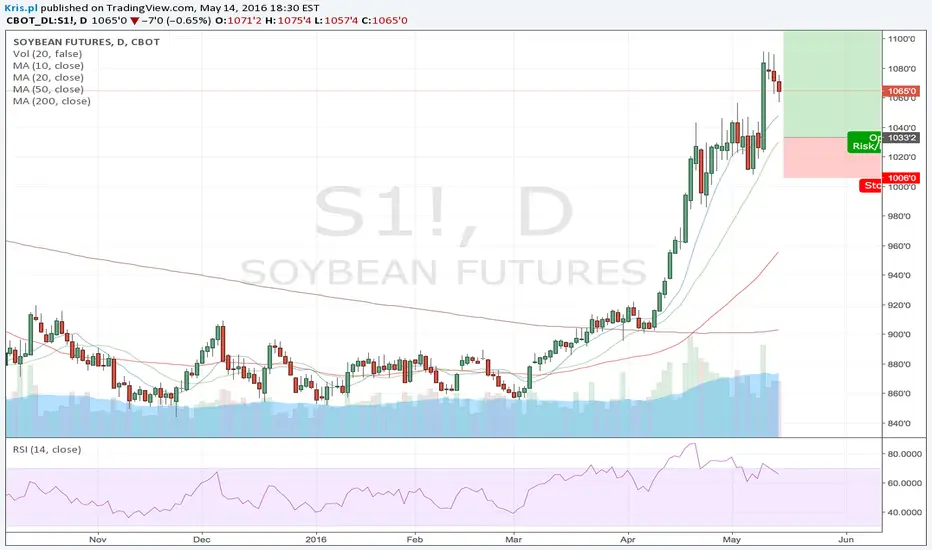
CommodityHeatmap - week 20 soybeanI know it's overbought but it looks like for the reason. Bigs guys support long side and there is strong seasonality for next 5 weeks so prefer to enter long on any retracement of this strong trend.
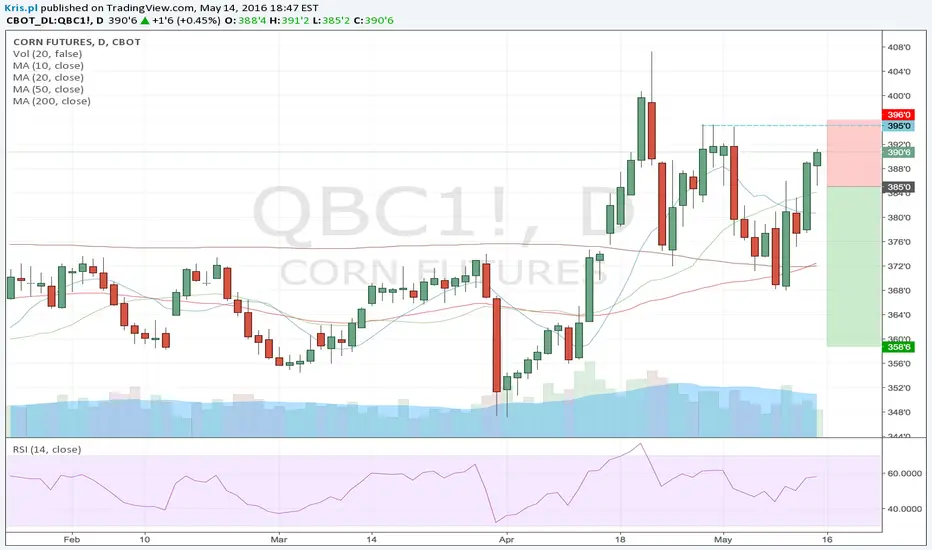
CommodityHeatMap week 20 - cornShort trade setup. Seasonality supports short side and big guys look to be positioned for short side although the price action is not that convincing so lets see if the support at about 395 holds and then go short on LL(1) on daily.
CommodityHeatMat week 20 AUDStrong seasonality is coming although big guys are still playing short. I will look for support on higher time frame. Possible test of the 200 MA on daily would be a good try. If it holds then I will get long stop HH(1)
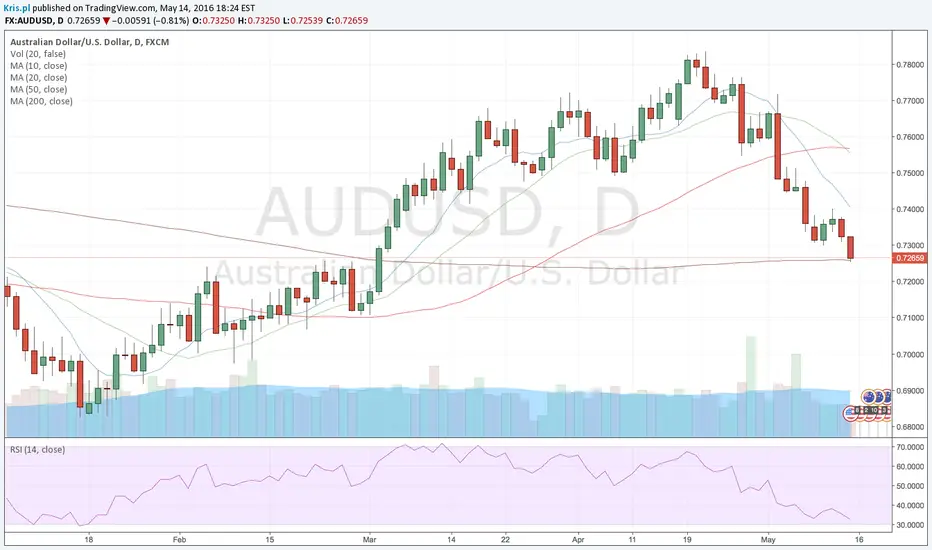
After Squeezing, AUDUSD Get's PoundedCommodity currencies (AUD, NZD, CAD) underwent a short-squeeze following the Federal Reserve's decision to leave rates from zero-to-25 bps, which is theoretically more supportive for commodity speculation. However, after market participants digested the ultra-dovish FOMC, commodity currencies got monkey-hammered lower.
AUDUSD was pushed higher to .7276 on Friday, following the pin bar created on Thursday's volatile price action. Essentially creating a triple-top. This level has acted a strong resistance. After being rejected, price action is at a support crossroads.
The pair close on price action support of .7180 and could look to challenge a minor uptrend support trend line, dating back to September 10.
A close below this level will open up a longer, intraday descending trend line, and further support could be tested at ,7137 and .7096.
Momentum is likely fading. The RSI sharply contracted, while the ADX looks to be rolling over. Further price action weakness could, eventually, lead into a +/- DMI bearish convergence.
However, if support holds, the pair may retest .7180 as it grinds along the uptrend. A break above .7180 could cause the pair to explode and test .7233 and .7273.
Even though the US dollar pulled back last week, there is still the perception that the Fed will hike this year. This will keep the dollar somewhat supported, while global growth concerns - including China, Australia and NZ - will weigh on AUDUSD.
I would encourage everyone to check out www.teachingcurrencytrading.com - thank you!
Please follow me on Twitter @Lemieux_26
Check my posts out at:
bullion.directory
www.investing.com
www.teachingcurrencytrading.com
oilpro.com

Bullish bounce?The Gold (XAU/USD) is falling towards the pivot which acts as a pullback support and could bounce to the 1st resistance.
Pivot: 2,790.01
1st Support: 2,721.96
1st Resistance: 2,929.89
Risk Warning:
Trading Forex and CFDs carries a high level of risk to your capital and you should only trade with money you can afford to lose. Trading Forex and CFDs may not be suitable for all investors, so please ensure that you fully understand the risks involved and seek independent advice if necessary.
Disclaimer:
The above opinions given constitute general market commentary, and do not constitute the opinion or advice of IC Markets or any form of personal or investment advice.
Any opinions, news, research, analyses, prices, other information, or links to third-party sites contained on this website are provided on an "as-is" basis, are intended only to be informative, is not an advice nor a recommendation, nor research, or a record of our trading prices, or an offer of, or solicitation for a transaction in any financial instrument and thus should not be treated as such. The information provided does not involve any specific investment objectives, financial situation and needs of any specific person who may receive it. Please be aware, that past performance is not a reliable indicator of future performance and/or results. Past Performance or Forward-looking scenarios based upon the reasonable beliefs of the third-party provider are not a guarantee of future performance. Actual results may differ materially from those anticipated in forward-looking or past performance statements. IC Markets makes no representation or warranty and assumes no liability as to the accuracy or completeness of the information provided, nor any loss arising from any investment based on a recommendation, forecast or any information supplied by any third-party.

The Bank of Japan expected to maintain negative rate levelsEUR/USD 🔼
GBP/USD 🔽
AUD/USD 🔼
USD/CAD 🔽
USD/JPY 🔼
XAU 🔽
WTI 🔼
As the rest of the world has been raising rates throughout most of 2022, Mitrade expects the Bank of Japan is likely to keep a negative rate level at -0.100%, with a possible policy shift in the short term. USD/JPY has increased by over 40 pips to 137.40, currently trading at 136.880, while USD/CAD is trading lower at 1.3642.
Meanwhile, the US dollar’s performance against other major currencies varied. The Euro and the Aussie increased a little over 10 pips to a closing price of 1.0605 and 1.2146 respectively. GBP/USD suffered minor losses at 1.2146.
China’s gradual re-opening sent WTI oil futures higher at $75.38 a barrel, but spot gold declined to $1,787.78 an ounce. Bitcoin just bounced back from a low of 16,372, recovering to 16,571.0.
The Dow Jones Industrial Average fell 162 points to 32,757 (-0.49%), the S&P 500 lost 34 points to 3,817 (-0.91), and the Nasdaq 100 decreased 159 points to 11,084.

Cooled private employment readings lower nonfarm estimatesEUR/USD 🔼
GBP/USD 🔽
AUD/USD 🔽
USD/CAD 🔼
USD/JPY 🔼
XAU 🔽
WTI 🔽
Yesterday, the ADP Nonfarm Employment change tracking the private sector showed 132,000 workers joined the labor market, significantly lower than the expected 300,000. The lackluster result raised doubts about the nonfarm payrolls provided by the US Bureau of Labor Statistics, which also has a 300,000 estimate for the month of August.
If the official figures also disappoint, the Federal Reserve is more likely to opt for a 50 bps rate hike rather than a 75 bps one. However, USD/CAD still managed to rise to 1.3127, currently trading at 1.3161, Canada's GDP growth was at 0.1% as predicted. USD/JPY first closed at 138.96, then reached a record high not seen after 1998, jumping to 139.53.
Regarding other major currencies, EUR/USD briefly went below the parity level again, but soon recovered to 1.0057. Eurozone’s headline inflation rate slightly surpassed original projections at 9.1%, and investors expect tonight’s German retail sales to record fewer losses. GBP/USD slid from 1.1692 to 1.1622, while the Aussie declined to 0.6839 against the greenback.
Gold futures declined to $1,726.2 an ounce. Yet another pipeline maintenance from Russia to Europe tightened the energy supply on the continent, and despite falling Crude Oil Inventories, WTI oil futures dropped and stabilized at $89.00 a barrel, before closing at 89.55.
More information on Mitrade website

SHORT SILVER XAGUSD 1 HOURSHORTS TO THE MAIN SUPPORT FOR HOURLY WHICH IS 15.800 LEVEL. AFTER SILVER WILL JUMP UP AGAIN SL AND TP PROVIDED. STOCH AND RSI CONFIRM SLIGHT DOWNTREND
