Soybeans vs USD: Breakout Robbery in Progress – Join the Escape!🚨💰🌱 Soybeans vs. US Dollar Commodities CFD Heist Plan (Swing/Day) 🕶️⚡
👋 Dear Ladies & Gentlemen… and my fellow Thief OG’s 🐱👤💵,
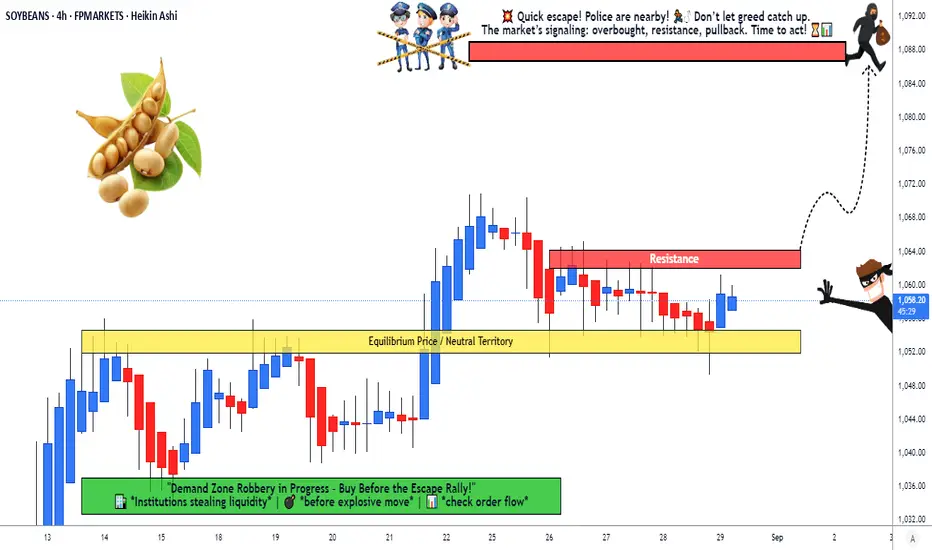
Tonight’s grand heist is in the Soybeans Vault 🌱💰 vs. the Mighty Dollar 💵.
We move Bullish 📈 – the loot is ripe, and the guards are weak!
🎯 The Master Heist Plan
Entry (Breakout Trigger): ⚡ 1065.00
👉 Once the vault door cracks open at 1065, we sneak in with Thief Layer Entries 🕶️🔪:
1063.00
1060.00
1055.00
1052.00
(Keep layering your entries, thief-style… the deeper the pullback, the fatter the loot 💎💸).
Stop Loss (Thief Escape Plan): 🏃♂️💨
📍 The secret tunnel is at 1040.00.
But hey thieves, adjust your SL 🔑 based on your strategy & risk appetite.
Target (Police Barricade 🚔):
👉 1088.00 – That’s where the cops set up the roadblock, so escape with the bag before they catch you 🏆💰✈️.
🕶️ Thief Trading Wisdom
Multiple buy limit layered orders = professional thief entry strategy.
Always confirm the breakout before layering in.
Police (market makers) will try to trap you – stay one step ahead 🐱👤⚡.
🔥 Boost our Robbery Plan if you’re part of the crew 💣💵!
The more likes & views, the bigger the gang grows 🚀.
#ThiefTrading 🕶️ #SoybeansHeist 🌱💰 #CommodityLoot 💸 #SwingTradePlan ⚡ #DayTradeRobbery 🐱👤 #USDvsSoybeans 💵 #BreakoutStrategy 📈 #LayerEntry 🔑 #TradingViewHeist 🚔 #MarketLootPlan
Search in ideas for "COMMODITY"
CFTC says cryptocurrency ether is a commodityCFTC says cryptocurrency ether is a commodity, and ether futures are net
Many in the cryptocurrency market have become short and stop hidden behind high)
I think today their feet will shave.
You can read the article below:
Last December, the Commodity Futures Trading Commission (CFTC) issued a public call for feedback to “better inform the Commission’s understanding” of the Ethereum network and the cryptocurrency ether.
Now CFTC Chairman Heath Tarbert, who just took over the role in July, has come to a decision on its status. Tarbert believes ether (ETH) is a commodity, and thus falls under the jurisdiction of the CFTC. He also anticipates ether futures trading on U.S. markets in the near future.
“We've been very clear on bitcoin: bitcoin is a commodity. We haven't said anything about ether—until now,” Tarbert said on stage at Yahoo Finance’s All Markets Summit in New York City on Thursday. “It is my view as chairman of the CFTC that ether is a commodity.”
Tarbert agrees with the SEC’s previous guidance that bitcoin and ether are not securities. And he says the CFTC is working with the SEC on these issues.
The CFTC first stated that it views “bitcoin and other virtual currencies” as commodities back in 2015 (long before the SEC did), buried in a filing when it brought charges against a company called Coinflip. But this is the first time the CFTC has given guidance on ether.
Tarbert acknowledges “ambiguity in the market” on the status of many coins, but says that ultimately “similar digital assets should be treated similarly.”
Perhaps most interestingly, Tarbert says that “forked” assets—cryptocurrencies like bitcoin cash (BCH), bitcoin gold (BTG), and ethereum classic (ETC), coins created via forks from the original underlying blockchain—should be treated by regulators the same as the original asset. In other words, the CFTC’s classification of each coin depends on how the coin was created.
“It stands to reason that similarly assets should be treated similarly. If the underlying asset, the original digital asset, hasn’t been determined to be a security and is therefore a commodity, most likely the forked asset will be the same,” Tarbert said, “unless the fork itself raises some securities law issues under that classic Howey Test.”
The “Howey Test” refers to a 1946 case involving the selling of shares in a citrus grove that the SEC now uses as its north star in determining whether a digital currency behaves like a security. SEC director of corporate finance Bill Hinman, speaking at Yahoo Finance’s All Markets Summit: Crypto in San Francisco in June of last year, explained that newly created tokens are likely securities because they are marketed with “the promise that the assets will be cultivated in a way that will cause them to grow in value, to be sold later at a profit,” and “typically are sold to a wide audience rather than to persons who are likely to use them on the network.”
Bitcoin and ether, on the other hand, Hinman and the SEC see as sufficiently decentralized and not controlled by a third party “whose efforts are a key determining factor in the enterprise.” Thus Hinman determined that sales of bitcoin and ether are not securities transactions.
CFTC Chairman Tarbert was asked on stage by Yahoo Finance’s Scott Gamm whether the Howey Test is really relevant anymore in 2019. He says it is: "I think the analysis is pretty sound. It has stood the test of time. Ultimately it goes to the fundamental question: is this something that is being used for capital raising, and are you investing in an enterprise, or are you buying something that has tangible store of value in and of itself?”
Tarbert also gave insight on how he and the CFTC view coins created through initial coin offerings (ICOs). He believes it is possible for a new coin to start out as a security but eventually become a commodity. “You can have a situation where something in an initial coin offering is a security initially, but over time, it gets more decentralized, and there's a tangible value there, so you can have things that change back and forth.”

Crude Oil - High Tide Pt.2Pt 1 found here .
This is an extremely critical market at this time. What must be understood, is NYMEX light crude oil is not its' own independent market, but rather a BENCHMARK for a larger market for crude oil globally, and its' derivatives. Consider a Kenyan bank, that owns a loan on a Kenyan gas station. What is the best instrument to hedge their investment? Well, obviously the answer is NYMEX:RB1! , NYMEX gasoline futures. The sovereign bond of gasoline prices so to speak.
Examining the market technically, we see that it appears bullish. The market experienced a severe panic in price during 2020, as demand and logistics collapsed in face of a global epidemic. However the price has recovered considerably, due to OPEC controls and the global necessity for this commodity. In fact, the market has even retested attempts made at reaching its 2008 high.
Many local market do not have access to global markets as might be expected, such as the NYSE and CME to conduct their day-to-day affairs. This highlights the importance of NYMEX:CL1! globally, not only for the physical delivery of light crude in the United States. But the global marketplace for light crude oil and its' derivatives, such as plastic containers, heating oil and cosmetic products. The reference price for such items by suppliers, is naturally the most liquid benchmark available to them. Which is to say, they will sell their product based on the most available market for their ingredients. A notion common in all business, to be examined at a global level to understand the relevance of this market into the future. This market exists in the United States, which is what underpins the importance of the US Dollar as this principle applies to all commodity and equity benchmarks. Furthermore, the principle of liquidity remains relevant all through history, where commodities as long as trade exists have been priced according to the most liquid benchmark.
The relevance of the US Dollar can most clearly be observed in global bond markets. As capital becomes scarce as Quantitative Easing globally comes to an end, and begins to flow towards the USA, creating the rally in $TVC:DXY. Rates in sovereign debt markets in the US and abroad have risen, and prices have fallen. A lack of demand in sovereign debt outside the USA is being realized, as FRED:RRPONTTLD RRP usage has risen since the beginning of the war between Ukraine and Russia. Because the USA is also the global benchmark for interest rates, due to its deep liquidity. Banks all around the globe balance and hedge their local debt based on this proxy market. For all intents and purposes, this is the only game in town.
It may seem odd that the price of crude oil in US Dollars has risen, given that the value of the US Dollar has risen significantly worldwide. Inflation domestically might dictate that the price of NYMEX:CL1! should fall, but this has not been the case. There is something beneath the surface, that indicates a deep value in this trade yet to be realised. Despite governments and activist organisations fighting against the product, its relevance in commerce has not diminished. Coupled with the importance of this global benchmark, the whole of oil-based product globally appears as important as ever. The market indicated last week the potential for a turning point, as it has capitulated. Traders should consider the market will likely make another low, but appears to be setting up for a rally.

29 valuable rules for trading the commodity market.In order to make a success trading in the commodity market, the trader must have definite rules and follow them. The rules given below were formulated by William Gann based upon his long personal experience and anyone who follows them will make a success.
*Chart of gold is just taken as an example of a popular commodity.
1. Divide your capital into 10 equal parts and never risk more then one-tenth of your capital on any one trade.
2. Always protect a trade when you make it with a stop loss order 1-3%, not more then 5% away from the entry.
3. Never overtrade.
4. Never let a profit run into a loss. After you once have a profit of more then 3% away, raise your stop loss order so that you will have no loss of capital.
5. Do not buck the trend. Never buy or sell if you are not sure of the trend according to your charts and rules.
6. When in doubt, get out and don't get in when in doubt.
7. Trade only in active markets. Keep out of slow, dead ones.
8. Equally distribute your risk. Trade in 2 or 3 different commodities if possible. Avoid tying up all your capital in any one commodity.
9. Never limit your order or fix a buying or selling price. Trade at the market.
10. Don't close your trades without a good reason. Follow up with a stop loss order to protect your profits.
11. Accumulate a surplus. After you have made a series of successful trades, put some money into a surplus account to be used only in emergency or in times of panic.
12. Never buy or sell just to get a scalping profit.
13. NEVER AVERAGE A LOSS. This is one of the worst mistakes a trader can do.
14. Never get out of the market just because you have lost patience or get into the market because you are anxious from waiting.
15. Avoid taking big losses and small profits.
16. Never cancel a stop loss order after you have placed it at the time you make a trade.
17. Avoid getting in and out of the market too often.
18. Be just as willing to sell short as you are to buy. Let your object be to keep with the trend and make money.
19. Never buy just because the price of a commodity is low or sell short just because the price is high.
20. Be careful about pyramiding at the wrong time. Wait until the commodity is very active and has crossed resistance levels before buying more and until it has broken out of the zone of distribution before selling more.
21. Select the commodities that show strong uptrend to pyramid on the buying side and the ones that show definite downtrend to sell short.
22. Never hedge. If you are long of one commodity and it starts to go down do not sell another commodity short to hedge it. Get out of the market, take your loss and wait for another opportunity.
23. Never change your position in the market without a good reason. When you make a trade let it be for some good reason or according to some definite rule. Then do not get out without a definite indication of a change in trend.
24. Avoid increasing your trading after a long period of success or a period of profitable trades.
25. Don't guess when the market is top. Let the market prove it is top. Don't guess when the market is bottom. Let the market prove it is bottom. By following definite rules you can do this.
26. Do not follow another mans advice unless you know that he knows more than you do.
27. Reduce trading after first loss: never increase.
28. Avoid getting in wrong and out wrong: getting in right and out wrong: this is making double mistakes.
29. Never trade on hope or fear.
When you decide to make a trade be sure that you are not violating any of these 29 rules which are vital and important to your success. When you close a trade with a loss, go over these rules and see which rule you have violated: then do not make the same mistake the second time. Experience and investigation will convince you of the value of these rules. Observation and study will lead you to a correct and practical theory for successful trading in commodities.

NZDUSD Daily Analysis: Anticipating a Slightly Bullish Bias.Introduction
Today, we focus on the NZDUSD pair, assessing if a slightly bullish bias is likely. Amid evolving fundamental factors and current market sentiment, the New Zealand Dollar to US Dollar (NZDUSD) may see subtle upward momentum, depending on several key drivers. Let’s explore these influences in more detail to help traders make informed decisions.
1. Recent NZ Economic Indicators
New Zealand's recent economic data shows a stable but cautious outlook, with moderate improvements in employment and inflation metrics. The Reserve Bank of New Zealand (RBNZ) has maintained a wait-and-see approach, prioritizing inflation control without aggressively tightening interest rates. Recent improvements in inflation data may continue to support the NZD, as stable inflation signals robust economic activity without undue financial strain. These trends encourage moderate investment inflows into New Zealand, providing slight upward pressure on the NZD.
2. Federal Reserve and US Economic Data
The US Federal Reserve’s recent signals suggest the potential for a pause in rate hikes. This dovish stance supports risk sentiment, favoring currencies like the NZD. If the Fed emphasizes an inflation-fighting stance with a cautious approach, risk sentiment could rise, supporting a slightly bullish bias for NZDUSD. Additionally, softer-than-expected US economic data may weigh on the USD, creating room for the NZD to gain traction.
3. Commodity Prices and Global Trade Dynamics
New Zealand's economy is heavily influenced by commodity prices, particularly dairy and agricultural exports. A recent uptick in global dairy prices is favorable for the NZD, as higher export revenues strengthen New Zealand’s trade balance and overall economic resilience. Improved trade relations between China and New Zealand may also bolster investor confidence in the NZD, as China is a major trade partner. Positive developments here could add to NZD strength against the USD.
4. Market Sentiment and Risk Appetite
Global risk sentiment plays a critical role in shaping the NZDUSD pair’s direction. The NZD often benefits in risk-on environments due to its status as a high-beta currency. Currently, with geopolitical uncertainties relatively controlled and a more stable global economic backdrop, risk appetite may support NZDUSD gains. If investors remain optimistic about global growth, the NZD’s appeal increases, leaning the bias towards a slight bullish trend.
Conclusion
In summary, the NZDUSD pair could exhibit a slightly bullish bias today, driven by favorable domestic economic indicators, the US Fed’s dovish stance, rising commodity prices, and stable market sentiment. This anticipated trend is subject to fluctuations, and traders are advised to keep a close eye on US data releases and global risk dynamics.
Keywords:
#NZDUSDanalysis,
#NewZealandDollar,
#USDollar,
#NZDbullishbias,
#ForextradingNovember12024,
#ReserveBankofNewZealand,
#FederalReserve,
#Commodityprices,
#Risksentiment,
#Forextechnicalanalysis,
#FundamentalfactorsinForex.

$ETH - Ethereum 2.0 (Serenity) - The ... COMMODITY?Will Ether Remain a Commodity After Ethereum 2.0 Upgrade?
The Ethereum 2.0 Upgrade Explained
When it comes to digital assets powered by blockchain technology, very few have been cleared by regulators from the status of a security. In fact, there have been just two: Bitcoin and ether. The latter constitutes the only digital asset that was funded through an Initial Coin Offering (ICO) and is not a security. The SEC stated the Ethereum Network was ‘sufficiently decentralized’ to escape the classification — and regulatory requirements — of a security.
That is, of course, so long as the Ethereum Network does not undergo significant changes. Over the course of the year, however, Ethereum will see perhaps the most significant change a blockchain can experience: a transition in its consensus mechanism.
Currently, Ethereum leverages a Proof-of-Work (PoW) consensus mechanism. Here, high-powered servers, referred to as nodes, compete to solve extremely complex mathematical puzzles in order to validate transactions and approve new blocks. Due to the difficulty involved, the servers have a remarkably high rate of electricity consumption. Due to this, PoW has received a bad reputation for its negative effects on the environment.
Sometime over the next 12 months however, Ethereum will shift to the much more environmentally friendly Proof-of-Stake (PoS) mechanism. The transition has been officially deemed the Ethereum 2.0 upgrade. Under the PoS model, nodes stake blockchain-specific wealth — in this case, ether (ETH) — to vote on and collectively approve new blocks.
Will Ether be a Security Token after Ethereum’s 2.0 Upgrade?
Whenever looking at the regulatory status of a digital asset, a variety of factors come into play. These include case-specific facts, circumstances, and economic realities surrounding the asset.
Despite being funded by an ICO — which of itself seems to typically constitute a securities offering — it was made known that the Ethereum Network was so decentralized that ether did not constitute a security. This shows then that the level of decentralization tied to a blockchain firm can affect its digital asset’s legal status.
That’s why some say a PoS model will only strengthen ether’s classification as a commodity. Under PoW, large mining pools band together to create greater hash power, which is commonly seen as mining centralization. With PoS, however, this centralized aspect is eliminated. Ultimately, this could strengthen the argument that ether — even after the Ethereum 2.0 upgrade — is not a security.
At the same time, the case isn’t so clear. With PoS, profits are distributed on a routine basis. They are also distributed based on a validator’s participation in the network, not on behalf of others which is sometimes the case with PoW.
If PoS is considered a profit-based system, where investors receive a portion of the network’s ‘returns’, a case for ether as a security could be a concern. If regulators took this path, ether could become a security token and would be subject to the corresponding regulations.
Others argue that the PoS model features similar distribution as seen in PoW, meaning ether will retain its status as a commodity. Importantly, if ether does remain a commodity, the United States may see regulated ether futures trading within the next months.
As for exactly what will transpire, we’ll have to wait and see.
What do you think will happen to ether’s regulatory status after the Ethereum 2.0 upgrade? Will it remain a commodity?
Market analysis
So, what's it gonna be?
We asked and the market answered ... $ETH is at an interesting spot now. Will the weekly 21MA provide resistance/support?
What I would love to see is a push above to $183 followed by a successful retest of the 21 weekly MA
ETHEREUM ROADMAP

NZDUSD Analysis: Potential Bullish Bias for October 30, 2024Discover the latest analysis on NZDUSD and explore the key market drivers that could impact the pair’s movements today. Is NZDUSD gearing up for a bullish trend?
---
Introduction
Today, October 30, 2024, NZDUSD could present a slight bullish bias, driven by key macroeconomic developments and currency market sentiment. In this article, we will analyze the factors influencing the potential appreciation of the New Zealand dollar (NZD) against the U.S. dollar (USD), including central bank policies, economic data releases, and general risk sentiment. For those tracking NZDUSD, these insights provide an up-to-date perspective for informed trading decisions.
Current Market Sentiment
The global financial market sentiment remains cautiously optimistic, reflecting a slight increase in risk appetite, which generally favors higher-yielding currencies like the NZD. A rebound in commodity prices also supports the New Zealand dollar, as New Zealand’s economy is heavily commodity-dependent, notably in dairy, forestry, and agriculture. This positive sentiment may give a short-term boost to NZDUSD, particularly as investors look to diversify amid uncertain U.S. economic data.
Key Drivers Influencing NZDUSD
1. RBNZ Policy Outlook
Recent signals from the Reserve Bank of New Zealand (RBNZ) suggest a steady stance, with the central bank keeping a cautious eye on inflation while avoiding any immediate rate hikes. The RBNZ’s approach is contrasting with the recent hawkishness from the Federal Reserve, yet a positive growth outlook in New Zealand still supports the Kiwi dollar. If the RBNZ indicates stability, NZDUSD may see a lift as investors view the NZD as an attractive option in a low-volatility environment.
2. U.S. Federal Reserve Policy and Economic Data
The U.S. Federal Reserve’s interest rate path continues to be a decisive factor in determining NZDUSD trends. If the Fed's upcoming economic data releases hint at any economic cooling, it could reduce demand for the U.S. dollar, potentially encouraging NZDUSD to move higher. Investors should keep an eye on any U.S. economic updates today, particularly in employment or inflation, as they might temper the USD's strength and further support the NZD.
3. Commodity Price Trends
As a key exporter of commodities, New Zealand’s dollar is highly correlated with global commodity price trends. A recent uptick in dairy prices, New Zealand’s primary export, has lent support to the NZD, as has a steady demand for agricultural and forestry products. If commodity prices maintain an upward trajectory, this could strengthen the New Zealand dollar, pushing NZDUSD higher.
4. Risk Sentiment and Geopolitical Considerations
Risk sentiment plays a crucial role in NZDUSD’s movement, as the New Zealand dollar is often viewed as a “risk-on” currency. Current stability in geopolitical factors, along with market optimism in global growth prospects, could continue to attract buyers to the NZD. Positive developments from Asian markets or constructive trade discussions could offer additional support to the NZD.
Technical Overview
The technical picture for NZDUSD also indicates potential for a slight upward bias. With NZDUSD hovering near a support level and moving averages hinting at a potential breakout, bullish momentum could drive the pair higher. Traders may want to watch for any break above the 50-day moving average as a potential entry point for a long position.
Conclusion
Overall, the NZDUSD outlook for today suggests a slight bullish bias, supported by a favorable risk sentiment, steady commodity prices, and nuanced central bank positions. While uncertainties remain, particularly with U.S. data releases, the fundamentals provide a supportive environment for a mild upward movement in NZDUSD.
Remember to follow this NZDUSD forecast closely to stay updated on any shifts in market sentiment or fundamental data impacting this currency pair.
SEO Keywords:
NZDUSD analysis,
NZDUSD today,
New Zealand dollar forecast,
NZDUSD bullish bias,
Reserve Bank of New Zealand policy,
Commodity prices,
Forex trading NZDUSD,
NZDUSD technical analysis,
NZDUSD forecast,
tradingview.

NZDUSD Slightly Bullish Bias on October 22, 2024 !NZDUSD Slightly Bullish Bias on October 22, 2024: Key Drivers and Analysis
As of October 22, 2024, the NZDUSD pair is showing signs of a slightly bullish bias in the forex market. This article will explore the fundamental factors influencing the New Zealand Dollar (NZD) and the US Dollar (USD) and why the Kiwi may have a slight edge today. Traders looking to capitalize on the current market conditions should closely monitor the following key drivers:
1. RBNZ Interest Rate Decision Impact on NZD
The Reserve Bank of New Zealand (RBNZ) has recently kept interest rates unchanged at 5.50%, signaling a neutral to slightly dovish stance. While there was no immediate hike, Governor Adrian Orr suggested the bank is maintaining a vigilant approach to inflationary pressures. New Zealand's economy has shown resilience, and the RBNZ’s cautious optimism has bolstered investor sentiment towards the NZD.
The decision to hold rates was expected, but the RBNZ's language about controlling inflation while keeping an eye on global growth has strengthened the Kiwi. Higher inflation control and an improving outlook could lead to more confidence in New Zealand's economy, giving the NZD some support.
2. US Dollar Strength Weakening
On the other side of the pair, the US Dollar has recently shown some weakness due to a combination of soft economic data and concerns over the future path of Federal Reserve policy. With inflation moderating and signs of a potential slowdown in the US economy, market participants are beginning to price in fewer interest rate hikes for the rest of the year.
Recent reports have shown softer-than-expected retail sales and housing market data in the US, which have dampened the USD's strength. Risk sentiment is turning slightly positive as traders look for opportunities in higher-yielding currencies like the NZD, which tend to benefit when the USD pulls back.
3. Commodity Prices Supporting the NZD
New Zealand’s economy relies heavily on the export of commodities, particularly dairy products, meat, and wool. Commodity prices have stabilized in recent weeks, providing underlying support for the NZD. Dairy prices, a key export, have remained robust, and any further uptick in commodity prices could push the Kiwi higher.
A slight improvement in global risk appetite is also benefiting commodity currencies like the NZD. The stabilization in China’s economic outlook, one of New Zealand's largest trading partners, is another bullish signal for the NZD. China's recovery from its slowdown earlier in the year could help support demand for New Zealand’s exports, giving the NZDUSD pair additional upside momentum.
4. Technical Analysis and Market Sentiment
From a technical analysis perspective, NZDUSD is approaching a key support level around 0.5850, and recent price action suggests that buyers are stepping in. The pair has been consolidating in a range between 0.5800 and 0.5900, and if it breaks above the 0.5900 resistance level, it could signal further gains.
Market sentiment, as reflected by the Commitment of Traders (COT) report, shows that speculators have slightly increased their long positions in the NZD, indicating growing confidence in the Kiwi’s potential for upside movement.
5. Global Risk Sentiment and Geopolitical Factors
Geopolitical tensions, particularly in the Middle East and concerns over global trade, are playing a role in shaping risk sentiment. However, the current environment is less focused on extreme risk-off scenarios, allowing risk-sensitive currencies like the NZD to perform well in the short term. As long as global markets remain relatively calm, we could see further upside for the NZDUSD pair.
Conclusion: NZDUSD Outlook for October 22, 2024
In summary, the NZDUSD pair is expected to maintain a slightly bullish bias today due to a combination of factors including stable commodity prices, the RBNZ's cautious optimism, and US Dollar weakness. Traders should watch key levels such as 0.5900 on the upside, as a break above this level could indicate a more extended bullish move.
For those trading NZDUSD today, consider the broader fundamental factors and technical levels to capitalize on potential opportunities in this currency pair. Keep an eye on any surprises from the US economic data later in the day, as this could add volatility to the market and potentially influence the USD’s performance.
Keywords for SEO:
- NZDUSD analysis October 2024
- NZDUSD forecast today
- New Zealand Dollar fundamental factors
- RBNZ interest rate impact on NZD
- USD weakness 2024
- Commodity prices and NZDUSD
- Forex market analysis NZDUSD
- NZDUSD technical levels
- NZDUSD trading strategy October 22 2024
- Forex trading NZD

Crude Oil Correction - Another US Policy MisstepIn early July 2021, nearby NYMEX crude oil futures rose to the highest price since 2014 after rising to a high of $76.98 per barrel. The price eclipsed the October 2018 $76.90 high by only eight cents.
The crude oil futures market ran out of upside steam at the early July high and has made lower highs over the past seven weeks. At around the $62 per barrel level at the end of last week, the September futures contract was in a short-term bearish trend. Meanwhile, over the past year, the energy commodity made great strides on the upside.
Virus variants and China weigh on the energy commodity
US energy policy is bullish for crude oil
A bull market since April 20, 2020
The US administration and crude oil- Comedy or Tragedy?
Levels to watch in crude oil
The most recent selling reflects a long-overdue correction. The slowing Chinese economy, along with other factors, is likely weighing on crude oil. Crude oil futures take the stairs to the upside during rallies and an elevator lower when the price corrects. While we could see lower prices over the coming weeks and months, the underlying support issues facing the energy commodity suggest that it is not a time to become too bearish on petroleum as it continues to power the world.
Virus variants weigh on the energy commodity
As the delta variant of COVID-19 spreads throughout the unvaccinated population, with reports of some breakthrough cases in those who received vaccines, economic activity has begun the slow. Fears of a return of widespread cases have caused economic growth to slow. Meanwhile, China has cracked down on some sectors of its business sector that raise capital in the west, causing its economy to cool over the past weeks. The demand for energy has begun to decline, sending the crude oil price to its lowest level since late May over the past week.
The chart of the now active month October NYMEX crude oil futures highlights the decline from a high of $74.77 per barrel on July 6. In July and August, crude oil has made lower highs and lower lows, falling to $61.82 on August 20, the lowest price since May 21. The next level of technical support stands at the May 21 $60.68 low on October futures.
Open interest, the total number of open long and short positions in the NYMEX crude oil futures market, has declined from 2.414 million contracts on July 6. The decline reflects long liquidation. Falling price and declining open interest are not typically a technical validation of an emerging bearish trend. Price momentum and relative strength indicators have dropped to oversold territory. As crude oil has been correcting slowly and not taking an elevator shaft lower, daily historical volatility was just below 27% on August 20.
Over the past week, the prospects for higher US interest rates lifted the US dollar index to its highest level in 2021. The dollar index rose over the 93.47 March high. A stronger dollar tends to weigh on commodity prices, and crude oil is no exception. However, the Fed canceled its in-person Jackson Hole event, citing the rising number of delta variant cases. We will soon find out if the central bank decides to stall tapering quantitative easing because of the virus. A prolonged period of inflationary monetary policy could cause raw material prices to resume their ascent.
US energy policy is bullish for crude oil
President Biden pledged to address climate change during his 2020 campaign. Following that promise, he canceled the Keystone XL pipeline project on his first day in office by issuing an executive order. In May, the administration banned oil and gas drilling and fracking on federal lands in Alaska. While crude oil demand has been booming over the past months, US output stood at 11.4 million barrels per day as of August 13, 13% below the record high of 13.1 mbpd in March 2020.
Meanwhile, US crude oil and oil product inventories have declined in 2021.
According to the American Petroleum Institute, US crude oil stockpiles declined by 51.508 million barrels from January 1 through August 13, 2021. Gasoline stocks were 4.9509 million barrels lower, and distillate inventories dropped by 9.571 million barrels.
The Energy Information Administration data shows a 57.8 million barrel drop in crude oil stocks, with gasoline inventories 8.4 million barrels lower so far this year. Distillates have declined by 13.9 million barrels. US daily production has increased from 11.0 mbpd to 11.4 mbpd since early January, but it is insufficient to keep stockpiles from falling.
US energy policy is weighing on output as increased regulations, and a shift to a greener path for powering the US causes fossil fuel production to decline. Meanwhile, crude oil and oil product prices have moved substantially higher in 2021:
Nearby NYMEX crude oil futures closed 2020 at $48.42 per barrel. At $62.32 per barrel on August 20, the energy commodity was over 28.7% higher even after the recent correction.
Nearby NYMEX gasoline futures closed 2020 at $1.4238 per gallon. At $2.0236 on August 20, the fuel was 32.1% higher for the year.
Nearby NYMEX heating oil futures, a proxy for distillate prices, settled at $1.4832 per gallon at the end of December 2020. At $1.9082 on August 20, distillate prices rose by 28.7%.
While the US is on a greener path of energy production or consumption, the US and the world continue to rely on crude oil and oil products for power.
For decades, the US struggled to achieve energy independence from the Middle East, home to over half the world’s crude oil reserves. Over the past years, rising shale production and a drill-baby-drill and frack-baby-frack policy caused the US to take the leadership role in output, achieving its goal. The change in energy policy under the Biden administration has shifted crude oil’s pricing power back to OPEC and the cartel’s partner, Russia. As the Saudi oil minister said earlier this year, “Drill-baby-drill is gone forever.”
A bull market since April 20, 2020
At the height of the global pandemic, energy demand evaporated. Nearby Brent crude oil futures fell to the lowest price of this century at $16 per barrel. NYMEX futures fell below zero as the landlocked crude oil ran out of storage as inventories exploded.
As the monthly chart shows, at over the $62 level on August 20, 2021, crude oil futures remain over $100 per barrel higher than the April 20, 2020, negative $40.32 low. While the nearby futures have corrected by nearly $15 since the early July high, they remain in a bullish trend since the April 2020 low.
The US administration and crude oil- Comedy or Tragedy?
If the Biden administration should have learned anything from the current debacle in Afghanistan, timing is everything. The administration misjudged the Taliban’s ability to swoop across the country’s 34 provinces and capture its capital, Kabul, in short order. Transporting US citizens and Afghanis that assisted the US became a tragic chapter for the world’s wealthiest nation and leading military power.
Two weeks ago, before crude oil corrected, the Biden administration appealed to OPEC+ to produce more oil as gasoline prices had risen to multi-year highs. Opposition party Republicans and environmentalists noted that the President casts himself as a climate warrior moving the US towards cleaner energy to protect the planet. The request for OPEC to increase output only makes sense if their production comes from sources away from the earth.
After suffering under increasing shale production over the past years, OPEC+ does not have the US’s best interests at heart. The cartel is more likely to structure production policy to squeeze US consumers. After all, producing one barrel at $100 yields a better return than two at the $40 level.
The Biden administration has been in office for the past seven months. Immigration, Afghanistan, and energy policies have been far from successes over the period. One sector of the market could benefit from the events transpiring in Afghanistan. With banks closed, one of the few ways people can leave with life savings is to protect them in computer wallets in the cloud. Cryptos allow for transport on flash drives or access in other areas of the world via a secure password. Bitcoin, the leading cryptocurrency, posted gains over the past five consecutive weeks. The correction after the parabolic rally found a bottom. Flight capital is another reason supporting cryptos in a volatile world.
Levels to watch in crude oil
US energy policy remains bullish, despite the current correction in the crude oil futures market. OPEC and the Russians are not likely to cooperate with the Biden administration and heed the call for more output. They are more likely to cut production given the foreign policy tensions and signs of weakness in Afghanistan.
The NYMEX crude oil’s weekly chart shows support levels at $61.56, $57.25, and $33.64 per barrel. As crude oil is heading towards the end of the driving season, delta variant cases are rising, and the US and Chinese economies are slowing, a deeper correction is possible. Meanwhile, with OPEC+ back in control of the marginal oil barrel, the medium and long-term prospects for the energy commodity remain bullish. I expect higher highs in crude oil in 2022 and beyond.
US energy policy towards a greener path will change the oil market’s dynamics over the coming decades. Still, as petroleum continues to power the world in the medium term, the move to protecting the planet will lift oil’s price and fill OPEC+’s pockets over the coming years. I am short crude oil from a trend-following perspective, but US energy policy is likely to cause the fossil fuel to find a bottom at a higher level over the coming weeks. Follow those trends, they are your only friends.
-----
Use the link below to sign up for free early access to articles.
Trading advice given in this communication, if any, is based on information taken from trades and statistical services and other sources that we believe are reliable. The author does not guarantee that such information is accurate or complete and it should not be relied upon as such. Trading advice reflects the author’s good faith judgment at a specific time and is subject to change without notice. There is no guarantee that the advice the author provides will result in profitable trades. There is risk of loss in all futures and options trading. Any investment involves substantial risks, including, but not limited to, pricing volatility , inadequate liquidity, and the potential complete loss of principal. This article does not in any way constitute an offer or solicitation of an offer to buy or sell any investment, security, or commodity discussed herein, or any security in any jurisdiction in which such an offer would be unlawful under the securities laws of such jurisdiction.

Bitcoin: A Commodity?Bitcoin has long been a favorite for those looking for an alternative to centralized fiat money. Although I always thought bitcoin was promising, the technological aspect always held safety and liquidity concerns. Due to the fact that it is hard to prove peer-to-peer transactions, financial institutions - especially in the U.S. - have strict policies and layers of purchase authenticity that make buyers wait from a few hours or longer to actually receive the bitcoin.
Could the inception of other bitcoin trading products add to liquidity or the general acceptance of bitcoin? Recently, the Commodity Futures Trading Commission (CFTC) has designated that bitcoin is a commodity. By doing so, adding bitcoin derivatives is an attempt to regulate the bitcoin market.
Some find it strange that the CFTC has said that bitcoin, among other digital currencies, has the same properties as physical commodities like gold or oil. It is true that there is a defined supply of bitcoin, but it is more than likely that the designation is more of an attempt to regulate than to legitimize bitcoin as a true commodity.
Furthermore, the addition of bitcoin derivatives could simply open up the bitcoin market to more traders. Because let's face it, on a day-to-day period, trading bitcoin can be a snooze-fest. With futures trading being as digital as bitcoin, less than five percent of futures are ever exercised for delivery which may lead to more bitcoin speculation.
One thing is certain: bitcoin could an alternative to traditional safe-haven assets. For the last year, I have been the only one, that I know of, that has noticed that bitcoin has been trading the inverse of the most traditional safe-haven - gold. Bitcoin's largest movements seem to stem from money flowing in and out of gold.
Unfortunately, in a crisis situation, I believe gold would win because it is tangible and that is physiologically comforting. If gold garners support from another central bank led financial crisis, bitcoin could see dark days.
Please follow me on Twitter @Lemieux_26
Check my posts out at:
bullion.directory
www.investing.com
www.teachingcurrencytrading.com
oilpro.com

NZDUSD Analysis for November 6, 2024: Slight Bullish Bias Amid.As of November 6, 2024, NZDUSD shows a slight bullish bias amid a variety of fundamental factors influencing the currency pair. With recent market conditions shifting, the New Zealand dollar (NZD) gains some support against the US dollar (USD). Let's delve into the primary factors that could drive NZDUSD today.
Key Drivers Supporting a Bullish Bias for NZDUSD
1. New Zealand Economic Resilience
New Zealand’s economic fundamentals continue to show resilience, with recent data indicating stable inflation and a manageable interest rate environment. These conditions provide a supportive backdrop for the New Zealand dollar, encouraging modest gains against the US dollar.
2. US Dollar Weakness on Rate Expectations
The USD has shown signs of weakness due to shifting expectations around the Federal Reserve's monetary policy. Recent statements from the Fed suggest a dovish approach may prevail, potentially signaling fewer rate hikes in the near term. This sentiment dampens the USD’s appeal, providing a tailwind for NZDUSD's bullish momentum.
3. Positive Risk Sentiment
Risk sentiment remains moderately positive in global markets, which often benefits higher-yielding currencies like the NZD. Investors appear more optimistic, drawing them towards risk assets and risk-associated currencies. This trend is likely to support NZDUSD in the near term, especially if risk sentiment persists.
4. Commodity Prices Influence
NZD is historically correlated with commodity prices, and recent stability in commodity markets has provided additional support for the currency. As New Zealand is a major exporter of dairy and other commodities, the steady prices bolster NZD, adding strength to the bullish case for NZDUSD.
Technical Indicators Show Cautious Optimism
Technically, NZDUSD is trading above key moving averages, further confirming a slight bullish trend. If the pair holds above the 0.5900 support level, we could see an attempt to test the 0.5980 resistance, driven by today’s bullish sentiment and the outlined fundamental factors.
Conclusion
In conclusion, today’s analysis suggests a slightly bullish bias for NZDUSD, driven by New Zealand’s economic stability, US dollar softness, favorable risk sentiment, and supportive commodity prices. Traders should monitor any changes in Fed policy or risk sentiment that could alter this outlook.
Tags:
- NZDUSD analysis
- New Zealand dollar forecast
- Forex market trends
- US dollar outlook
- Federal Reserve rate impact
- NZDUSD November 6, 2024
- Risk sentiment currency trading
- Forex bullish trends
- Commodity currency

NZD/USD Analysis for October 24, 2024: Slight Bullish Bias!!The NZD/USD currency pair is currently exhibiting a slight bullish bias as of October 24, 2024. Several key fundamental factors and market conditions are influencing this upward movement. This article highlights these key drivers and provides insights for traders seeking to navigate the current market landscape.
Key Drivers Behind the Bullish Bias for NZD/USD
1. Optimistic New Zealand Economic Outlook:
- Recent economic data from New Zealand has shown positive signs, particularly in employment growth and inflation figures. The unemployment rate has remained low, and inflation is expected to stay within the Reserve Bank of New Zealand's (RBNZ) target range. This optimism surrounding the country's economic recovery is helping support the New Zealand dollar (NZD).
- Additionally, the RBNZ's stance on potential interest rate hikes has strengthened the Kiwi, as the central bank continues to signal a gradual tightening of monetary policy to control inflation.
2. Weaker U.S. Dollar:
- Despite the strong performance of the U.S. economy in previous months, the U.S. dollar (USD) has experienced some weakness due to changing market sentiment. Investors are anticipating that the Federal Reserve may begin slowing the pace of interest rate hikes in the coming months, which has caused some softening of the USD.
- Any indication that the Federal Reserve might take a more dovish approach to its monetary policy can impact the strength of the USD, favoring other currencies like the NZD in the short term.
3. Commodity Price Recovery:
- The New Zealand dollar is closely tied to global commodity prices, especially agricultural products like dairy, which make up a significant portion of New Zealand’s exports. Recent recovery in commodity prices, including higher demand from key trading partners like China, has boosted the NZD.
- Rising dairy prices have a direct positive impact on New Zealand's economy, which further strengthens the Kiwi against the USD.
4. China's Economic Performance:
- China is one of New Zealand’s largest trading partners, and the health of the Chinese economy is closely monitored by Kiwi traders. Recent data suggesting that China’s economic growth is stabilizing has been a positive sign for New Zealand’s export market. A stronger Chinese economy typically benefits the NZD, as it supports demand for New Zealand’s exports.
- The easing of global supply chain disruptions and improving trade relations between New Zealand and China have also been favorable for the NZD.
5. Risk-On Sentiment in Global Markets:
- Investors are showing a growing risk appetite in the global financial markets, leading to more demand for riskier assets, including the NZD. As the NZD is often seen as a "risk-on" currency, it tends to perform well when investors are more willing to take on risk, especially in times of global market stability.
- The U.S. dollar, in contrast, is viewed as a safe-haven currency and tends to weaken when investors shift towards higher-risk currencies like the NZD.
Technical Analysis
From a technical perspective, the NZD/USD pair shows potential for further upside momentum based on key indicators:
- Moving Averages: The 50-day moving average is trending upwards, indicating growing momentum in the short term. If it crosses above the 200-day moving average, this could confirm a bullish trend.
- Relative Strength Index (RSI): The RSI is currently in neutral territory, hovering around 55, which suggests there is still room for the NZD to gain before it becomes overbought.
- Support and Resistance Levels: NZD/USD has found strong support near the 0.5800 level, while resistance is seen around 0.5950. A break above this resistance level could signal more bullish momentum in the pair.
Conclusion:
In summary, the NZD/USD currency pair is expected to maintain a slightly bullish bias on October 24, 2024, driven by positive New Zealand economic data, weaker U.S. dollar sentiment, rising commodity prices, improving Chinese demand, and a risk-on environment in global markets. Traders should keep an eye on both fundamental and technical indicators for potential opportunities to capitalize on this bullish momentum.
Keywords for SEO:
- NZD/USD analysis,
- NZD/USD forecast October 24, 2024,
- New Zealand dollar bullish bias,
- NZD/USD technical analysis,
- Fundamental drivers for NZD/USD,
- U.S. dollar weakness impact on NZD,
- Commodity prices and NZD,
- RBNZ interest rate policy,
- Risk-on sentiment in forex markets,
- NZD/USD price outlook for today.

Silver Price Analysis: Exploring Resistance, CP, Volume, Events Upon analyzing the chart, it is evident that silver has been trading within a parallel channel for almost a year, indicating a well-defined price range. In the previous trading session, the price of silver reached the resistance line of this channel. For short-term traders, a critical resistance level to watch is 74060. If this level is not surpassed convincingly, it could lead to a potential downturn towards the control price (CP) line. It is worth noting that silver has yet to test the CP line and the 100-day moving average (MA) successfully.
Taking into consideration the parallel channel pattern, it suggests that silver prices may experience a decline towards levels around 73000 , 71800 , and 71360 .
Furthermore, volume plays a significant role in the current scenario. Short-term investors should be cautious and await a successful breakout of the channel for a potential upside move towards price levels of 74900 , 75560 , and even exceeding 76800 . Monitoring the volume and price action closely will provide further insights into the market direction and potential trading opportunities.
As a market participant, it is important to closely monitor the following market-moving events, as they have the potential to impact the prices of gold, silver, crude oil, and natural gas:
Monday, Jun 12, 2023
23:30 Federal Budget Balance (May) and Note Auctions: These events have a medium impact and can provide insights into the economic health of the country, potentially influencing investor sentiment and market movements.
Tuesday, Jun 13, 2023
11:30 Employment & Unemployment, Avg Earning Index, Claimant Count Change: These medium-impact events provide crucial data on the labor market, which can have a significant effect on commodity prices.
18:00 CPI and Core CPI: These high-impact events reveal the inflation rate, which is closely watched by traders as it can impact the value of commodities.
Wednesday, Jun 14, 2023
02:00 API Weekly Crude Oil Stock: This medium-impact event discloses the inventory levels of crude oil, which can influence crude oil prices.
18:00 PPI and Core PPI: These medium-impact events measure changes in producer prices and can affect commodity prices.
20:00 Crude Oil Inventories: This high-impact event reports the weekly changes in crude oil stocks, which can impact the price of crude oil.
23:30 Fed Interest Rate Decision & Projection, and FOMC Economic Projections & Statement: These high-impact events provide insights into the monetary policy decisions of the Federal Reserve, which can have a broad impact on commodity markets.
Thursday, Jun 15, 2023
00:00 FOMC Press Conference: This medium-impact event involves a press conference following the Federal Reserve's interest rate decision, providing further context and potential market-moving statements.
18:00 Import Prices MoM & YoY: This low-impact event reports changes in import prices, which can indirectly affect commodity prices.
20:00 EIA Natural Gas Stocks Change: This low-impact event reveals the weekly changes in natural gas inventories, potentially impacting natural gas prices.
Friday, Jun 16, 2023
01:30 Net Long-term TIC Flows: This low-impact event discloses the flows of international capital, which can have an indirect impact on commodity markets.
17:15 Fed Waller Speech: This low-impact event involves a speech by a Federal Reserve official, which may provide insights into monetary policy and influence market sentiment.
19:30 Michigan Consumer Sentiment: This medium-impact event measures consumer confidence, which can affect demand for commodities.
Monitoring these events will help traders and investors stay informed about potential catalysts that can impact the prices of gold, silver, crude oil, and natural gas.

Sugar and FCOJ Take the Bullish BatonThe soft commodities sector of the commodity market can be highly volatile. Historically, sugar, coffee, cotton, cocoa, and frozen concentrated orange juice futures that trade on the Intercontinental Exchange have doubled, tripled, and halved in value over short periods. While clothing and other consumer goods depend on the cotton market, the other sector members are foods.
The soft commodity sector rose in 2021, and Q1 2022
Coffee and cotton rose to multi-year highs in 2022
FCOJ takes off on the upside in April and makes a new multi-year high
Sugar could be next for three reasons
Trading softs from the long side- Buy those dips
Brazil is the world’s leading producer and exporter of three of the soft commodities; sugar, coffee, and oranges. Sugar comes from two sources, sugar beets and sugarcane. Brazil’s tropical climate makes it the leading sugarcane producer. Arabica coffee beans are popular in the US and other areas, while Robusta beans produce espresso coffees. Brazil leads the world in Arabica production. While many people associate orange production with Florida and California, Brazil is the world’s top orange producer. Cocoa, the primary ingredient in chocolate confectionery products, comes mainly from West Africa, as the Ivory Coast and Ghana produce over 60% of the world’s annual supplies.
Soft commodities are agricultural products, so the weather in growing areas typically determines the prices each year. Since the 2020 pandemic, the price action has been anything but ordinary.
The two latest soft commodities to lead the sector on the upside have been sugar and FCOJ futures.
The soft commodity sector rose in 2021, and Q1 2022
In 2021, the composite of the five soft commodities that trade in the futures markets on the Intercontinental Exchange rose 31.57%. In Q1 2022, the softs added to gains, rising 6.58%, with all five members posting gains.
Cotton futures led the softs higher with a 20.51% gain. Cocoa futures moved 5.16% to the upside, with FCOJ posting a 3.86% gain. Sugar rallied 3.23%, and Arabica coffee futures eked out a 0.13% gain.
Meanwhile, coffee and cotton rose to new multi-year highs during the first three months of 2022.
Coffee and cotton rose to multi-year highs in 2022
In June 2020, coffee futures made a higher low under the $1 per pound level before taking off on the upside.
The weekly chart shows the bullish trend of higher lows and higher highs that took coffee futures to $2.6045 per pound in early February 2022. Coffee futures rose to the highest price since 2011.
Cotton futures also rose to the highest level since 2011, peaking at the $1.4614 per pound level in April 2022.
Coffee futures were over the $2.20 level, with cotton above $1.40 on April 14.
FCOJ takes off on the upside in April and makes a new multi-year high
Frozen concentrated orange juice futures are the least liquid of the five soft commodities, based on daily volume and open interest metrics. While the FCOJ futures arena rose to a new multi-year high in Q1 2022, the bullish price action continued in April with higher highs.
The chart shows that nearby FCOJ futures rose to $1.8660 per pound last week, the highest level since March 2017. The all-time high in the orange juice market came in 2016 at $2.35 per pound.
Brazil is the leading producer and exporter of oranges and Arabica coffee beans. The South American country also is the leader in free-market sugarcane production and exports.
Sugar could be next for three reasons
Sugar futures rose to 20.69 cents per pound in November 2021, the highest price since February 2017.
The weekly chart shows that sugar futures were above the 20 cents per pound level last week. Sugar is approaching the first technical resistance level at the November 2021 20.69 cents high. Above there, the next target is at the October 2016 23.90 high, which is a technical gateway to the 2011 36.08 cents per pound peak.
Three factors support sugar prices in April 2022:
Rising inflation is lifting all commodity prices, and the trend is always your best friend in markets across all asset classes.
Rising crude oil and natural gas prices support sugar. Crude oil is over the $100 per barrel level, and natural gas stopped just short of $7 per MMBtu last week. Multi-year highs in the energy market support sugar as it is the primary input in Brazilian ethanol production. As more sugarcane goes into ethanol production, less is available for exports.
Sugarcane production costs are increasing as they are labor-intensive. The rising Brazilian real makes sugar more expensive to produce.
The chart illustrates the technical breakout to the upside in the Brazilian currency against the US dollar. A higher real increases the cost of production, putting upside pressure on sugar’s price.
Trading softs from the long side- Buy those dips
Stocks and bonds have been shaky in 2022, and cryptocurrencies have not yet of the slump that took prices lower since the November 2021 highs. Commodities have been the place to be for investors and traders over the first four months of 2022. The latest inflation report will likely keep the bullish party in raw material markets going.
I remain bullish on soft commodities as they are highly volatile and can offer explosive returns. Sugar is my top choice as of April 15, as the sweet commodity loosed poised to eclipse the 2021 high on its way to higher ground. Meanwhile, I favor all soft commodities in the current environment. The optimal approach to the sector has been buying on price weakness, and I expect that to continue. Bull markets rarely move in straight lines, and corrections can be the best route to optimizing returns over the coming weeks and months.
--
Trading advice given in this communication, if any, is based on information taken from trades and statistical services and other sources that we believe are reliable. The author does not guarantee that such information is accurate or complete and it should not be relied upon as such. Trading advice reflects the author’s good faith judgment at a specific time and is subject to change without notice. There is no guarantee that the advice the author provides will result in profitable trades. There is risk of loss in all futures and options trading. Any investment involves substantial risks, including, but not limited to, pricing volatility, inadequate liquidity, and the potential complete loss of principal. This article does not in any way constitute an offer or solicitation of an offer to buy or sell any investment, security, or commodity discussed herein, or any security in any jurisdiction in which such an offer would be unlawful under the securities laws of such jurisdiction.

Soybean Oil Positioned to Move Higher to 6700 Trend Analysis
The main view of this trade idea is on the 2-Hour Chart. Soybean Oil (SOYUSD) hit some resistance around the 6315 price level and declined towards 5845 where the commodity found support. SOYUSD is rallying to re test 6315 resistance. Expectations are for the commodity to breakout higher and target 6700. Failure of this move would occur if SOYUSD decline towards 5800.
On a Daily Chart there has been a trend change from early September for the commodity to make a leg higher.
Technical Indicators
SOYUSD is trending higher with positive crossovers on the short (50-MA), medium (100-MA) and long (200-MA) fractal moving averages. The commodity is trading above the respective MAs. The RSI is above 50, indicating a bullish price move. This is corroborated by the KST in a positive mode.
Recommendation
The recommendation will be to go long at market, with a stop loss at 5800 and a target of 6700. This produces a risk/reward ratio of 1.66.
Disclaimer
The views expressed are mine and do not represent the views of my employers and business partners. Persons acting on these recommendations are doing so at their own risk. These recommendations are not a solicitation to buy or to sell but are for purely discussion purposes.

Descending Triangle Setup on Wheat, Target at 525Overview
The main view of this trade idea is on the Daily Chart.
The commodity Wheat is in a descending triangle setup, with the resistance trend line at lower highs of 949.08 and 798.34. These lower highs occurred on 10th October 2022 and 30th December 2022 respectively. The support line is observed around the 730 price level. Expectations are for the support at the 730 price level to break and the commodity will decline towards 525. A negation of this view will result in Wheat rallying above 800.
Technical Indicators
Some technical indicators corroborate the chart pattern setup. The Supertrend indicator is in a sell mode and the Awesome Oscillator is below 0 and Red, indicating a downward trend. The RSI for the commodity is also below 50.
The intra-day trend following indicators of Wheat also show downtrends in the 15-Min, 2-Hr, 4-Hr and Daily timeframes. Short term resistance is observed around the 730-770 price range.
The longer-term view also show Wheat in a downtrend. It broke below trend in late June 2022 and has been below trend ever since. Indication of a downtrend has been utilized using the 28-Week Simple Moving Average. A change in the long term trend would occur, at the time of writing, with a weekly close above 805.
Recommendation
The recommendation will be to go short at market, with a stop loss at 800 and a target of 525. This produces a risk/reward ratio of 2.97.
Disclaimer
The views expressed are mine and do not represent the views of my employers and business partners. Persons acting on these recommendations are doing so at their own risk. These recommendations are not a solicitation to buy or to sell but are for purely discussion purposes.
At the time of writing, I have exposure to Wheat.

Wheat Completes Head and Shoulders Pattern, Target at 865Trend Analysis
The main view of this trade idea is on the 15 Min Chart.
There appears to be a completed head and shoulders price pattern on the commodity Wheat. The left shoulder is around the low of 750.38, the head made a low of 750.38 and the right shoulder made a low of 757. The pattern is not at its original designation however appears to be a positive sign nonetheless. The neckline stands at the 779.37 and 779.87 highs. The completion of this pattern takes the commodity towards current price levels at the time of publishing. Expectations are for the trend in the commodity to continue towards 865. A stop loss order has been placed at 766, below Wheat’s neckline.
The Point and Figure Chart corroborates this bullish view. There was a close above the short (30-MA) medium (100-MA) and long (200-MA) moving averages. There has also been positive crossovers on these respective MAs. The Awesome Oscillator (AO) is above 0 and green and the RSI is above 50. The chart indicates that Wheat can rally towards 860.
The Daily chart shows a breakout of 804 resistance. Closing above this level indicates a bullish move for the commodity.
Recommendation
The recommendation will be to go long at market, with a stop loss at 766 and a target of 865. This produces a risk/reward ratio of 1.73.
Disclaimer
The views expressed are mine and do not represent the views of my employers and business partners. Persons acting on these recommendations are doing so at their own risk. These recommendations are not a solicitation to buy or to sell but are for purely discussion purposes. At the time of publishing I have exposure to Wheat.

Descending Triangle in Natural Gas, Downside Target of 4.70Trend Analysis
The main view of this trade idea is on the 15-Min Chart. The commodity Natural Gas is currently in a descending triangle setup with lower highs around the 5.20 and 5.08 price levels and support observed around the 4.95 price level. If the commodity breaks through the 4.95 support it can head towards the 4.70 price level. Failure of this pattern will occur if Natural Gas were to rally above 5.10.
Technical Indicators
The commodity is currently trading below is short (50-MA), medium (100-MA) and long (200-MA) fractal moving averages. There has been negative crossovers on the short and medium as well as the medium and long term moving averages. These moves are bearish indications. To corroborate these signals of upcoming declines are the RSI being below the 50 level as well as a recent negative crossover in the KST.
Recommendation
The recommendation will be to go short at market, with a stop loss at 5.10 and a target of 4.70. This produces a risk/reward ratio of 2.31.
Disclaimer
The views expressed are mine and do not represent the views of my employers and business partners. Persons acting on these recommendations are doing so at their own risk. These recommendations are not a solicitation to buy or to sell but are for purely discussion purposes.

Can One Bean's Rally Reshape Global Markets?The extraordinary trajectory of cocoa in 2024 has rewritten the commodities playbook, outperforming traditional powerhouses like oil and metals with a staggering 175% price surge. This unprecedented rally, culminating in record prices of nearly $13,000 per metric ton, reveals more than just market volatility—it exposes the delicate balance between global supply chains and environmental factors.
West Africa's cocoa belt lies at the heart of this transformation, where Ivory Coast and Ghana face a complex web of challenges. The convergence of adverse weather conditions, particularly the harsh Harmattan winds from the Sahara and widespread bean disease, and the encroachment of illegal gold mining operations, has created a perfect storm that threatens global chocolate production. This situation presents a compelling case study of how localized agricultural challenges can cascade into global market disruptions.
The ripple effects extend beyond just chocolate manufacturers and commodities traders. This market upheaval coincides with similar pressures in other soft commodities, notably coffee, which saw prices reach forty-year highs. These parallel developments suggest a broader pattern of vulnerability in agricultural commodities that could reshape our understanding of market dynamics and risk assessment in commodity trading. As we look toward 2025, the cocoa market stands as a harbinger of how climate volatility and regional production challenges might increasingly influence global commodity markets, forcing investors and industry players to adapt to a new normal in agricultural commodity trading.

Is Sugar the New 'Dr. Copper'? What Mean for the S&P 500?Sugar isn’t just the sweet powder we add to coffee. It’s a global commodity whose price swings reveal surprising truths about the world economy. With sugar prices now hovering near the 17.5–17.7 per pound support level for the sixth time since 2022, it’s time to ask: What story are these numbers telling us?
Sugar’s History: Peaks and Valleys
Sugar has always been a fickle player in commodity markets. Its price has soared above $20 per pound due to droughts or poor harvests, only to crash when supply outstrips demand. But today’s figures are particularly troubling.
Facts:
In recent months, sugar prices have not only approached multi-year lows but remain stagnant.
Low prices signal weak demand. And where there’s no demand, there’s no production growth.
But let’s zoom out: If sugar is losing its appeal, could this be a sign of slowing economic activity? If you think this is speculative, consider real-world data.
“Dr. Copper” vs. “Dr. Sugar”
We all know copper is the economy’s barometer, correlating with industrial production, construction, and tech innovation. But why isn’t sugar part of the conversation? 🍬
Why Sugar Matters:
The Confectionery Industry: Sugar is a cornerstone of baked goods, candies, and everyday staples. A drop in consumption could reflect shrinking consumer purchasing power.
Global Ubiquity: Unlike copper, sugar is used everywhere—from developing economies to wealthy nations. Its demand mirrors economic sentiment and living standards.
The U.S. Economic Outlook: Alarming Signals
Recent U.S. economic indicators paint a grim picture:
Rising Unemployment: The U.S. unemployment rate hit 4.1% in Feb 2025 (up from 3.9% a year prior), signaling job losses in key sectors.
Slowing GDP Growth: expanded by 2.8% in 2024, little-changed from the 2.9% growth recorded in the previous year- below analysts’ expectations.
Inflation “Cooling”: While inflation dipped to 2.4% in March, falling commodity prices (like sugar) may hint at deflationary pressures.
What “Dr. Sugar” Reveals
Connecting the dots—low sugar prices, slowing production, rising unemployment, and weak GDP growth—paints a clear picture: The U.S. (and global) economy is at a crossroads.
Key Takeaways:
Falling sugar prices may signal early-stage declines in consumer demand.
Deflationary trends could threaten the S&P 500 as companies face shrinking revenues and margins.
Given current data, the risk of a recession within months remains high.
How to Use Sugar as an Economic Indicator
To track economic health:
Monitor Exchange Prices: Sudden sugar price drops may foreshadow economic slowdowns.
Compare with Other Staples: Track correlations with wheat, corn, and other food commodities to gauge consumer behavior shifts.
Watch Producers: Food industry giants often react first to demand changes. Study their earnings reports.
Conclusion: A Sweet Indicator of Bitter Times?
Sugar is more than a raw material—it’s a mirror reflecting economic sentiment. Today, with prices near historic lows and U.S. economic data flashing warning signs, we must ask: Are we ready for a potential recession?
I believe “Dr. Sugar” deserves more attention. What’s your take? Join the discussion and share your thoughts! 💬

Where are commodities heading to? Beyond 2022Where are the meat or commodity prices heading?
Meat prices have been rising at a rate of about 3% per annual over the last 40 years.
Meat is what I classified as an edible commodity, so is corn, wheat and rice. And as these commodities start picking up in prices, they are the one that will give the central banks a huge headache and to consider to hike its interest rates than the other commodities in the CPI basket.
Why is this so?
In short, people can still live with some inconvenience without cars or petrol, but not without food. Therefore, there is an urgency for the policy makers to first take care of the basic needs of the people.
Content:
. Long-term direction of Live Cattle
. Trading ideas
. Investing ideas
Disclaimer:
• What presented here is not a recommendation, please consult your licensed broker.
• Our mission is to create lateral thinking skills for every investor and trader, knowing when to take a calculated risk with market uncertainty and a bolder risk when opportunity arises.
A little hack here to project the coming CPI data and also to know how aggressive the Fed will be with interest rate hike - you may consider to track the development of these edible commodity prices, if it is still trending up, we should be expecting a higher CPI and interest rates.
Example on Live Cattle Futures:
0.025cts = US$10
0.10cts = US$40
145.00 = 1450 x US$40 = US$58,000
From 144 to 145 = US$400

XAG USD clear path to 26+Hello traders & analysts,
Here is out latest update for Silver . We are bullish and would like to share our out look for the next opportunities which can take place.
Now we have hit 21.00 - expect some resistance to occur - why? This is due to the barrier to be broken through.
We will now anticipate the next target of 26.00
at 20.5 we closed 200 units to cash in 450pips - great partial take!
COT data:
Long Short Total %Long %Short
Avg_13 62,368 28,887 91,255 69% 31%
Avg_20 61,214 26,449 87,663 70% 30%
Avg 50 83,059 35,629 118,688 70% 30%
Avg_130 84,123 36,227 120,349 70% 30%
Technically what has happened?
Price was severely undervalued and silver is an important commodity to use for manufacturing sectors.
Commodity currencies rely on this as an export factor e.g. CAD, AUD, MXN, ZAR , RUB, NZD.
We had a great wedge pattern where we entered on a nice engulfing daily candle which broke to the upside.
Price has hit a nice supply zone at 18.3-18.9 zone.
The price in this area can reject and retrace which is an option we are looking for; however keep in mind the bullish structure, price has alot of upside potential.
If price rejects, we will look for a nice clean break from the zone and hedge.
Fundamentals:
Coronavirus re-opening of industries and subsequent purchase power of retailers.
Fear commodity but less attractive than Gold and platinum.
Cheap metal but gains are very high and attractive
China vs USA trade war
Australia vs China mini trade war.
Mexico has large coronavirus numbers but largest producer of silver .
Why follow us?
Updates on our pairs as and when we can.
Swing trade out looks
10 years combined experience in capital markets
simple breakdowns for beginners to advanced .
KISS - keep it simple stupid.
we trade purely from naked charts, less indicators - remove the noise.
If you like our work, please leave a like or comment. To all our followers, we appreciate the follow and likes.
Thanks,
Team Lupa

XAG USD update [longterm long, short term] retraceHello traders & analysts,
Here is out latest unprivate idea for Silver . We are bullish and would like to share our out look for the next opportunities which can take place.
COT data:
71,859 long (67.92% ) 33,936 - short (32.08)
Technically what has happened?
Price was severely undervalued and silver is an important commodity to use for manufacturing sectors.
Commodity currencies rely on this as an export factor e.g. CAD, AUD, MXN, ZAR, RUB, NZD.
We had a great wedge pattern where we entered on a nice engulfing daily candle which broke to the upside.
Price has hit a nice supply zone at 18.3-18.9 zone.
The price in this area can reject and retrace which is an option we are looking for; however keep in mind the bullish structure, price has alot of upside potential.
If price rejects, we will look for a nice clean break from the zone and hedge.
Fundamentals:
Coronavirus re-opening of industries and subsequent purchase power of retailers.
Fear commodity but less attractive than Gold and platinum.
Cheap metal but gains are very high and attractive
China vs USA trade war
Australia vs China mini trade war.
Mexico has large coronavirus numbers but largest producer of silver.
Why follow us?
Updates on our pairs as and when we can.
Swing trade out looks
10 years combined experience in capital markets
simple breakdowns for beginners to advanced .
KISS - keep it simple stupid.
we trade purely from naked charts, less indicators - remove the noise.
If you like our work, please leave a like or comment. To all our followers, we appreciate the follow and likes.
Thanks,
Team Lupa
