Light Crude short trade update - stay in positionI posted a crude oil set-up as one of my first few posts on tradingview as when in the low-$70s Crude was showing significant bearish RSI divergence and was clearly topping out a primary (or whatever scale) wave 3 up and would be correcting to create wave 4 with an ABC.
At that time I didn't post using the Nymex light crude CL1! chart (despite my own analysis having been done on the Nymex chart - my own paper trade (unpublished) shorted crude at $74.17 on the 4th of July). The wave formation on this commodity and the previous one I posted are quite different.
At this stage I believe we are only half-way through a zig-zag correction. What we know:
- There has been a 5-wave correction,
- This correction was followed by a smaller abc correction,
- All 3 abc waves seem to be present,
- If it was wave c - it has the required 5 waves of a wave c,
- Following the abc correction the price has already exceeded the wave (v) / (A) extreme - pointing to further correction needed,
- This appears to be followed by the formation of wave i and ii down.
These together seem to suggest that we have started wave 3 (iii) in a 5 wave wave (C) move downwards. The green box denotes where I would close this short (bear in ind that wave 5 of 5 tends to be extended in commodities) as a conservative estimate based on a 1:1 extension of wave (A) (extended from both the wave b and c extreme to get a range) as well as the 1.618 extension of wave i down. I will seek out a platform on which to trade this commodity due to this set-up. Because I am a little late, I would enter on a break below wave i ($66.92 low) down to catch wave iii, iv, and v down).
While I use different wave degrees I use them mostly to just denote smaller, larger scales, and sub-waves. I am not trying to be accurate with my wave degrees. This is 100% technical analysis and 0% fundamental anaysis.
Search in ideas for "COMMODITY"

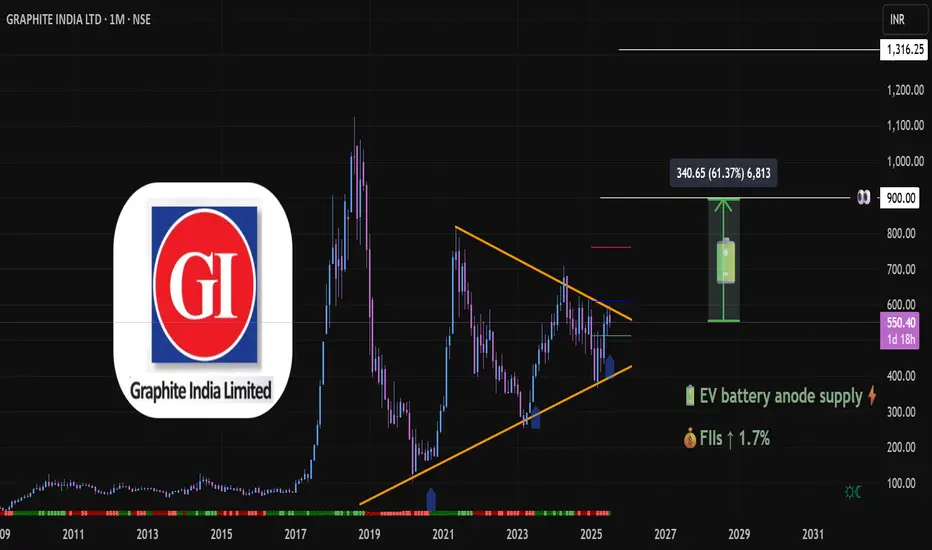
Graphite India (1M TF) - Big Technical Base ►NSE:GRAPHITE
⚙️ Materials: Commodity Cycle Turnaround
(Green energy metals, China recovery)
Sector context: India’s rising graphite demand (e.g. electrode expansion for steel, battery material on horizon) aligns well with Graphite India’s positioning.
►Graphite India is the largest producer of graphite electrodes in the country and one of the largest in the world.
At the time of charting NSE:GRAPHITE PA was at 550
PA in 1D TF has bounced from Support
Trend 1M TF: Long-term Symmetrical 📐triangle formation since 2018 highs — price now testing upper trendline
Monthly shows range‑bound to mild consolidation since topping near ₹623 and bouncing around ₹540‑560.
Multi-year consolidation forming a textbook volatility squeeze, often a precursor to explosive directional moves. Volume compression inside the triangle suggests strong hands accumulating.
Candlestick structure: Bullish engulfing-type recovery candle forming off the trendline support. Breakout Energy above 586 = potential energy. A monthly close👀 above the downtrend line may unlock significant upside ⇗ momentum.
Daily MACD turning positive, weekly and monthly crossovers 🟢suggest building momentum.
Monthly Resistance line 762🔴 Pivot line 🔵611 Support🟢512
₹575–586 is the breakout threshold. Above the pivot and away ⇗
Post-break, next projection target : ₹900 (≈+60%), followed by ₹1,300. (Text Book)
📊 Fundamental Alignment
🔋 EV Battery Anode Narrative: Global lithium/graphite demand surging → Graphite India well-positioned as key electrode supplier.
🌍 China Supply Risks = India graphite players gain global relevance.
💼 FIIs Inflow: Recent uptick (+1.7%) hints at sectoral re-rating in anticipation of capex cycles and commodity upturn.
📉 Valuation Context: After steep de-rating post-2018, current price offers favorable risk-reward compared to earnings expectations and sector re-alignment.
► Graphite electrodes are the main heating element used in an electric arc furnace
extremely high levels of heat generated in EAF.
Graphite electrodes are divided into 4 Types: RP Graphite electrodes, HP Graphite electrodes, SHP Graphite electrodes, UHP Graphite electrodes.
► Needle coke👀 is a key ingredient in the production of graphite electrodes for electric arc furnaces (EAFs) in the steel industry.
🧰 Strategic Outlook
►we'll follow this trade closely and within incoming week we'll up a close up view of 4h TF
Bias: Strongly Bullish on breakout; Neutral if it stalls below ₹550.
Targets: ₹900 (swing), ₹1,300 (positional)
ideal for swing/long-term portfolio adds
Alternate Case: Breakdown below🔻₹480 negates pattern; re-evaluate around ₹400 for demand re-entry.
Always DYOR
See you on the other side
💡 Reflective Close:
“What if true breakouts don’t come from hype — but from time, patience, and the quiet work of smart money preparing long before headlines catch up? Are you watching the price, or are you watching the behavior behind the price?”
"USOIL is going downward"The weakening labor market has reduced risk appetite in the markets, triggering a drop in crude oil prices toward the 67.50 level. Additionally, OPEC+'s crude oil production in August decreased by 300,000 barrels due to declines in Libya and Kazakhstan. However, ongoing supply concerns continue to pressure the commodity.
Technically, if the 67.50 support level is broken, further declines toward 65.55 and 63.55 are possible. On the upside, if the 70.0 resistance is surpassed, buying momentum could accelerate toward the 72.60 and 74.50 resistance levels.

Quick Market Updates: (Forex, Crypto, Commodity)
Hi everyone,
had some time in the morning to scan through the charts for this last week of 2021.
Although I personally wont be actively trading or entering any positions,
there are some opportunities that are potentially shaping up. Will share some screenshots of what I am looking at below.
I did see in my group discussion chat room from last week that some people were in some trades before Christmas Eve and the weekend,
and are wondering why the spreads are high.
I been saying this for a few weeks prior to it happened and no exception to this last week on Thursday and Friday (New Years Eve/New Year) will be the same.
So be careful and understand the low liquidity and low volume is the cause of the big spreads. So watch out your live positions if you are in any.
Forex: Pairs such as AUD and NZD I mentioned in the last quick market video that I am fairly neutral and want to see more development.
As we can see at current price, the LTFs are showing us some bullish potential. If they can continue the bullish move then it can void the bearish bias and outlook.
AUDUSD -
NZDUSD -
USDCAD -
AUDJPY -
NZDJPY -
Commodity: Oil played out nicely from the previous outlook, looks like they can continue the upside.
CORN:
UKOIL:
USOIL:
Crypto: Many pairs are pushing up, potentially in some bullish move. I talked about 3 from the last quick market update video, and seems like more and more are playing to the upside now.
TOTAL -
ADA -
BTC -
DOT -
SOL -
Indices: Most are approaching ATHs, so I will just be observing what the market will do next few days. Again due to holiday and low liquidity, best to stay out until clear development.

Are You Positioned for Quad 2? I hope you're readyWe're already in the midst of record runs in the equity and commodity markets but as bubbly as it seems, its not over.
We are in an environment that not many people are familiar with. The last time Growth and Inflation on a global scale were accelerating as fast as they are now was immediately after World War 2. Previous commodity cycles were sparked by 1 or 2 catalysts. The current macro setup has nearly the most accommodative and bullish catalysts for global growth and inflation that we could imagine. Fed on autopilot, Fiscal out the wazoo, supply chain disruptions and shortages everywhere, all major political interests want a weaker dollar.
Given that is the case and YoY GDP will probably show about +10% and CPI +3% in the 2nd Quarter, there's a good chance this current run, especially for commodities, could continue for a couple more months before a major correction.
Things I have been and remain bullish on: Potash, Sugar, Wheat, Soybeans, Corn, Cocoa, Coffee, Orange Juice, Copper, Uranium, Crude Oil, Natural Gas.
I've added to my exposure recently Aluminum, Nickel, and Coal.

Time to sell OILThe price is about to reach a key area of resistance to determine the trend in the very short term: between 58.80 and 59.70 a barrier has formed which is a watershed between a further climb of another 6 dollars towards the area between the $ 62/64 per barrel, or a retracement to the support at $ 52.20. The fundamental scenario that is taking shape is quite clear: according to analysts, the US is producing more oil than market demand, which remains constant (if not actually falling in certain periods). This situation is pushing investors to remain cautious with long positions on this commodity: despite the rise of the latter sessions, it is likely that the second hypothesis, (of a retracement ), is the most probable in the short term.
On the other hand, the brent is supported by a stable production cut by the OPEC countries and by production interruptions in Iran and Venezuela, maintaining a sort of balance between demand and supply . We recommend a short market entry on WTI, despite the price is close to an important pivot, anticipating the market.

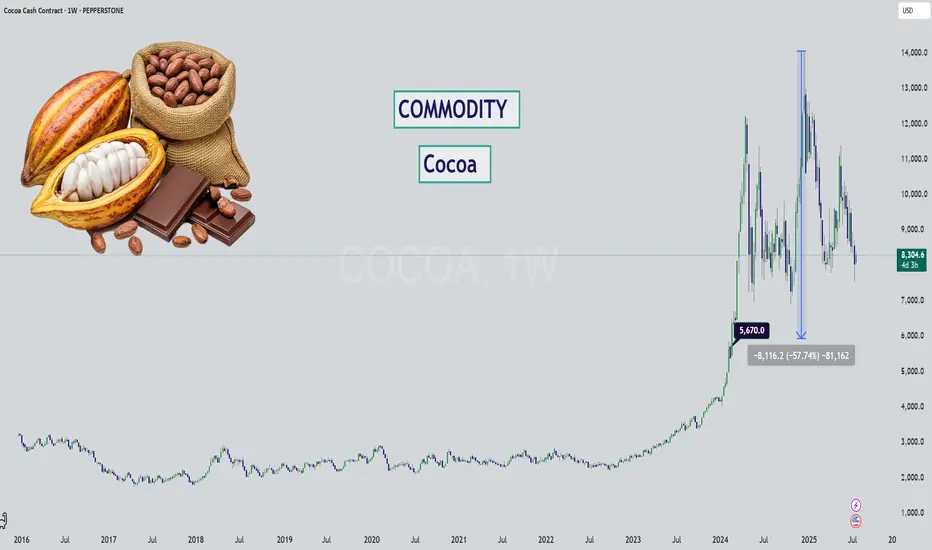
Cocoa - Chocolate is DIPPING (literally)Hello Market Watchers 👀
I bring today an update on your favorite commodity (mine actually)... 🍫
The weekly timeframe from a multi-year perspective is what's on the cover and one thing is clear - cocoa has never increased so much as it during May23' to Dec24'.
Sure inflation brought on by covid has a role to play. But even so, factoring in the amount of +509%? That is way out.
We could likely see this kind of stair step down movement on cocoa, since it has been following the logic of: " previous support = new resistance ".
Either way what this tells me is that cocoa has been running overly hot for too long... and it's time for a cooldown. Prices will likely never return to pre-covid levels, unless there is unfortunate weather or other supply chain issues.
Ultimately, a return back to the $5,600 zone would be a reasonable market correction for such a large increase.
1 Week Later and Oil is down 3.66%1 Week after the beggining of conflict between Israel and Iran in the middle east, Crude Oil is down 3.66%. Price began trending down all week and then on Thursday there was news of a bombing by Israel which caused a spike in Oil(3.5). This whole move was corrected and we are back to being down on the week. This opposes what I believed may play out this week as my thoughts were 1. Oil is a precious commodity and needed in War 2. The trend thus far this year is Bullish (we are up 13.82%) The market is instead going down and retraced this week. We are currently sitting on the Daily support level 81.23. Price action looks bearish on the Daily as we have a large top wick on the current candle.. moving into the next few weeks we will have a bearish weekly candle behind us that may aid in a descent towards the next Daily level 80.65 and beyond to the next weekly level 77.82. Also, this is in line with current risk-off market sentiment as Oil (Risk-on) is a commodity after all
Daily timeframe : The Daily timeframe retested Daily resistance (85.65) and we rejected.

The one and only commodity I am selling in May 2023!We’re looking at the weekly chart.
We can see palladium’s price has fallen since 2021 from $3,000 down to today at $1,424.
Then in 2022, palladium shot up to above $3,400, this has formed what’s known as a Descending Triangle.
This is where the price makes lower highs and bounces on the same floor level.
Now that the price has broken below the triangle, this tells me the sellers are winning and will continue to dominate the market.
This will bring down the price further. I expect the palladium’s price to drop to the 200MA (black line) and then further down to $880.
If this happens, this downside for the precious metal will ONLY be the beginning.
Considering all these factors, we need to brace for palladium’s next crash and at least try and profit from the fall.
FUNDAMENTALS:
Why Palladium’s demand is dropping
Experts from Norilsk Nickel, a major mining company, predict there could be only a small shortfall of 100,000 ounces.
This is less than what they thought in February when they expected a shortfall of 300,000 ounces.
This is mainly because the car industry is not recovering as quickly as they thought, so demand has not increased as expected.
Chip supply and the war in Ukraine have further slowed the car industries recovery.
And South African palladium producers have also contributed to this slowing as they have lowered their production goals and reduced their refining activities, largely due to loadshedding.
And this isn’t good for palladium and its price.
But as always I look to the charts for the overarching signal and this is what it’s telling me.

Correlation – Crude Oil & CPIStudies indicated Crude Oil is the best indicator to track the current inflation.
It is also a leading indicator to inflation numbers? If that is true, we will have to track the crude oil prices very closely.
Content:
i. The most inline commodity with CPI
ii. Can the Crude Oil track CPI?
iii. Direction of Crude Oil
Crude Oil Futures
Minimum fluctuation
0.01 = $10
0.10 = $100
1.00 = $1,000
10.00 = $10,000
Disclaimer:
• What presented here is not a recommendation, please consult your licensed broker.
• Our mission is to create lateral thinking skills for every investor and trader, knowing when to take a calculated risk with market uncertainty and a bolder risk when opportunity arises.
CME Real-time Market Data help identify trading set-ups in real-time and express my market views. If you have futures in your trading portfolio, you can check out on CME Group data plans available that suit your trading needs www.tradingview.com

Iron ore hits record-low as demand drops By the end of 2022, the price of iron ore is expected to hit their lowest level in three or four years as global demand for the commodity continues to slow down, particularly from China, the world's largest consumer of iron ore.
In recent years, China has been cutting down its iron ore demand especially after the government placed restrictions on the industry to reduce carbon emissions. In 2021, the country's iron ore import fell to 1.12 billion tons from 1.17 billion tons in the prior-year period.
Expectations for 2022 from the production side are no better with Australia, the world's biggest exporter of iron ore, projecting a 0.6% drop in global steel output to 1.947 billion tons.
"Combined with growing global recessionary fears, new COVID-19 outbreaks and weakness in China's housing sector have dampened world steel and iron ore demand in recent months," the Australian government said in its October quarterly report.
A Reuters survey in October showed that prices are expected within the $90/ton to $115/ton range by the end of the year. MetalMiner data shows the price in early 2022 were at $160.30/ton at the beginning of Russia's war against Ukraine.
The decline comes despite forecasts of growth in the demand for iron ore through to 2026. The global market for iron ore is estimated to reach 2.7 billion metric tons, while production is expected to reach 3.17 billion metric tons.
Until definite signs of recovery are observed, maybe it is best to err on the side of caution regarding iron ore prices, especially considering the threats of a recession in Europe and the persisting problems in China's property sector, which could heavily impact on the demand for the key steelmaking ingredient.

Potential Break in Brent Crude Oil Towards 74.25Trend Analysis
The main view of this trade idea is on the 15-Min Chart. The consolidation in Brent Crude Oil over the last couple of days has produced 2 chart pattern setups, a Rectangle as well as a Reverse Head and Shoulders. Resistance for the Rectangle is around the 72.50 price level while support is seen at the 70.85 price level, which is also the Head of the Head and Shoulders pattern. The Left and Right Shoulders are around the 71.35 price level while the Neckline is around the 72.30 resistance. The completion of these chart patterns will take the commodity between 73.65 and 74.25.
Technical Indicators
Brent Crude Oil is trending higher as it is currently above its short (25-MA), medium (75-MA) and long (200-MA) fractal moving averages. Also the short MA is above both the medium and long term MA and the medium term MA is above the long term MA. This denotes an uptrend over the respective timeframe. The RSI is above 50 and there has been a positive crossover on the KST.
Recommendation
The recommendation will be to go long at market. Stop loss will be set around the 70.80 price level and a target of 74.25. This produces a risk-reward ratio of 1.12.
Disclaimer
The views expressed are mine and do not represent the views of my employers and business partners. Persons acting on these recommendations are doing so at their own risk. These recommendations are not a solicitation to buy or to sell but are for purely discussion purposes. At the time publishing, I have a position in Brent Crude Oil.

Broadening Pattern in Soybean Futures with a Target of 1440Trend Analysis
The main view of this trade idea is on the 2-Hour Chart. Soybean Futures is experiencing a broadening pattern in the respective timeframe. This pattern comes with increased volatility as the trendlines are expanding outward. It is projected that the commodity will rally towards 1440, around the sighting of a gap lower. An indicative stop loss is set at around 1325, a little below the support trend line.
Technical Indicators
There has been a bullish crossover on the short (25-MA) and medium (75-MA) fractal moving averages. Soybean futures are also above the respective MAs. The RSI is above the 50 level with the KST having a positive Crossover. These are all bullish indicators for the commodity.
Recommendation
The recommendation will be to go long at market. Stop loss will be set around the 1325 price level and a target of 1440. This produces a risk-reward ratio of 2.46.
Disclaimer
The views expressed are mine and do not represent the views of my employers and business partners. Persons acting on these recommendations are doing so at their own risk. These recommendations are not a solicitation to buy or to sell but are for purely discussion purposes. At the time publishing, I have a position in Soybean futures.

Natural Gas Heading Towards 3.20Disclaimer
The views expressed are mine and do not represent the views of my employers and business partners. Persons acting on these recommendations are doing so at their own risk. These recommendations are not a solicitation to buy or to sell but are for purely discussion purposes. At the time publishing, I have a position in Natural Gas.
Trend Analysis
The main view of this trade idea is on the 2-Hour chart. Natural Gas has been in a rangebound or rectangular trading pattern since the end of June and is currently making another move lower towards 3.50 support. The key move will be a breakdown from support which will take the commodity towards 3.20.
Technical Indicators
Natural Gas is currently below its short (25-SMA), medium (75-SMA) and fractal moving averages and its RSI is trading below 50, heading towards oversold levels. Moreover, the KST is in a bearish move .
Recommendation
The recommendation will be to go short at market. At the time of publishing Natural Gas is trading around 3.61. The medium-term target price is observed around the 3.2 price level. A stop loss is set at 3.85. This produces a risk reward ratio of 1.77.

LEV2020-LEZ2020: Spread on Live CattleLEV2020-LEZ2020
Commodity Spread Trading is an advanced way to profit statistically from the differences that occur in the commodity futures market based on Contango or Backwardation situations.
These statistics are offered by online software and allow for amazing performance.
So far we have achieved the highest gains in relation to drawdowns with this way of trading,
Here we enter Short on the Live Cattle Spread buying the October Futures and selling the December Futures.
Happy Trading to All!

My Sentiments on XAU/USDThe Commodity has broken the 1494 - 1484 S/R zone, A highly volatile economic week being the main factor driving the commodity down and could continue down significantly..
Technical analysis :
1. Pin Bar formed on the D chart (25/10/19) signaling market rejection of the 1517 - 1513 price range, previous rejections making it a strong resistance zone
2. Price retraced to the 1517 - 1513 zone providing a good entry zone down.
Current price is at a strong support zone and were anticipating a pull back up to the 1493 - 1473 zone
This is a possible short buy opportunity as we look for the bear trend to continue.

GOLD ForecastGold has done well closing at the key support level, however there is some strong resistance ahead which it needs to take out
clean for a long bullish signal. I am long on Gold since 1260 due to its technical pattern and commodity itself. It has been very much under pressure the last couple of years but has done well in 2017. 2018 looks bullish for gold if it takes out the strong resistance levels of 1348/1375 than we can clearly see 1425/1472 Insight. Gold has been creeping up for the last couple of months due to increasing risk factors of US economy as well as global stock market. Crypto and Gold can have a long bullish
run side by side in the coming years once the Stock market is set for a major correction. I would recommend buying gold as a hedge against stock and Crypto market volatility. As long as gold stays above 1290/1300 We can expect a bullish sign for this commodity.

CC1! @ daily @ worst Commodity (-33%) 2016, closed yearly lowTake care
& analyzed it again
- it`s always your decision ...
(for a bigger picture zoom the chart)
This is only a trading capability - no recommendation !!!
Buying/Selling or even only watching is always your own responsibility ...
44 COMMODITIES (2016 Yearly Performance) from Chicago, New York & London @ drive.google.com
Best regards
Aaron

Why the Sudden Surge in Soybean Oil Prices?Recent sharp increases in Chicago soybean oil prices reflect a confluence of dynamic global and domestic factors. Geopolitical tensions, particularly those impacting crude oil markets, have played a significant role, as evidenced by the recent surge in Brent crude futures following events in the Middle East. This volatility in the broader energy complex directly influences the cost and strategic value of alternative fuels, positioning soybean oil at the forefront of this market shift.
A primary driver of this ascent is the transformative policy initiatives from the U.S. Environmental Protection Agency (EPA). The EPA's proposed Renewable Fuel Standard (RFS) volume requirements for 2026 and 2027 represent an aggressive push towards increased domestic biofuel production. These mandates, significantly exceeding previous targets, aim to bolster U.S. energy security and provide substantial support for American agriculture by boosting demand for soybeans and their derivatives. Key changes, such as the transition to RIN equivalents and reduced RIN costs for imports, are designed to further incentivize domestic consumption and reshape market dynamics.
This policy-driven demand fundamentally reorients the U.S. soybean oil market, causing Chicago Board of Trade futures to increasingly reflect internal American forces rather than global trends. This necessitates a shift in focus for traders towards physical market prices in other regions for international insights. The market has reacted swiftly, with notable increases in futures prices, a surge in open interest, and record trading volumes, indicating strong investor confidence in soybean oil's role within this evolving landscape. Concurrently, the new mandates exert pressure on imported biofuel feedstocks, further solidifying the emphasis on domestic supply.
Ultimately, the rise of soybean oil prices signifies more than just market speculation; it marks a pivotal transformation. It positions soybean oil as an essential commodity within the U.S.'s energy independence strategy, where robust domestic demand, shaped by forward-looking policy, becomes the prevailing force. This transition underscores how intertwined agricultural markets now are with national energy objectives and global geopolitical stability.

Can Rice Solve Global Challenges?Rice, a staple that feeds half the world's population, is navigating through an era marked by market turbulence, international rivalries, and groundbreaking innovation. In Japan, an unprecedented governmental intervention has been enacted to stabilize soaring rice prices, showcasing the delicate balance between supply, demand, and consumer welfare. By releasing nearly 210,000 tonnes of rice reserves, Japan aims to quell the price surge exacerbated by climatic extremes and supply chain disruptions, reflecting a broader narrative on how nations can manage food security in the face of environmental challenges.
Meanwhile, the global rice landscape is being reshaped by geopolitical maneuvers, particularly in the contest over Basmati rice. Pakistan's recent diplomatic victories in securing recognition for its Basmati in key markets underline the economic and cultural significance of rice varieties, challenging us to reconsider how heritage, origin, and trade laws intertwine in modern commerce. This development affects market shares and prompts a reflection on the importance of intellectual property in agriculture.
On the technological frontier, Chinese scientists are redefining rice's nutritional profile through gene editing, introducing Coenzyme Q10 into this traditional grain. This leap forward in biofortification could revolutionize plant-based diets, offering a sustainable solution to nutritional deficiencies. It invites us to ponder how far science can go in enhancing our food's health benefits while maintaining its cultural essence.
Finally, Vietnam's volatile export market dynamics serve as a reminder of the commodity's cyclical nature. With prices falling from their peak, the industry's resilience is tested, pushing for strategic adjustments in market expansion and financial resilience. This scenario challenges stakeholders to innovate in market strategies and support systems, ensuring that rice continues to be a stable, accessible food source worldwide. Together, these narratives paint a picture of rice not just as a simple grain but as a complex player in global economics, politics, and science.

ALROSA PJSC $ALRS: CAN IT WEATHER THE STORM?💎 ALROSA PJSC (ALRS.ME): CAN IT WEATHER THE STORM?
Russia’s diamond giant, Alrosa, is under pressure from global sanctions and weak demand. Can this dominant player maintain its shine ✨ or will it get buried under geopolitical and market risks? Let's dig in! 👇
1/ Revenue Hits:
Alrosa's diamond sales halted in Sept-Oct 2024, reflecting a tough market.
This move was part of a strategic response to sluggish demand 📉 and efforts to stabilize earnings.
The diamond industry isn't sparkling like it used to. 💎
2/ Market Stabilization Efforts: 🛑
No recent earnings reports were mentioned, but the sales halt highlights how volatile the market has become.
Alrosa is bracing for financial pressure while keeping reserves intact for better conditions.
Is this a smart move, or just delaying the pain? 🤔
3/ Major Threat: G7 Sanctions ⚠️
The G7 plans to ban Russian diamond imports, a major blow to Alrosa's access to key markets.
Sanctions could severely disrupt revenue and global sales channels. 🌍
This geopolitical chess match might redefine the company's future moves. ♟️
4/ How's Alrosa Valued? 💲
The last known analysis suggested a 25% undervaluation (based on a DCF model in 2019).
However, without updated data, it's unclear if this still holds true under current conditions.
Alrosa's financial outlook hinges on lifting or navigating around sanctions.
5/ Comparing Alrosa to Peers:
Alrosa’s dominance in diamonds is clear, but sector-wide data remains limited.
Compared to precious metals miners, Alrosa’s reliance on one commodity increases its risk exposure.
Diversifying might be crucial for long-term resilience. 🏗️
6/ Key Risks to Watch: 🚨
Geopolitical Tensions:
Sanctions are the biggest risk threatening Alrosa's market access.
Market Demand Slump:
Global demand for natural diamonds is weakening as lab-grown diamonds gain popularity. 🧪
Regulatory Risks:
Changes to mining laws in Russia could further complicate operations.
Currency Volatility:
The ruble's instability 💱 may distort reported earnings and profitability.
7/ SWOT Analysis: 🔍
Strengths:
✅ Global leader with significant diamond reserves
✅ State-backed, offering some political protection
Weaknesses:
⚠️ Heavy reliance on a struggling market
⚠️ Susceptible to international sanctions
8/ SWOT Continued:
Opportunities:
🚀 Recovery potential in the diamond market post-sanctions
🚀 Diversification into other minerals or industries
Threats:
🌍 Sanction risks from Western nations
🌍 Rising competition from lab-grown diamonds
Alrosa will need bold strategies to capitalize on any opportunities ahead.
9/ Investment Thesis: 💡
Alrosa’s future remains uncertain due to sanctions and weak market conditions. However, significant reserves and state support could provide resilience if market demand recovers. Investors must weigh the high geopolitical risk against potential recovery gains.
10/ What do YOU think? 💬
📈 Bullish: Alrosa can weather this storm.
🔄 Hold: Let’s see how sanctions evolve.
🚫 Bearish: Too risky, no recovery in sight.

1st wave upwards?Analyzing the NYMEX:CL1! (Crude Oil Futures) chart, the current level may serve as a potential reversal point due to several factors:
Higher High Formation: On November 7th, the price established a higher high. If the current candle forms a higher low, it could signal the continuation of an upward trend.
Bullish SMA Crossover: A few days ago, the 30-day Simple Moving Average (SMA) crossed above the 50-day SMA, indicating a bullish momentum shift.
Seasonality and Macroeconomic Factors: Historically, crude oil exhibits bullish seasonality starting in the second half of December. Additionally, global instability and the Federal Reserve's recent interest rate cuts may contribute to higher commodity prices.
These elements suggest a favorable outlook for crude oil prices in the near term.

Can We Unravel the Mysteries of Wheat Market Stability?In an era of interconnectedness and unprecedented challenges, the global wheat market stands as a critical linchpin of food security. Its intricate interplay of supply, demand, and geopolitical factors has profound implications for the world's ability to feed itself.
The wheat market, a cornerstone of global agriculture, is subject to numerous forces that can disrupt its equilibrium. Climate change, with its increasing frequency of extreme weather events, poses a significant threat to wheat production. Droughts, floods, and heatwaves can devastate crops, leading to shortages and price volatility. Additionally, the geopolitical landscape is fraught with tensions that can impact wheat trade. Conflicts, sanctions, and trade disputes can disrupt supply chains, limiting access to essential food commodities.
Moreover, the growing global population, coupled with changing dietary habits, is placing increasing pressure on wheat production. As incomes rise, consumers are demanding more diverse and protein-rich diets, which can drive up demand for wheat-based products. This increased demand, combined with the challenges posed by climate change and geopolitical instability, creates a perfect storm of uncertainty for the wheat market.
The future of wheat, and by extension, the global food system, hangs in the balance. Can we unravel the enigma of wheat market stability, or will the challenges posed by this vital commodity prove insurmountable? The answer to this question will determine the extent to which we can ensure food security for generations to come.
