One year dynamic resistance is powdered One year dynamic resistance has been powdered
One year dynamic resistance has been powdered
One year dynamic resistance has been powdered
Look at the chart :)
Search in ideas for "Dynamic"

Auction Dynamics Augurs Well for Long 2Y Short 5Y SpreadIn US Treasury Auctions, the Bid to Cover ratio signals the strength of an auction. A higher ratio implies greater demand. As rate cut expectations and economic outlook evolves, so do the spreads across different maturities.
This paper provides US economic overview, resultant rate outlook, and divergence in auction demand across different maturities.
Contrasting spreads across maturities, the paper posits a hypothetical trade comprising of long 2Y and short 5Y spread. The spread benefits from continued yield curve inversion and from higher demand for 5Y treasuries.
Previously we highlighted a rebound in US treasury yields as market expectations of rate cuts were tempered. Rebound in CPI and jobs data pushed expectations further out.
Back in December 2023, FedWatch signalled up to six rate cuts of 25 basis points (bps) each. Cuts were anticipated to start in January 2024. Since then, two FOMC meetings have passed with rates unchanged. The CME FedWatch now signals just three cuts (of 25 bps each) starting in June 2024.
Source: CME FedWatch
Market expectations have shifted drastically even as Fed outlook remains unchanged. Fed’s dot plot from March FOMC meeting below shows that it anticipates three cuts this year. This is unchanged from the December dot plot.
Source: FOMC Projection Table
Shift in rate cut expectations resulted in treasury yields rebound. Since reaching its lowest in mid-Jan, 2Y yields have shot up by 42 basis points (nearly 10%) during Jan and early-Feb. Since then, 2Y yields have fluctuated but remain largely flat.
During this period, economic data has come in hotter than expected. CPI in Jan and Feb was above expectations. Non-Farm Payrolls (NFP) were substantially higher than expectations. Yields have ended up higher following the last two NFP and CPI prints.
GDP estimate in Jan was slower but following revisions, the release on 28/March showed GDP is also growing faster than expectations. PCE price index has come in close to expectations.
Against that backdrop, the two FOMC meetings thus far have resulted in (1) No hike & No guidance, and (2) No hike & Reaffirm guidance.
CONTRASTING AUCTION PERFORMANCE ACROSS MATURITIES
Demand for 10-Year Treasury Slowing : Auction for 10Y maturity was exceptional in February 2024. It was slower in March 2024. On 7/Feb, the US 10Y auction fetched a record USD 45 billion with a bid-to-cover ratio of 2.56.
The 12/March auction showed slowdown in demand. It fetched USD 39 billion with a lower bid-to-cover ratio of 2.51.
Bid-to-Cover ratio is the dollar amount of bids in a Treasury auction relative to the amount sold. The bid-to-cover ratio is an indicator of Treasury demand. High ratio indicates strong demand.
Robust Demand for 30-Year Treasury : Auction for the 30Y Treasury drew USD 27 billion during 8/Feb auctions. The March auction was lower at USD 22 billion but the Bid-to-Cover for 30Y treasuries was higher (2.47 in March vs 2.40 in Feb) indicating strong demand.
Demand for medium term treasuries (5Y and 2Y) is strongest : Demand for medium-term securities remains strongest. Last week, the 5Y Auction fetched a record USD 67 billion. 2Y notes fetched USD 66 billion (higher than any auction over the past year) while the 5Y notes fetched USD 67 billion.
Source: CME TreasuryWatch
Demand for medium-dated treasuries relative to the 10Y notes is visible in the bid-to-cover ratio. The ratio for 5Y and 7Y notes has risen since 22/Jan, while those for 10Y ones have softened.
Source: CME TreasuryWatch
Demand for medium term (1Y to 5Y) treasuries remains strong despite Fed offloading these from its balance sheet.
YIELD CURVE RE-INVERSION IS IN PLAY
Previously, we noted the trend of re-inversion in the yield curve. The 10Y-2Y inversion reached its deepest on 6/March. The 10Y-2Y spread performed worse than the 7Y-2Y and 5Y-2Y spreads.
Since then, the 7Y-2Y and 5Y-2Y spreads have underperformed the 10Y-2Y spread. The underperformance has been particularly pronounced since the FOMC meeting on 20/March.
Following that meeting, the 5Y-2Y and 7Y-2Y spreads did not recover as much as the 10Y-2Y spread.
This underperformance is likely to continue as demand for medium-dated treasuries (5Y and 7Y) remain sharply stronger than the demand for 10Y treasuries. Higher demand acts to push yields lower, leading to a wider spread with 2Y treasuries.
OUTLOOK FOR RATE CUTS REMAINS UNCERTAIN
Shaan Raithatha, senior economist at Vanguard, stated that his base case calls for no cuts in 2024.While FedWatch currently signals a rate cut at 12/June meeting, the probability is still far from firm.
Recent GDP figures suggest that the economy remains strong. It gives the Fed more room to keep rates elevated. During this period, the yield curve is likely to continue re-inverting.
HYPOTHETICAL TRADE SETUP
Auction dynamics for medium-dated treasuries signals upside for a spread comprising of long 2Y treasuries and short 5Y ones. Using CME’s Yield futures, investors can position across the yield curve intuitively.
Yield futures are quoted directly in yield with a 1 basis point change in the yield representing a P&L of USD 10. As yield futures across various maturities represent the same notional, spread P&L calculations are equally intuitive with a 1 basis point change in the spread between two separate maturities also adding up to a P&L of USD 10.
As demand for 5Y treasuries rise, yields on those will fall relative to 2Y notes. Yields on 5Y softening compared to 2Y notes will result in re-inversion of the 5Y-2Y spread. Against that backdrop, the following hypothetical trade set up will deliver a risk-reward ratio of 2.1x:
• Entry: 17.30 basis points
• Target: 46 basis points
• Stop Loss: 31 basis points
• Profit at Target: USD 287
• Loss at Stop: USD 137
• Reward to Risk: 2.1x
MARKET DATA
CME Real-time Market Data helps identify trading set-ups and express market views better. If you have futures in your trading portfolio, you can check out on CME Group data plans available that suit your trading needs www.tradingview.com
DISCLAIMER
This case study is for educational purposes only and does not constitute investment recommendations or advice. Nor are they used to promote any specific products, or services.
Trading or investment ideas cited here are for illustration only, as an integral part of a case study to demonstrate the fundamental concepts in risk management or trading under the market scenarios being discussed. Please read the FULL DISCLAIMER the link to which is provided in our profile description.

Banknifty Intraday Analysis - Anticipating Market Dynamics
📈 Dive into today's market dynamics with this intraday analysis. Key zones have been identified for potential trading opportunities:
1. **Fresh Shorts Zone (45482 to 45877):** Keep a watchful eye on this range for potential short positions. Opportunities may arise as the market approaches or enters this zone.
2. **Profit Booking Zone (44156 to 43788):** Consider booking profits within this range. Traders may find this zone relevant after a bullish move.
3. **Market Outlook:** Expect a sideways market today. Anticipate price movements within a horizontal range, providing opportunities for both long and short trades.
📉 **Trading Strategy:** Exercise caution and consider entering trades only when the market is within the Fresh Shorts Zone. Additionally, avoid upside trades unless the Previous Day High is surpassed.
For education purpose only. Not a trading recommendation. Adapt your strategy based on real-time market conditions and seize opportunities within the identified zones. Happy trading! 📊💹

USDCAD: Bearish Harmonic Pattern and Weekly Range DynamicsThe USDCAD market is currently exhibiting the formation of a potential bearish bat pattern. Notably, the price is approaching a daily level that coincides with a 4-hour order block. This convergence is significant as it marks the completion of the D leg of our discernible bat harmonic pattern. Additionally, it's worth mentioning that the overall market structure is displaying a bearish bias.
Despite the bearish sentiment in the shorter time frames, it's essential to note that the weekly chart indicates a trading range. This information adds a layer of nuance to the analysis, suggesting a potential conflict between short-term bearish dynamics and a more neutral stance in the longer term.
In light of these technical observations, a potential short-trading opportunity is anticipated. The confluence of the bearish bat pattern, alignment with the 4-hour order block at the daily level, and the bearish structure on lower time frames adds an extra layer of confirmation to the trade setup. Traders are advised to exercise due diligence, considering both the potential for a reversal in the indicated zone and the overarching range-bound behavior on the weekly chart. Goodluck!

Ethereum ($ETH) Market Dynamics
Overall, Ethereum's market dynamics reflect the situation with BTC. Ethereum recently underwent a minor correction and is currently trading near the support zone of $2,465–$2,514, where a buyer response can be expected soon.
For the continuation of the upward movement, CRYPTOCAP:ETH needs to break through the seller's zone of $2,581–$2,646 and test the high at $2,715. In such a scenario, an update of the yearly high becomes increasingly likely.
In the event of a correction, the next buyer zone to be tested is $2,382–$2,436. Below that lies the support level of $2,344, which could also be reached.

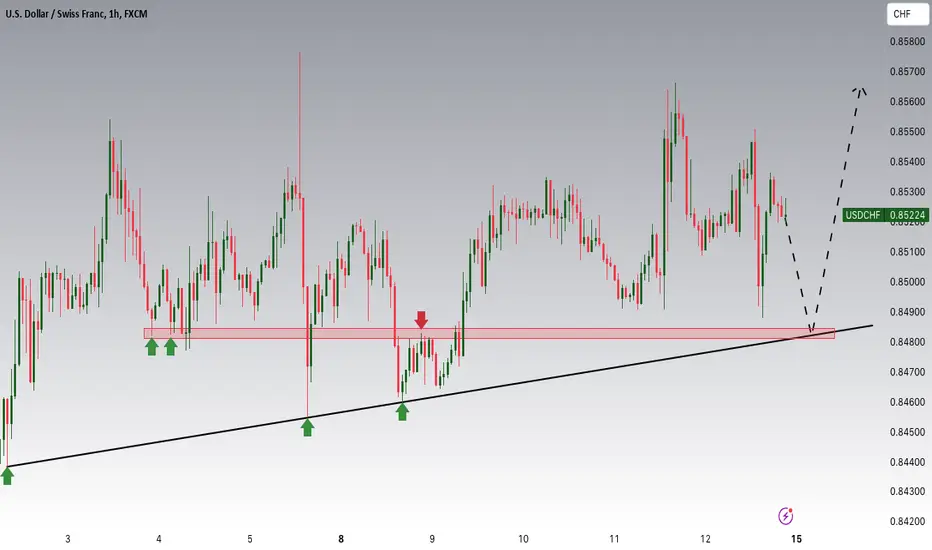
USDCHF Analysis with a Spotlight on CPI DynamicsIn the upcoming trading week, our focus turns to USDCHF, where we're eyeing a potential buying opportunity around the 0.84800 zone. Despite trading in an uptrend, the pair is currently in a correction phase, making its way toward the trend at the 0.84800 support and resistance area.
Delving into the fundamental landscape, recent Consumer Price Index (CPI) data can significantly influence the dynamics of USDCHF. Today's CPI figures underscored the potential strength of the US dollar, with the actual 3.4% surpassing both the forecast of 3.2% and the previous month's 3.1%. This unexpectedly robust inflation data may impact the USD's trajectory, potentially bolstering its position against the Swiss franc.
As traders prepare for the week ahead, it's crucial to factor in both technical and fundamental analyses, keeping a close watch on USDCHF's movement in response to the evolving market conditions.
Trade safe,
Joe
Gold Watch: CPI Impact and Interest Rate DynamicsGreetings Traders,
Our spotlight is on XAUUSD, where we are actively eyeing a potential buying opportunity around the 2015 zone. As gold trades in an uptrend, it currently finds itself in a correction phase, steadily approaching the trend at the critical 2015 support area. This numerical level carries historical significance, serving as a vital juncture where the correction may align with substantial market forces, creating an opportune entry point for traders.
To comprehend the potential market dynamics, we must delve into the macroeconomic fundamentals. The Consumer Price Index (CPI) data, released on October 25, 2023, revealed an actual inflation rate of 1.2%, surpassing the forecast of 1.1% and the previous 0.8%. This ongoing trend of rising inflation is crucial, as it has the potential to influence the Federal Reserve's monetary policy decisions. The latest FOMC data, dated December 13, 2023, reflects a steady interest rate of 5.50%. Such a stance indicates a commitment to combat inflation, but the continuous dovish rhetoric and the decision to maintain the interest rate may suggest that the Fed is cautious about tightening too quickly. This dovish sentiment in the monetary policy can lead to further weakness in the USD.
Considering the interest rate evolution, the Fed has been on a trajectory of cautious adjustments. For instance, in the FOMC meeting on September 20, 2023, the interest rate was held at 5.50%, maintaining the status quo. This steady approach is indicative of the Fed's commitment to managing inflation without overly hindering economic growth. The correlation between interest rates and the strength of the USD is pivotal in understanding gold's potential upsides. The negative correlation between gold and the USD implies that a weakening dollar could propel gold prices higher.
As traders navigate the XAUUSD chart, the careful consideration of both CPI and interest rate data is imperative. The dovish monetary policy's potential impact on the USD's strength and the subsequent influence on gold prices should be a focal point in crafting effective trading strategies.

Shift in dynamics between buyers (bulls) and sellers (bears)In light of my market analysis, there appears to be a noticeable shift in dynamics between buyers (bulls) and sellers (bears). It is particularly noteworthy that bears were unable to establish a new bottom in the September-October period, while bulls successfully broke through resistance, propelling the price to $17.9.
Based on my current observation, I am anticipating a pullback to the support level between $12.8 and $14, which previously served as a resistance level. This seems to present a potential entry point for purchases, aligning with my analysis.
Emphasizing the importance of considering both technical and fundamental factors, it is recommended to conduct thorough assessments, analyze trends, as well as support and resistance levels. Additionally, staying attentive to any news or events that may impact price movements is crucial. Do not overlook the necessity of a clear risk management plan and a thoughtful evaluation of portfolio diversification.
I am open to any feedback :)

AUDCHF Potential Upsides SNB DynamicsAs we gear up for tomorrow's trading session, our primary focus is on AUDCHF, with an aim to identify a potential buying opportunity around the 0.58100 zone. The recent transition of AUDCHF from a downtrend to a breakout phase signals an enticing prospect for bullish positions. Simultaneously, a nuanced analysis of the Swiss Franc (CHF), considering recent policy decisions by the Swiss National Bank (SNB) and broader economic indicators, suggests an environment conducive to potential CHF weakness. This additional layer adds further allure to a buying opportunity in AUDCHF.
In tandem with the SNB analysis, AUDCHF is currently navigating a correction phase, approaching the retrace area at the crucial 0.58100 support zone. This numerical level holds significance not only as a key point on the price chart but also as a potential turning point in the ongoing correction. Our strategic approach involves closely monitoring the interplay between the recent breakout, the prevailing correction, and the pivotal 0.58100 support zone. By incorporating both technical and fundamental analyses, we aim to pinpoint strategic entry points for a potential buying opportunity, considering the evolving market dynamics in tomorrow's session.

EURCHF Technical Trends and SNB Policy DynamicsLooking ahead to the upcoming week, our strategic focus centers on EURCHF, as we actively evaluate a potential buying opportunity within the 0.94600 zone. The technical analysis reveals that EURCHF has been consistently advancing in an uptrend, showcasing a noteworthy upward trajectory. Currently, the currency pair is in the midst of a correction phase, steadily approaching the critical 0.94600 support and resistance area.
Adding a numerical dimension to our assessment, let's consider the recent policy decisions by the Swiss National Bank (SNB) from December 15, 2022, to the most recent update on September 21, 2023. The SNB initiated a significant shift by setting the interest rate at -0.25% on September 22, 2022, and has since made subsequent adjustments. The recent decision last Thursday, on September 21, 2023, reflects the SNB's choice to maintain interest rates unchanged, citing a backdrop of easing inflation.
This dovish stance by the SNB not only aligns with the technical analysis pointing towards a correction in EURCHF but also sets the stage for a potential continuation of CHF weakness. The confluence of technical indicators, recent policy decisions, and numerical data heightens our interest in monitoring EURCHF for a buying opportunity. As we progress through the upcoming week, our strategic approach is to navigate and capitalize on the evolving market dynamics, leveraging the identified buying potential within the specified numerical zone.

💥Bharat Dynamics💥-Nice Breakout💥Bharat Dynamics💥-Nice Breakout
Capital to be deployed- 20k
Investing Price-1296-1300
Breakout Price-1296
Stoploss-1061
Targets-2514
RT for max reach
#bharatdynamics #stockstowatch #StocksToBuy #StocksInFocus #stocks #StockMarket

KEYUSDT Supply and Demand Dynamics⚪ KEYUSDT displayed a noteworthy shift in its price dynamics in September, marked by a convincing breach of the downtrend trendline. This breakthrough was followed by a decisive move above a significant supply area. As a result, the supply zone is poised to transform into a demand zone, laying the groundwork for a renewed uptrend.
⚪ While KEYUSDT has undergone a consolidation phase, the recent daily close above the supply area underlines a shift in market sentiment. We anticipate a minor pullback in the near future, and this presents an opportune entry point for a long position. We will promptly share the KEYUSDT buy signal in our channel to keep our community informed and ready.
⚪ With the supply-to-demand transition in motion, we have set our sights on a robust rally, with a particular focus on the 61.8% Fibonacci retracement level. This level presents a significant milestone, and achieving it could signal further upward momentum for KEYUSDT. Our analysis is a guide to navigating these cryptocurrency markets with confidence and strategy.

LONG: General Dynamics CorpThere is strong demand for artillery shells. The US army is planning to expand production of these shells six fold. Especially the output of the 155mm rounds which have been "critical for Ukriane in the ongoing counteroffensive" (Washington Post, 2023). Army secretary Christine Wormuth said the US is moving "as fast as humanly possible" to speed up production. Cluster munitions are being sent to Ukraine to fill the supply gap in the meantime to bridge the gap until production can expand to meet demand. Before Russia invaded mainland Ukraine in Feb 2022, US production of these units was 14,000 per month, today it has already reached 24,000 per month. The Pentagon aims to produce 1 million shells a year by fall 2025.
General Dynamics Corp is a major producer of artillery from 105mm to 155mm and should increase in scale accordingly. If you watch Ukraine front lines footage, you will see these types of howitzer and tank munitions feature heavily.
In April Ukrainian parliamentary member Oleksandra Ustinova said the country is using 6,000 to 8,000 155mm shells per day (AP, 2023).
I plan to consider taking profit around $325 USD/share but I expect to hold a position until the next US election at least. In the unlikely event that the American will to support the territorial integrity of Ukriane changes or that there is a ceasefire in the fighting I would reassess at that time. Until then and for the foreseeable future, I remain bullish.
See article from AP on 155mm rounds
apnews.com
See article from Washington post
www.washingtonpost.com

RNDRUSDT testing the dynamic resistanceRNDRUSDT is currently at an interesting juncture as it tests dynamic resistance. The dynamic resistance you mentioned is a moving resistance level that adapts to market conditions over time.
According to Plancton's trading rules, a potential long trade could be considered if the following conditions are met:
Breakout from Dynamic Resistance: The first condition involves a clear and convincing breakout above the dynamic resistance level. Such a breakout signifies that the market sentiment may have shifted in favor of the bulls.
Price Target: In this case, you've mentioned a price target of $1.5. This target could be based on various factors, including technical analysis, Fibonacci retracement levels, or previous price history. Plancton's rules would suggest holding the long position until this target is reached.
–––––
Follow the Shrimp 🦐
Keep in mind.
🟣 Purple structure -> Monthly structure.
🔴 Red structure -> Weekly structure.
🔵 Blue structure -> Daily structure.
🟡 Yellow structure -> 4h structure.
⚫️ Black structure -> <= 1h structure.
Follow the Shrimp 🦐

#BCHUSDT Insights into the Market Dynamics💎 #BitcoinCash is currently retesting the previous demand area, which has now transformed into a supply zone. This area can determine the course of action for the market. Will we witness a swift continuation of the prevailing downtrend, or is it a time of uncertainty for sellers? Let's delve into the analysis to determine the most probable outcome.
💎 First and foremost, it's crucial to note that #BCHUSDT has broken below the downtrend trendline and the 200-day Simple Moving Average (SMA) on the daily chart. This bearish price action suggests that bears maintain control and strengthens the case for a continuation of the established downtrend.
💎 At present, #BCH is trading near a resistance level, enticing potential sellers. However, it's important to consider the possibility of a price spike to the upside, or what is often referred to as a "stop-loss hunting" event. Such market dynamics can introduce temporary volatility and test the resolve of bearish sentiment.
💎 Nevertheless, as long as #BCH remains below the critical resistance level, the probability remains tilted in favor of the bears. In this scenario, there is a potential 30% price decline, with #BitcoinCash targeting the 127.2% Fibonacci support level.
💎 It is imperative to closely monitor the price action, particularly for a decisive break and close above the critical resistance area. Such a development would serve as a strong signal that the trend is shifting, potentially opening up opportunities for a bullish reversal. Rest assured, the MCP team will promptly inform Paradisers of any significant trend changes. Stay tuned for updates and valuable insights.

1INCHUSDT needs to hold the dynamic support1INCHUSDT is testing the dynamic resistance inside the descending channel, which is a technical analysis term that refers to a trend line drawn along a series of recent highs that act as a resistance level for the price.
A descending channel is a chart pattern that is characterized by a series of lower highs and lower lows.
The dynamic resistance line is created by connecting at least two highs of the price with a straight line, and as the price moves higher, the line is adjusted to connect with the new highs. When the price approaches the dynamic resistance line, it suggests that the trend may be changing from bearish to bullish.
In addition to testing the dynamic resistance, the market needs to create a breakout from the descending channel on the $0.55 area and retest it as valid support. A breakout is a technical analysis term that refers to a price movement above or below a significant level of support or resistance. A breakout above the descending channel would suggest that the trend is changing from bearish to bullish and could lead to a rally in the price.
A retest of the breakout level as support would confirm the new uptrend.
If the price of 1INCHUSDT meets Plancton's Rules, which are a set of trading rules based on price action and market psychology, it could signal a good opportunity to open a new long position, which is a bet that the price will continue to rise.
–––––
Follow the Shrimp 🦐
Keep in mind.
🟣 Purple structure -> Monthly structure.
🔴 Red structure -> Weekly structure.
🔵 Blue structure -> Daily structure.
🟡 Yellow structure -> 4h structure.
⚫️ Black structure -> <= 1h structure.
Follow the Shrimp 🦐

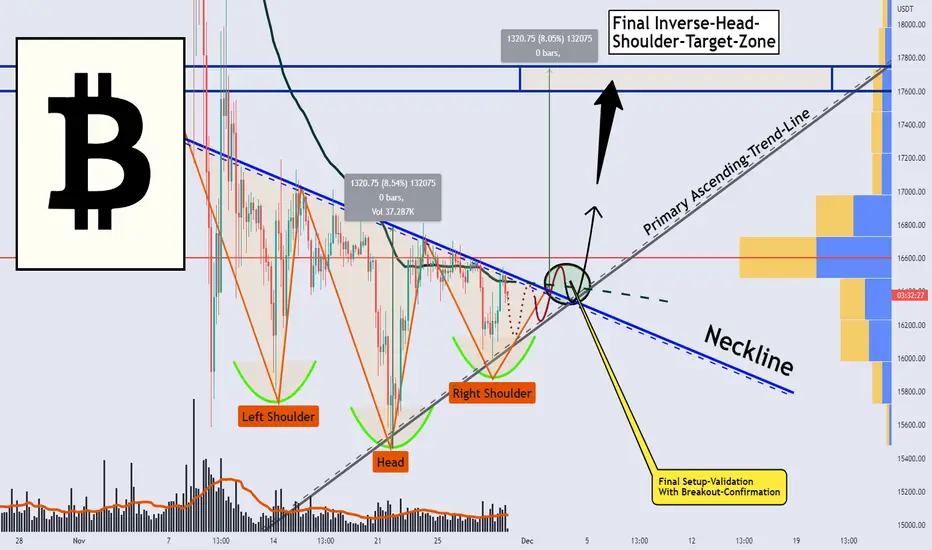
BITCOIN: On The Local, Formation Points To Breakout-Dynamics!Hello Community,
Welcome to this analysis of Bitcoin from the local 2-hour timeframe perspective. In the recent posts I uploaded about Bitcoin I already pointed out the important factors from a daily and weekly perspective and what we need to consider with these timeframes. As especially on the shorter timeframe there are given potentials to bounce Bitcoin is now also forming an interesting constellation on the 4-hour timeframe. When looking at my chart we can watch there how Bitcoin developed this solid primary ascending trend line marked in grey on which Bitcoin already bounced several times. This whole structure is adding up to a potential inverse head-and-shoulder formation with the left shoulder and the head already completed, now as Bitcoin penetrates the 50-EMA this is a decisive development because once Bitcoin breaks out above the neckline as shown in my chart this will be the final setup from where Bitcoin is likely to continue with further volatility finally reaching out the final target-zones as seen in my chart. Although such a formation can invalidate also when the right shoulder does not form and Bitcoin breaks down currently there is a higher likelihood given for the formation to complete nonetheless it will be a crucial factor on how Bitcoin moves into the final target zones when considering further dynamics to emerge especially on the higher timeframes.
In this manner, thank you everybody for watching, Let's move forward together.
The information provided is only educational and should not be used to take action in the markets.
BHARAT DYNAMICS LTD Triangle Pattern Breakout*BHARAT DYNAMICS LTD*
Time Frame : Daily
Observation:
* Triangle Pattern Breakout
* Swinghigh Break
Resistance/Target: 985 1090 1192 1256
Support: 818 698

Bharat dynamics limitedBharat Dynamics Limited @CMDBDL is striding towards intelligent & autonomous drone launched precision attack capability.

The Crypto Market Dynamics and BreakdownA brief overview of BTC , TOTAL, TOTAL2 , USDT dominance, USDC dominance and DXY (dollar strength index).
So guys, i thought id post an update on the most recent crypto market developments, i plan to push out a video alongside this too to break it down in depth but heres what im seeing developing so far.
Ive correlated 6 charts that i think are worth looking at on a whole to get an idea of market wide developments. BTC , the driver of the market direction. Stablecoin dominance pairs, showing the relationship of money flow in and out of stablecoins back into the market (highly correlated with reversals), TOTAL and TOTAL2 , the total crypto market caps for ALTS and for BTC and ALTS to see overall bullish / bearish intensions, and the DXY (dollar strength index) which has been known to work inversely with BTC market reversals. E.g, when DXY is pumping, crypto is correcting and vice versa.
I think at present theres more downside risk than upside potential having cleared the charts and looking at the in a new perspective. I am still longer term bullish until we break and close below 28K which would confirm a new LL, breaking the range we've been in for the last year and invalidating any bullish momentum. However at current we have put in a new HH on TOTAL and TOTAL 2 and respecting the swing low so things remain to be bullish based on HTF structure for both marketcap pairs. That being said it seems as though we have been generating liquidity on both the buy and sell side on BTC , where due to having an inefficiency to fill to the left, price has nothing to liquidate as there is no structure to target to run stop losses. Therefore, what we have been developing is this upwards bearish flag formation after coming into HTF weekly demand. Buyers have shown presence with higher volume coming in at the lows and respecting an uptrend, but with the intension to mitigate the HTF supply above taking out the sell side liquidity and now targeting the buy side liquidity, sweeping the first low we have put in within the weekly demand range to target the extreme demand range on the weekly and daily timeframes. This would have induced both buyers and sellers into the market to liquidate them all enabling a capitulation event to take place to fuel the move higher. This same scenario looks likely to occur on both the TOTAL and TOTAL2 pairs too.
Stablecoin pairs did start to show some bearish signs with bearish divergence on the RSI and putting in new lower lows on the daily TF and weekly TF with bearish momentum coming in as shown by the engulfing candles and also respecting HTF supply. However, we have continued to the upside with less momentum and approaching key supply zones now. If price manages to push through these then it would be a continuation to the upside for stablecoins and bearish for the rest of the market. Right now its just a case of being patient and watching for signs of bearish structure change on the daily TF as we come into the zones. I think theres a possibility for them to push higher and fake out the highs, creating that capitulation event before reversing and becoming bearish with the market becoming bullish after such an event.
DXY is bullish on the weekly, but remains bearish on the monthly timeframe , coming into HTF supply range on the monthly TF in the premium of the leg. Im expecting the DXY to take out the highs, liquidating the highs, come into that HTF supply and reverse before starting to take out the lows. It looks oversold on the RSI on weekly and monthly and usually results in a reversal at these points. It works inversely to BTC so if the DXY becomes bearish it would be a good sign for the crypto market.
The dynamics are correlating to show short term bearish momentum for a possible long term bullish outlook. The on chain analysis also supports this with supply still getting taken and large volumes on outflow activity occurring. That being said, the economy on a whole look bleak right now, stocks look terrible and BTC has held up pretty well so far in comparison. Talks of one of the biggest recessions is also looming with a macro economic POV that looks pretty trash right now so its all a little uncertain at present, not just for crypto but with the larger economic outlook.

USD/CHF: the US dollar develops upward trading dynamicsCurrent dynamics
During the Asian session, the USD/CHF pair has been actively growing, updating local highs since March 29. Now the instrument is testing the level of 0.9340 for a breakout, waiting for new drivers to move.
Meanwhile, the US dollar index approached the psychologically important level of 100 points on expectations of higher consumer prices, which will be published next week. The yield on 10-year Treasury bonds recovered the three-year high at 2.66% against the backdrop of hawkish rhetoric from the US regulator about raising interest rates already at the May meeting.
Demand for the US dollar remains quite high, as the market is still concerned about the prospects for the development of the global economy in connection with the crisis around Ukraine. While Western countries are stepping up unprecedented sanctions pressure against the Russian Federation, residents of almost all developed countries also feel the effect of new restrictions, recording a record increase in consumer prices. The tensest situation is developing in Europe, most dependent on Russian energy imports. The European Central Bank (ECB) position also remains ambiguous, which speaks about the need to curb price growth, but so far has not resorted to tightening its monetary policy.
Positive macroeconomic statistics supported the position of the Swiss currency yesterday. Thus, the unemployment rate in the country in March remained at the same level of 2.2%, which coincided with market expectations.
Support and resistance
On the daily chart, the Bollinger Bands are slightly growing: the price range is slightly expanding but remains quite spacious for the current level of activity in the market. The MACD indicator grows, keeping a strong buy signal (the histogram is above the signal line). Having approached its highs, Stochastic is trying to turn into a horizontal plane, signaling the risks of the US currency being overbought in the ultra-short term.
Resistance levels: 0.9352, 0.9381, 0.9430, 0.9459.
Support levels: 0.9320, 0.9300, 0.9279, 0.9250.

USD/JPY: the instrument shows flat trading dynamicsCurrent trend
The US dollar is developing a "bearish" signal paired with the Japanese yen in Asian trading, correcting after a noticeable increase the day before. At the moment, USD/JPY is holding near 115.20, waiting for new drivers to appear. Throughout the week, ultra-high volatility has been observed on world trading floors and investors have abandoned risky assets due to the difficult geopolitical situation. Against this background, the yen is strengthening its position.
During a speech in the national parliament, the head of the Bank of Japan, Haruhiko Kuroda, said that the regulator will continue its ultra-soft monetary policy, despite the fact that rising global inflation is forcing other major central banks to raise interest rates. He also stressed that officials will continue to carefully monitor the impact of the escalation of tensions in Ukraine on oil prices, since Japan is heavily dependent on energy imports.
The Japanese currency is slightly supported by the published macroeconomic statistics from Japan. The Consumer Price Index in the Tokyo region in February showed an increase of 1.0% after rising 0.5% in January. Analysts expected an increase of 0.6%. Excluding Fresh Food prices, inflation in Tokyo increased by 0.5%, accelerating from 0.2%. Markets projected a 0.4% growth.
Support and resistance
In the D1 chart, Bollinger Bands are reversing horizontally. The price range is not changing, reflecting ambiguous dynamics of trading in the short term. MACD, which formed a new buy signal the day before (the histogram is located above the signal line), is again inclined to reverse downwards, reacting to the "bearish" nature of Friday's trading. Stochastic keeps a moderate uptrend, gradually approaching the level of "80" and pointing to the risks of the US currency being overbought in the ultra-short term.
Existing long positions should be kept until technical indicators are clarified.
Resistance levels: 115.28, 115.68, 116.00, 116.34.
Support levels: 115.00, 114.50, 114.00, 113.50.

General Dynamics Poised To Rip HigherGeneral Dynamics stock failed to pull back after breaking recent resistance. With building short interest, coupled with an ascending triangle, this is a prime example of an imminent short squeeze.
