NIFTY50 is looking Bullish.
🤑 Nifty is likely to be Bullish till it's above 18270.
❓ Reason: Because Nifty is above the Trailing SL of ATM Machine Indicator on Hourly Chart.
🚧 Upside Hurdles: 18410, 1851, 18790,
🌈 Advice: 1.) Take reversal trade near these levels, or 2.) Wait for Breakout and Sustainability.
🟢 Positional Trend is Positive.
👺 Long Term Trend is Trapping the Bulls.
📢 Disclaimer: We are NISM Certified so we don't hold any position in Nifty Future or Options as per SEBI guidelines. Take trades as per your own technical analysis, we are just educating you. We are not using any type of indicators for finding out of levels.
🙏🏻 Come to Learn, Go to Earn🙏🏻
✅ We are NISM Certified. ✅
☔If you find us useful, Please help the helpless near you.☔
☺Happy to Help.☺
#ohotrading #ohotrading1 #stockmarket #NIFTY50 #november22 @ohotrading #sharemarket #nifty #today #atmmachine #homework
Search in ideas for "INDICATORS"

NIFTY50 is looking Bullish.
🤑 Nifty is likely to be Bullish till it's above 18270.
❓ Reason: Because Nifty is above the Trailing SL of ATM Machine Indicator on Hourly Chart.
🚧 Upside Hurdles: 18410, 18510, 18810.
🌈 Advice: 1.) Take reversal trade near these levels, or 2.) Wait for Breakout and Sustainability.
🟢 Positional Trend is Positive.
👺 Long Term Trend is Trapping the Bulls.
📢 Disclaimer: We are NISM Certified so we don't hold any position in Nifty Future or Options as per SEBI guidelines. Take trades as per your own technical analysis, we are just educating you. We are not using any type of indicators for finding out of levels.
🙏🏻 Come to Learn, Go to Earn🙏🏻
✅ We are NISM Certified. ✅
☔If you find us useful, Please help the helpless near you.☔
☺Happy to Help.☺
#ohotrading #ohotrading1 #stockmarket #NIFTY50 #november22 @ohotrading #sharemarket #nifty #today

Nifty is looking Indecisive.
🤑 Nifty is likely to be INDECISIVE till it's between 17940 and 18155.
❓ Reason: Because Nifty is in between ATM Machine Yellow Zone.
🚧 Upside Hurdles: 18305.
🚧 Dowside Hurdles: 17860.
🌈 Advice: 1.) Take reversal trade near these levels, or 2.) Wait for Breakout and Sustainability.
🟡 Positional Trend is Indecisive.
🔴 Long Term Trend is Negative.
📢 Disclaimer: We are NISM Certified so we don't hold any position in Nifty Future or Options as per SEBI guidelines. Take trades as per your own technical analysis, we are just educating you. We are not using any type of indicators for finding out of levels.
🙏🏻 Come to Learn, Go to Earn🙏🏻
✅ We are NISM Certified. ✅
☔If you find us useful, Please help the helpless near you.☔
☺Happy to Help.☺
@ohotrading

Nifty is looking bearish
🤑 Nifty is likely to be Bearish till it's below 18155.
❓ Reason: Because Trailing SL is above the Nifty in ATM Machine Indicator on Hourly Chart.
🚧 Dowside Hurdles: 18050, 17940, 17815.
🌈 Advice: 1.) Take reversal trade near these levels, or 2.) Wait for Breakout and Sustainability.
🔴 Positional Trend is Negative.
🔴 Long Term Trend is Negative.
📢 Disclaimer: We are NISM Certified so we don't hold any position in Nifty Future or Options as per SEBI guidelines. Take trades as per your own technical analysis, we are just educating you. We are not using any type of indicators for finding out of levels.
🙏🏻 Come to Learn, Go to Earn🙏🏻
✅ We are NISM Certified. ✅
☔If you find us useful, Please help the helpless near you.☔
☺Happy to Help.☺
✅NISM Certified
✅Government of India Registered Brand
@ohotrading

NIFTY50 is looking Bullish.
🤑 Nifty is likely to be Bullish till it's above 18105.
❓ Reason: Because Nifty is above the Trailing SL of ATM Machine Indicator on Hourly Chart.
🚧 Upside Hurdles: 18260, 18355, 18550.
🌈 Advice: 1.) Take reversal trade near these levels, or 2.) Wait for Breakout and Sustainability.
🟢 Positional Trend is Positive.
🔴 Long Term Trend is Negative.
📢 Disclaimer: We are NISM Certified so we don't hold any position in Nifty Future or Options as per SEBI guidelines. Take trades as per your own technical analysis, we are just educating you. We are not using any type of indicators for finding out of levels.
🙏🏻 Come to Learn, Go to Earn🙏🏻
✅ We are NISM Certified. ✅
☔If you find us useful, Please help the helpless near you.☔
☺Happy to Help.☺
@ohotrading

NIFTY50 is looking Bullish.
🤑 Nifty is likely to be Bullish till it's above 18000.
❓ Reason: Because Nifty is above the Trailing SL of ATM Machine Indicator on Hourly Chart.
🚧 Upside Hurdles: 18220, 18355, 18600.
🌈 Advice: 1.) Take reversal trade near these levels, or 2.) Wait for Breakout and Sustainability.
🟢 Positional Trend is Positive.
🔴 Long Term Trend is Negative.
📢 Disclaimer: We are NISM Certified so we don't hold any position in Nifty Future or Options as per SEBI guidelines. Take trades as per your own technical analysis, we are just educating you. We are not using any type of indicators for finding out of levels.
🙏🏻 Come to Learn, Go to Earn🙏🏻
✅ We are NISM Certified. ✅
☔If you find us useful, Please help the helpless near you.☔
☺Happy to Help.☺
✅NISM Certified
✅Government of India Registered Brand
@ohotrading

NIFTY50 is looking Indecisive.
🤑 Nifty is likely to be INDECISIVE till it's between 18045 and 18120.
❓ Reason: Because Nifty is far away from the Target of ATM Machine Indicator on Hourly Chart. Do it has to come near to Yellow ATM Machine.
🚧 Upside Hurdles: 18180.
🚧 Dowside Hurdles: 17955.
🌈 Advice: 1.) Take reversal trade near these levels, or 2.) Wait for Breakout and Sustainability.
🟡 Positional Trend is Indecisive.
🔴 Long Term Trend is Negative.
📢 Disclaimer: We are NISM Certified so we don't hold any position in Nifty Future or Options as per SEBI guidelines. Take trades as per your own technical analysis, we are just educating you. We are not using any type of indicators for finding out of levels.
🙏🏻 Come to Learn, Go to Earn🙏🏻
✅ We are NISM Certified. ✅
☔If you find us useful, Please help the helpless near you.☔
☺Happy to Help.☺
✅NISM Certified
✅Government of India Registered Brand
@ohotrading

NIFTY50 is looking Bullish
🤑 Nifty is likely to be Bullish till it's above 18055.
❓ Reason: Because Nifty is above the Trailing SL of ATM Machine Indicator on Hourly Chart.
🚧 Upside Hurdles: 18185, 18355, 18550.
🌈 Advice: 1.) Take reversal trade near these levels, or 2.) Wait for Breakout and Sustainability.
🟢 Positional Trend is Positive.
🔴 Long Term Trend is Negative.
📢 Disclaimer: We are NISM Certified so we don't hold any position in Nifty Future or Options as per SEBI guidelines. Take trades as per your own technical analysis, we are just educating you. We are not using any type of indicators for finding out of levels.
🙏🏻 Come to Learn, Go to Earn🙏🏻
✅ We are NISM Certified. ✅
☔If you find us useful, Please help the helpless near you.☔
☺Happy to Help.☺
✅NISM Certified
✅Government of India Registered Brand
@OhoTrading

NIFTY50 is looking Indecisive
🤑 Nifty is likely to be INDECISIVE till it's between 17705 and 17890.
❓ Reason: Because Nifty is far away from the Target of ATM Machine Indicator on Hourly Chart. Do it has to come near to Yellow ATM Machine.
🚧 Upside Hurdles: 18000.
🚧 Dowside Hurdles: 17535.
🌈 Advice: 1.) Take reversal trade near these levels, or 2.) Wait for Breakout and Sustainability.
🟡 Positional Trend is Indecisive.
🔴 Long Term Trend is Negative.
📢 Disclaimer: We are NISM Certified so we don't hold any position in Nifty Future or Options as per SEBI guidelines. Take trades as per your own technical analysis, we are just educating you. We are not using any type of indicators for finding out of levels.
🙏🏻 Come to Learn, Go to Earn🙏🏻
✅ We are NISM Certified. ✅
☔If you find us useful, Please help the helpless near you.☔
☺Happy to Help.☺

NIFTY50 is looking Bearish
🤑 Nifty is likely to be Bearish till it's below 17850.
❓ Reason: Because it's far away from ATM Machine Indicator Target on Hourly Chart.
🚧 Dowside Hurdles: 17750, 17645, 17535.
🌈 Advice: 1.) Take reversal trade near these levels, or 2.) Wait for Breakout and Sustainability.
🔴 Positional Trend is Negative.
🔴 Long Term Trend is Negative.
📢 Disclaimer: We are NISM Certified so we don't hold any position in Nifty Future or Options as per SEBI guidelines. Take trades as per your own technical analysis, we are just educating you. We are not using any type of indicators for finding out of levels.
🙏🏻 Come to Learn, Go to Earn🙏🏻
✅ We are NISM Certified. ✅
☔If you find us useful, Please help the helpless near you.☔
☺Happy to Help.☺

NIFTY is looking Bearish today🤑 Nifty is likely to be Bearish till it's below 17140.
❓ Reason: Because it's the Top of ATM Machine Indicator No Trade Zone on Hourly Chart.
🚧 Dowside Hurdles: 17070, 16970, 16805.
🌈 Advice: 1.) Take reversal trade near these levels, or 2.) Wait for Breakout and Sustainability.
🔴 Positional Trend is Negative.
🔴 Long Term Trend is Negative.
📢 Disclaimer: We are NISM Certified so we don't hold any position in Nifty Future or Options as per SEBI guidelines. Take trades as per your own technical analysis, we are just educating you. We are not using any type of indicators for finding out of levels.
🙏🏻 Come to Learn, Go to Earn🙏🏻
✅ We are NISM Certified. ✅
☔If you find us useful, Please help the helpless near you.☔
☺Happy to Help.☺

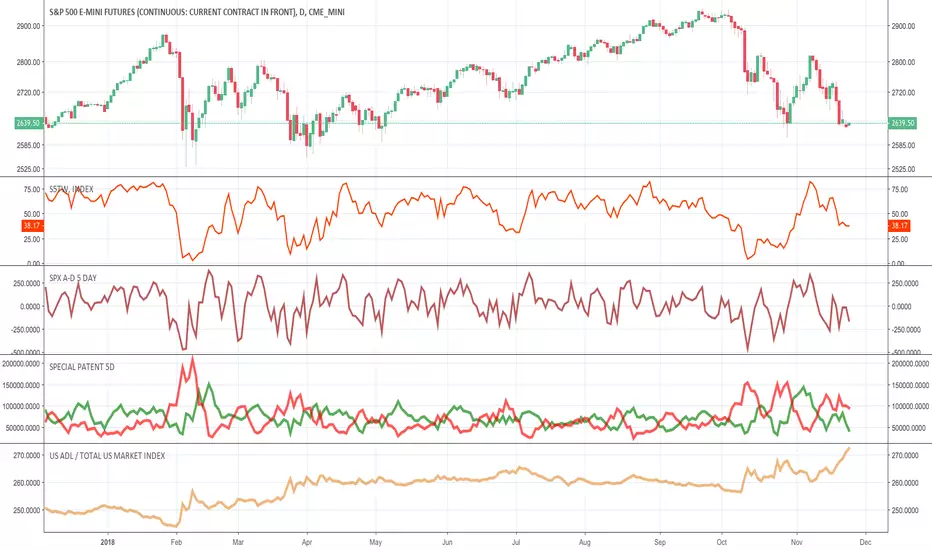
Leading Indicators Part 2 - an early warningIn this second set of LEading indicators...
The TLT (Bonds ETF) see a sell off trend starting... this is actually bullish for the equities market
The TIPS appears to have possibly topped.
The VIX and VVIX are bullishly divergent. IMHO, due for a spike soon.
Overall... bullish until it hits the fan. It appears that we may be in for another surprise.
Just be cautious if you are bullish.

Bitcoin | Wait For the Indicators To Produce Bearish SignalFirstly I would like to remind that current trend is a Downtrend . This trend was mainly defined by the bearish crossover between 20 and 121 MA . There were also confirmations from indicators such as RSI and MFI . Plus my last idea where the Heikin-Ashi Chart was used to confirm the downtrend. Please read my previous ideas for more details. On those ideas I also explained how the indicators change their behavior when the Price has a particular trend ( whether an Uptrend or a Downtrend ). This is important to understand for this analysis.
It is also important to understand the nature of indicators that we will use. All the indicators you see on the Chart identify overbought and oversold zones. They base their assessment on where the price is currently trading relative to prior prices. The difference is that they use different calculations, but the approach is generally similar . This put some limitation on them - when the bearish sentiment overwhelms , which is typical during a Downtrend, the indicators can not correctly identify the oversold zone. ( because more selling happening ). Conversely, when the bullish sentiment overwhelms , which is typical during an Uptrend, the indicators can not correctly identify the overbought zone. ( because more buying is happening ). And this is why indicators such as RSI , MFI , Stochastic and some other carrying a name "Trend-Following". Because you use bearish signals during a Downtrend and bullish signals during an Uptrend . Let's finish at this point and go to the idea.
After the retracement occurred, we had had a Local Downtrend . In some of my previous ideas I explained that the zone around $8.700 , which has been formed by the candle with the most buying pressure , was the only support holding the price from a further decline . You can see on the Chart that once this support has been broken the price went through the whole range formed by this candle. Also in one of my previous idea I explained on the Darvas Box theory , which prompted us that after the price was unable to pass through the main resistance ( 121 MA ) the one will return to its previous box .
Currently the decline was stopped by the support zone around $6.700 . Which might reverse the local trend on an Uptrend and let the indicators to get into the overbought zone. Nevertheless do not rely on supports during a downtrend, because they are weak. Plus the 20 MA currently working as a local resistance .
As has been said above we can't rely on supports and indicators to provide bullish signals , which gives us no clue if this local uptrend will continue. But we need to be ready to act efficiently in case this support brought enough bullish power to get the indicators into an Overbought Zone . Several tips on this:
-Firstly do not initiate short position once the indicator go into an overbought zone. Wait for the indicators go back from the overbought zone . The Stochastic's %D line will cross its 80 level from above. The RSI will cross its 50 horizontal level from above.
-Always pay attention to the Chart to see if price is close near some resistances , especially strong ones . The resistances work more efficient than supports during a downtrend and may reverse the price direction.
-I recommend you not to use MFI to provide any signals, because of its sensitivity . Use this tool as a confirmation for other tools.
Screenshot in addition: The performance of an overbought zone of the Stochastic indicator during a downtrend
Small notice: The MFI is believed to be a leading indicator, because it uses volumes for its calculation. It is a myth . The calculations of the MFI might serve unique only for short term situations. It will help you to define the price is overpriced , when the one is growing and there is no growing in trading volumes . But it can not define a new trend on its own, even the local trend . The point is that the MFI indicator is equal to other indicators such as RSI or Stochastic . Use these indicators together ( because they have different calculations ) and let them confirm each other. Never believe the MFI on its own, as well as the other indicators. More confirmations from different tools is always good.
Thank you for reading this idea! Hope this analysis has been useful to you and will help you to improve your own strategies)
Please if you like the idea hit the like button to support my this work. Also share your own Charts and Ideas in comments below.
Remember this analysis is not 100% accurate. No single analysis is. To make a decision follow your own thoughts.
The information given is not a Financial Advise.

3 Liquidity indicators.3 Liquidity indicators. The liquidity indicators really need to be used together; they all give you great insight into the changes happening under the surface of the price action.
1. Liquidity sentiment indicator. This indicator shows you the strength of liquidity during a move up or in a pull back. It’s not moderated so it shows a relative strength of liquidity over all time scales. This is the most important of the indicators for staying in a trade as you actually see how much of the strength of the liquidity had dissipated during a move in price, it’s great for all time scales.
2.Time layered Liquidity Indicator gives you an idea of how long a change in liquidity strength takes to play out. The thickest line showing the current liquidity on the surface(nearest time period), but if this has been preceded by very strong liquidity at the surface for an extended period of time the moving average of the different layers of the liquidity will give you a good idea of how long that move has to play out until the liquidity makes a neutral level from the recent strong surface liquidity.
3. Irregular liquidity is vital to trading futures in short time periods that bridge different time zones over the Globex Futures markets, and securities(ones only trade during lit hours) over longer periods that bridge more than one day. This is because the lit hours of NYSE have so much more liquidity than the other globex hours, and different days of the week or month also have different patterns of liquidity because of hedging. The irregular liquidity indicator moderates any time period with the last 15 either days or week periods depending on the setting you choose, and smooths them to a moving average of 8 time periods. The day moderation is for a 4 hour time period and less setting on your TradingView. The weekly setting is for smoothing when you have your time period set to days. The Irregular Liquidity indicator also has a line in its moderation scale that is set at neutral to give you a relative feel of how far above or below an average liquidity the current measurement is.

Bullish Gold Trading: A Clear Uptrend Confirmed by Indicators.As we analyze the current gold market, we see a strong bullish trend. The moving averages provide clear signals that support this upward momentum.
### Key Observations:
1. **Moving Averages Alignment**: The short-term moving average (e.g., 50-day) is consistently above the long-term moving average (e.g., 200-day), indicating a solid bullish crossover. This alignment suggests that the recent price action is supported by strong buying interest.
2. **Support Levels**: Recent price dips have found solid support at key moving average levels, reinforcing the bullish sentiment. Each bounce off these averages indicates buyers are stepping in, further solidifying the uptrend.
3. **Volume Confirmation**: The increase in trading volume during upward price movements adds credibility to the bullish trend. Higher volume often signifies stronger conviction among traders, a positive sign for continued upward movement.
4. **Technical Indicators**: Additional indicators, such as the Relative Strength Index (RSI), show bullish momentum, suggesting that gold is not overbought yet and still has room to grow.
### Trading Strategy:
- **Entry Points**: Consider entering long positions on pullbacks to the moving averages, as these levels have proven to be strong support.
- **Stop Loss**: To manage risk effectively, set stop-loss orders just below the recent swing lows or below the moving averages.
- **Target Levels**: Identify key resistance levels for potential profit-taking while also monitoring overall market sentiment and economic factors that could influence gold prices.
### Conclusion:
The bullish trend in gold is well-supported by moving averages and other technical indicators. As traders, staying informed and adapting our strategies to capitalize on this upward momentum is crucial. Keep an eye on the charts and trade wisely!
Happy trading! 🟡📈

MACRO Indicators...I talk Why Bitcoin... What the institutions are going to do.
The SXaylor's...
Why scalping sucks...
Why swing trading sucks...
Why positional Trading rules...
And my favorite Macro Indicators...
I may be moving all videos to YouTube.
I am having quite a few issues getting these videos uploaded...

Doji Star Indicators...SNDL not done yet.Seeing the massive influx of indicators we saw (including one of larger size), it's no surprise this market jumped. I don't think we begin trending bearish yet. Look for more jumps tomorrow.

Long term weekly BTC price prediction using BF indicatorsHello everyone,
This trading idea has been made using the Black Flamingo indicators. Fell free to check their descriptions (in related ideas) and if you want to test them, you can PM me.
In the following, I will assume that you understand the basics of these indicators.
TL;DR: All the indicators are showing that a correction to the 8k-12k zone is necessary at this time, and we cannot continue the parabolic uptrend.
-----
The momentum (BF trend) shows a parabolic support that have been tested many time. Also there is a divergence between the price peaks and the momentum. As we are returned in the overbought zone, there is no more fuel to continue on this momentum support, so it will likely break.
The highest winrate signal on Bf trend is a major correction when a parabolic momentum support break with a divergence. The next week is key to confirm this TA.
There is also three other signs that a major correction will happens :
- The volumes are falling continuously during the parabolic uptrend
- The context shows that we are in sell zone and ready for a correction, to return at least in a bullish range
- We are at weekly major resistance (ATH)
With all this arguments, I think that the most probable next move is a major correction for at least 3-6 months.
---
About the target of this correction, we can see on the VPVR that the volume support zone is between 8k-12k.
that also corresponds with the major monthly uptrend support.
About the timing, if we refers to the length of the uptrend in the momentum (dec 18 to nov 20, so 23 months), if we are on a bullish correction, we should correct during at least 6 months. If this is a more long term correction, that could lead to the major support, we could expect a 1 year correction.
To illustrate it, I drawed on the TA the bars of a scenario for a 1 year correction, with a breakdown of the 10k level
---
Finally, we can talk about what happens if this TA is not realized directly.
First, the signal on BF trend is not confirmed (so the RR of a long term short is high at this time), so we can expect a last pump high in the overbought zone, then a break of the parabolic support. this can leads to 22k-24k levels but no more. If this happens, the correction will be harder and longer because the spring on the momentum would have been pulled too hard.
Seeing this TA, I think that the chances that we will front run without a major correction to 30-50k or more is near 0%.
-----
thank you for your reading, and feel free to comment or ask me questions :)

SPY | Multiple Bearish Indicators...Wheres the volume?After weeks of bullish action.
Multiple Bearish Indicators formed.
WHERES THE VOLUME?!?


Trading On 1/ 2/3 Indicators 4H, ETHUSD Enter & Exit With Ease!Pretty self explanatory...if you are not using at least these 3 indicators....you're screwed.

BTC Enter and Exit Indicators These are a set of strong trading signals that can be used for entry and exit points. I have used Bitcoin as my example as it clearly shows strong entry and exit points. Please look at the graph and indicators carefully as it can be hard to follow.
The way it works is that a confirmation buy or sell signal happens when all 3 indicators cross over their respective boundary line. Once all 3 have crossed over or under their respective lines it almost always shows the direction of the new trend.
So breaking down the indicators:
Commodity Channel Index (CCI) Inputs: (75,OHLC/4)
Stochastic (Stoch) (20,3,3)
Chande Momentum Oscillator (8,OHLC/4)
(ChandeMO)
The conditions is that all 3 indicators must cross over their respective lines at the same time. For a Buy Signal:
1. ChandeMO must be below and is crossing above the 0 line
2. Stoch must be below the 25 line and has crossed above it
3. CCI must (should) be below the -100 line and cross above it
Buy security when all indicators have closed above the line
Sell Signal:
1. ChandeMo must be above the O line and has crossed below
2. Stoch must be above the 75 line and has crossed below
3. CCI must (should) be above the 100 line and cross below
Sell security when all indicators have closed below the line
In extremely volatile markets and securities, the indicators fail to be very reliable as can be seen with the earlier sell line (red line) for BTCUSD. This is not a definitive trading signal but is good entry and exit guide.
