long position GBPAUD indicators, analysts, etc are saying to long GBP. 5:1 ratio. small tp1. far tp2 & tp3. lets see what happen.
cheers to many pips
Search in ideas for "INDICATORS"

SP 500, initiative institutional selling on 2/8/19Indicators computed on the SP500 daily data, that include volume of SPY and ES March19, indicate initiative institutional selling in the SP500 stocks on 2/8/19.
Also the algorithm Arzamas-16 indicates big money flowing out of SP500 stocks. These two factors make it likely that we have reached a market top.
The coming days will be important. Sellers took the initiative on 2/8/19, we will see today and on Monday how strong the commitment of buyers are.
Longs should be cautios. In fact, taking a 1 unit short position is justified.

Indicators starting to fan8, 15, 21, and 55 Indicators starting to fan are starting to fan out, but volume is still relatively low.


Indicators point to XLM falling but overall trend is bullishQuick simple chart for you here. Overall news has been great for Stellar and it seems as though XLM is great for a long term hold. Indicators suggest we may fall a little more although I would be very wary about shorting. Personally I believe the smart money would be buying once this dip is over and holding until the 4100 mark.
Yours Truly,
Tragic Shit

2015 BTC Bottom IndicatorsIndicators that marked the 2015 BTC bottom
- Weekly MA 90 Breakout
- Moving Average Ribbon Crossover
- Huge sell volume
Will it repeat?

Swing Trading with your Indicators of preferenceIndicators of preference -
Stoch RSI with the RSI and the Bollinger Bands.
Each of you have your own style.

$SPY Over bought, Indicators Are Heavy, Short term BearishIndicators are pointing to over bought, expecting to see a retrancement to the 275 area \

Indicators now aligned for parabolic price actionThis is a reliable bitcoin specific automated trading approach backed by quantitative and semi quantitative techniques.
Indicators optimized for 4 hour time frame:
-Momentum
-Volume profile
-MACD
-Bitcoin momentum
-Squeeze mometum
-Negative and positive volume index
-Bitcoin buy/sell volume across multiple exchanges
Not shown, but model backed by:
-USDT/USD ratios
-Directional trend analysis
-Bitcoin market dominance

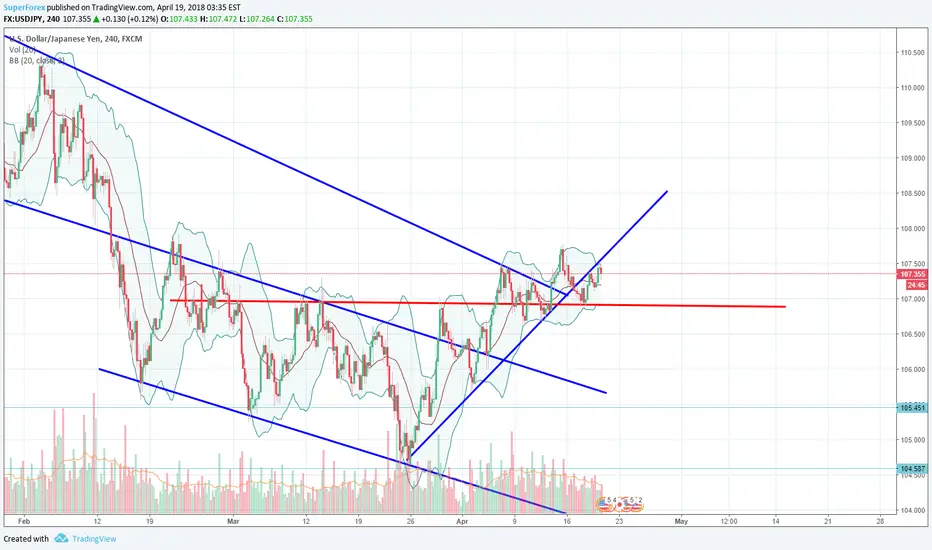
Indicators point to a growth of pairAt the moment, we are watching our pair come out of the descending channel and on the daily chart formed a "young" uptrend. And now the pair has found a new level of support.
In view of political unrest, the dollar is quite unstable. However, the current trend indicates a strengthening of the reserve currency.
Most technical indicators on the day and 4-hour time-frames indicate a purchase as well. Therefore, the trade council will take long positions from the support level and monitor the formation of an upward trend.
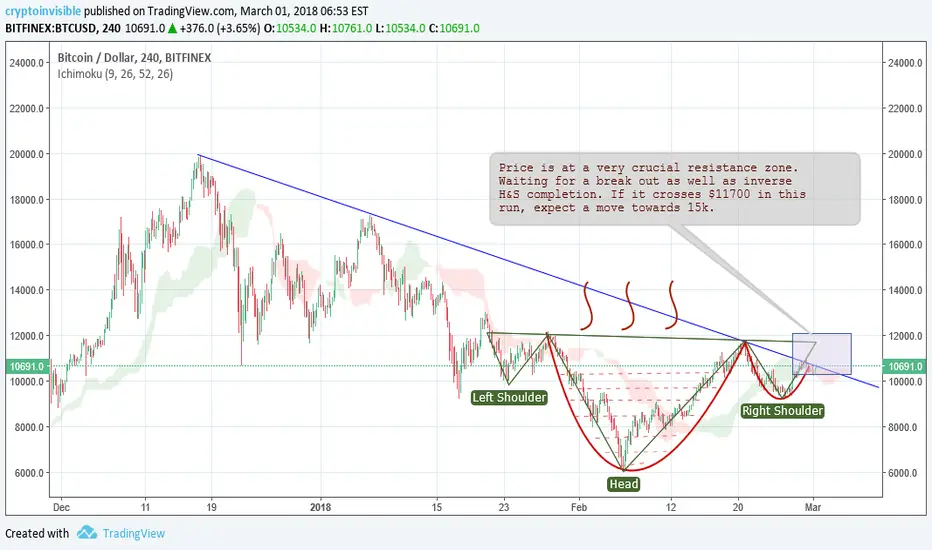
Indicators indicte a heavy bull run on its way(If H&S completes)$BTC has tried thrice to break out at around 11,200-11,700 zone in recent weeks and failed every time, it is trying once again and if it crosses 11700, which would ultimately create a break out as well as completion of inverse H&S pattern which might make it extra bullish.
Ichimoku, inverse H&S, cup&handle and MACD indicators look quite bullish,it needs some more volume to breach the resistance zone.
#DYOR
Indicators suggest coming uptrend RSI is at oversold levels, MACD is near a crossover, and the volume won't stay this low forever. All indicators suggest XLM is due for an uptrend. Happy trading!!

Indicators UpThere has been no new high yet but the indicators are pointing to the upside, so that a breakout may be expected.


possible long opportunity with CGEN stock + technical indicatorsprofit target at 6.60 USD. I suppose we have an HPS setup with the trend line divergences, the undersold stochastics indicator, the very much undersold relative strength index and the MACD line intersecting the signal line
It seems to me that it will bounce back off the support line one more time and possibly have a breakout over the resistance level. good luck to all. My personal opinion for this stock.

Indicators pick out the big tradeJust an example of how the Forex On Toast Sessions and ATRPlus indicators would have performed today on the big trade of the day.

Master Index: List of all my indicators ---------------------------------------------------------------------------------------------------------------------------------------
If you use any of these indicators regularly, appreciate a small donation :)
My Bitcoin address is : 1Cs5DJ7DGqYVBWaAt5rPuRcD66ULgVCFnx
My Amazon wishlist here : amzn.com
Ping me if would like other means of contributing to my tipjar.
---------------------------------------------------------------------------------------------------------------------------------------
Complete list of all my indicators in a Google Doc:
docs.google.com
*********************************************************************************************
******** NOTE: Below information is NOT complete and not updated anymore **
******** Please refer to the Google Doc above for all my latest indicators **
*********************************************************************************************
New indicators added: 18
Pointer to new indicators: www.tradingview.com
Total count: 142
New indicators added: 10
Pointer to new indicators: www.tradingview.com
Total count: 124
New indicators added: 7
Pointer to new indicators: www.tradingview.com
Total count: 114
New indicators added: 6
Pointer to new indicators: www.tradingview.com
Total count: 107
New indicators added: 6
List of indicators added: www.tradingview.com
Total count: 101
Reached 3 digits, yay!
New indicators added: 7
List of indicators added: www.tradingview.com
Total count: 95
New indicators added: 11
List of indicators added: www.tradingview.com
Total count: 88
New indicators added: 7
List of indicators added: www.tradingview.com
Total count: 77
List of indicators: www.tradingview.com
Description section does not allow me to list all indicators. So, I will be posting them in the comments. Total count : 70
Some of these indicators are my own concoctions, so very unique to TradingView.
Hope you find at least one that you like / makes you money :)
Feel free to PM me any new indicator requests.
This list is also available in Google docs: docs.google.com
--- LazyBear
-------------------------------------------------------------------------------------------------------------------------------
How to import / use custom indicators published by others (PDF):
drive.google.com
For the links with source on PasteBin, use this video (Thx @ChrisMoody) for importing the indicators:
blog.tradingview.com
Another walk-through on how to import / use indicators with sources posted on Pastebin (PDF):
drive.google.com
-------------------------------------------------------------------------------------------------------------------------------

EURUSD :: 24hr Directional PredictionSo this is my prediction, made by taking all the relevant facts and figures from several indicators as well as a simple BBands strategy.
(If your interested in this setup - I have made a script available which I posted yesterday I think it was.)
And now we wait......

NIFTY50 is looking Bullish
🤑 Nifty is likely to be Bullish till it's above 16990.
❓ Reason: Because Nifty is above the Trailing SL of ATM Machine Indicator on Hourly Chart.
🚧 Upside Hurdles: 18185, 18355, 18550.
🌈 Advice: 1.) Take reversal trade near these levels, or 2.) Wait for Breakout and Sustainability.
🟢 Positional Trend is Positive.
🔴 Long Term Trend is Negative.
📢 Disclaimer: We are NISM Certified so we don't hold any position in Nifty Future or Options as per SEBI guidelines. Take trades as per your own technical analysis, we are just educating you. We are not using any type of indicators for finding out of levels.
🙏🏻 Come to Learn, Go to Earn🙏🏻
✅ We are NISM Certified. ✅
☔If you find us useful, Please help the helpless near you.☔
☺Happy to Help.☺
Team OHO® Trading
✅NISM Certified
✅Government of India Registered Brand

Multi-Timeframe XGBoost Approximation Templatewww.tradingview.com
Template Name:XGBoost Approx
Core Idea: This strategy attempts to mimic the output of an XGBoost model (a powerful machine learning algorithm) by combining several common technical indicators with the Rate of Change (ROC) , MACD, RSI and EMA across multiple timeframes. It uses a weighted sum of normalized indicators to generate a "composite indicator," and trades based on this indicator crossing predefined thresholds. The multi-timeframe ROC acts as a trend filter.
Key Features and How They Work:
Multi-Timeframe Analysis (MTF): This is the heart of the strategy. It looks at the price action on three different timeframes:
Trading Timeframe (tradingTF): The timeframe you're actually placing trades on (e.g., 1-minute, 5-minute, 1-hour, etc.). You set this directly in the strategy's settings. This is the most important timeframe.
Lower Timeframe (selectedLTF): A timeframe lower than your trading timeframe. Used to catch early signs of trend changes. The script automatically selects an appropriate lower timeframe based on your trading timeframe. This is primarily used for a more sensitive ROC filter.
Current Timeframe (tradingTF): The strategy uses the current (trading) timeframe, to include it in the ROC filter.
Higher Timeframe (selectedHTF): A timeframe higher than your trading timeframe. Used to confirm the overall trend direction. The script automatically selects this, too. This is the "big picture" timeframe.
The script uses request.security to get data from these other timeframes. The lookahead=barmerge.lookahead_on part is important; it prevents the strategy from "peeking" into the future, which would make backtesting results unrealistic.
Indicators Used:
SMA (Simple Moving Average): Smooths out price data. The strategy calculates a normalized SMA, which essentially measures how far the current SMA is from its own average, in terms of standard deviations.
RSI (Relative Strength Index): An oscillator that measures the speed and change of price movements. Normalized similarly to the SMA.
MACD (Moving Average Convergence Divergence): A trend-following momentum indicator. The strategy uses the difference between the MACD line and its signal line, normalized.
ROC (Rate of Change): Measures the percentage change in price over a given period (defined by rocLength). This is the key indicator in this strategy, and it's used on all three timeframes.
Volume: The strategy considers the change in volume, also normalized. This can help identify strong moves (high volume confirming a price move).
Normalization: Each indicator is normalized. This is done by subtracting the indicator's average and dividing by its standard deviation. Normalization puts all the indicators on a similar scale (roughly between -3 and +3, most of the time), making it easier to combine them with weights.
Weights: The strategy uses weights (e.g., weightSMA, weightRSI, etc.) to determine how much influence each indicator has on the final "composite indicator." These weights are crucial for the strategy's performance. You can adjust them in the strategy's settings.
Composite Indicator: This is the weighted sum of all the normalized indicators. It's the strategy's main signal generator.
Thresholds: The buyThreshold and sellThreshold determine when the strategy enters a trade. When the composite indicator crosses above the buyThreshold, it's a potential buy signal. When it crosses below the sellThreshold, it's a potential sell signal.
Multi-Timeframe ROC Filter: The strategy uses a crucial filter based on the ROC on all selected timeframes. For a long trade, the ROC must be positive on all three timeframes (ltf_roc_long, ctf_roc_long, htf_roc_long must all be true). For a short trade, the ROC must be negative on all three timeframes. This is a strong trend filter.
Timeframe Filter Selection The script intelligently chooses filter timeframes (selectedLTF, selectedHTF) based on the tradingTF you select. This is done by the switch_filter_timeframes function:
Trading Timeframe (tradingTF) Lower Timeframe Filter (selectedLTF) Higher Timeframe Filter (selectedHTF)
1 minute 60 minutes (filterTF1) 60 minutes (filterTF1)
5 minute 240 minutes (filterTF2) 240 minutes (filterTF2)
15 minute 240 minutes (filterTF2) 240 minutes (filterTF2)
30 minute, 60 minute 1 Day (filterTF3) 1 Day (filterTF3)
240 minute (4 hour) 1 Week (filterTF4) 1 Week (filterTF4)
1 Day 1 Month (filterTF5) 1 Month (filterTF5)
1 Week 1 Month (filterTF5) 1 Month (filterTF5)
How to Use and Optimize the Strategy (Useful Hints):
Backtesting: Always start by backtesting on historical data. TradingView's Strategy Tester is your best friend here. Pay close attention to:
Net Profit: The most obvious metric.
Max Drawdown: The largest peak-to-trough decline during the backtest. This tells you how much you could potentially lose.
Profit Factor: Gross profit divided by gross loss. A value above 1 is desirable.
Win Rate: The percentage of winning trades.
Sharpe Ratio: Risk-adjusted return. A Sharpe Ratio above 1 is generally considered good.
**Sortino Ratio:**Similar to Sharpe but it only takes the standard deviation of the downside risk.
Timeframe Selection: Experiment with different tradingTF values. The strategy's performance will vary greatly depending on the timeframe. Consider the asset you're trading (e.g., volatile crypto vs. a stable stock index). The preconfigured filters are a good starting point.
Weight Optimization: This is where the real "tuning" happens. The default weights are just a starting point. Here's a systematic approach:
Start with the ROC Weights: Since this is a ROC-focused strategy, try adjusting weightROC_LTF, weightROC_CTF, and weightROC_HTF first. See if increasing or decreasing their influence improves results.
Adjust Other Weights: Then, experiment with weightSMA, weightRSI, weightMACD, and weightVolume. Try setting some weights to zero to see if simplifying the strategy helps.
Use TradingView's Optimization Feature: The Strategy Tester has an optimization feature (the little gear icon). You can tell it to test a range of values for each weight and see which combination performs best. Be very careful with optimization. It's easy to overfit to past data, which means the strategy will perform poorly in live trading.
Walk-Forward Optimization: A more robust form of optimization. Instead of optimizing on the entire dataset, you optimize on a smaller "in-sample" period, then test on a subsequent "out-of-sample" period. This helps prevent overfitting. TradingView doesn't have built-in walk-forward optimization, but you can do it manually.
Threshold Adjustment: Experiment with different buyThreshold and sellThreshold values. Making them more extreme (further from zero) will result in fewer trades, but potentially higher-quality signals.
Filter Control (useLTFFilter, useCTFFilter, useHTFFilter): These booleans allow you to enable or disable the ROC filters for each timeframe. You can use this to simplify the strategy or test the importance of each filter. For example, you could try disabling the lower timeframe filter (useLTFFilter = false) to see if it makes the strategy more robust.
Asset Selection: This strategy may perform better on some assets than others. Try it on different markets (stocks, forex, crypto, etc.) and different types of assets within those markets.
Risk Management:
pyramiding = 0: This prevents the strategy from adding to existing positions. This is generally a good idea for beginners.
default_qty_type = strategy.percent_of_equity and default_qty_value = 100: This means the strategy will risk 100% of your equity on each trade. This is extremely risky! Change this to a much smaller percentage, like 1 or 2. You should never risk your entire account on a single trade.
Save Trading
Always use a demo account first.
Use a small percentage of equity.
Use a stop-loss and take-profit orders.
Example Optimization Workflow:
Set tradingTF: Choose a timeframe, e.g., 15 (15 minutes).
Initial Backtest: Run a backtest with the default settings. Note the results.
Optimize ROC Weights: Use TradingView's optimization feature to test different values for weightROC_LTF, weightROC_CTF, and weightROC_HTF. Keep the other weights at their defaults for now.
Optimize Other Weights: Once you have a good set of ROC weights, optimize the other weights one at a time. For example, optimize weightSMA, then weightRSI, etc.
Adjust Thresholds: Experiment with different buyThreshold and sellThreshold values.
Out-of-Sample Testing: Take the best settings from your optimization and test them on a different period of historical data (data that wasn't used for optimization). This is crucial to check for overfitting.
Filter Testing: Systematically enable/disable the time frame filters (useLTFFilter, useCTFFilter, useHTFFilter) to see how each impacts performance.

with or withoutI like my Indicators, but only use indicators when you can make good trades without indicators... might sound strange but that is what i found out.
Also trading performance gets better when you can create you own indicators.

Bullish Gold: Recent Signals Point to Upward Momentum** Bullish Gold: Recent Signals Point to Upward Momentum **
Gold has been displaying strong bullish tendencies lately, and our latest analysis suggests that the price may continue its upward trajectory toward the next resistance level. After carefully analyzing the charts across multiple timeframes, from 1-minute to 45-minute intervals, we’ve identified compelling signals that favor a continuation of this upward movement.
**Key Observations**
1. **Technical Indicators:**
Recent price action shows a series of higher lows and consistent testing of key resistance zones. This structure aligns with a bullish trend, signaling strong buying pressure in the market.
2. **Momentum Analysis:**
Momentum indicators, such as the Relative Strength Index (RSI) and Moving Averages, confirm a positive trajectory. On smaller timeframes like 1-minute and 5-minute charts, gold has shown consistent breakouts during intraday trading, indicating sustained interest from buyers.
3. **Volume Support:**
Volume spikes during upward moves suggest institutional activity, further supporting the bullish case. Price movements are backed by strong participation, which enhances the reliability of the trend.
4. **Resistance and Next Targets:**
If gold maintains its current pace, the next key resistance level lies at . Breaking through this zone could open the door to higher price levels in the short term.
**Fundamental Context**
The recent strength in gold prices is supported by market uncertainty, with investors seeking safe-haven assets amidst global economic concerns. Additionally, a weaker USD or dovish signals from central banks can further fuel gold’s rally.
**What’s Next?**
We’ll continue to monitor the charts and provide updates as the situation evolves. The current bullish sentiment aligns with both technical and fundamental factors, suggesting that gold’s rally still has room to grow. However, traders should watch for any signs of reversal near key resistance levels and manage their risk accordingly.
Stay tuned for more updates as we track this movement closely!

TV 4 - 3 indicatorsTV 4 TV 4 - 3 indicatorsTV 4 - 3 indicatorsTV 4 - 3 indicatorsTV 4 - 3 indicators
