MICROSOFT STOCK PREDICTIONS FOR 2016 AND 20172016/11/18. Microsoft stock forecast for next months and years.
Microsoft stock price predictions for November 2016.
The forecast for beginning of November 58. Maximum value 61, while minimum 54. Averaged Microsoft stock price for month 58. Price at the end 57, change for November -1.72%.
Microsoft stock predictions for December 2016.
The forecast for beginning of December 57. Maximum value 59, while minimum 53. Averaged Microsoft stock price for month 56. Price at the end 56, change for December -1.75%.
Microsoft stock price predictions for January 2017.
The forecast for beginning of January 56. Maximum value 59, while minimum 53. Averaged Microsoft stock price for month 56. Price at the end 56, change for January 0.00%.
Microsoft stock predictions for February 2017.
The forecast for beginning of February 56. Maximum value 60, while minimum 54. Averaged Microsoft stock price for month 57. Price at the end 57, change for February 1.79%.
Microsoft stock price predictions for March 2017.
The forecast for beginning of March 57. Maximum value 64, while minimum 56. Averaged Microsoft stock price for month 59. Price at the end 60, change for March 5.26%.
Microsoft stock predictions for April 2017.
The forecast for beginning of April 60. Maximum value 61, while minimum 55. Averaged Microsoft stock price for month 59. Price at the end 58, change for April -3.33%.
Microsoft stock price predictions for May 2017.
The forecast for beginning of May 58. Maximum value 65, while minimum 57. Averaged Microsoft stock price for month 60. Price at the end 61, change for May 5.17%.
Microsoft stock predictions for June 2017.
The forecast for beginning of June 61. Maximum value 61, while minimum 55. Averaged Microsoft stock price for month 59. Price at the end 58, change for June -4.92%.
Microsoft stock price predictions for July 2017.
The forecast for beginning of July 58. Maximum value 65, while minimum 57. Averaged Microsoft stock price for month 60. Price at the end 61, change for July 5.17%.
Microsoft stock predictions for August 2017.
The forecast for beginning of August 61. Maximum value 61, while minimum 55. Averaged Microsoft stock price for month 59. Price at the end 58, change for August -4.92%.
Microsoft stock price predictions for September 2017.
The forecast for beginning of September 58. Maximum value 61, while minimum 55. Averaged Microsoft stock price for month 58. Price at the end 58, change for September 0.00%.
Microsoft stock predictions for October 2017.
The forecast for beginning of October 58. Maximum value 63, while minimum 55. Averaged Microsoft stock price for month 59. Price at the end 59, change for October 1.72%.
Microsoft stock price predictions for November 2017.
The forecast for beginning of November 59. Maximum value 65, while minimum 57. Averaged Microsoft stock price for month 61. Price at the end 61, change for November 3.39%.
Microsoft stock predictions for December 2017.
The forecast for beginning of December 61. Maximum value 68, while minimum 60. Averaged Microsoft stock price for month 63. Price at the end 64, change for December 4.92%.
Microsoft stock price predictions for January 2018.
The forecast for beginning of January 64. Maximum value 69, while minimum 61. Averaged Microsoft stock price for month 65. Price at the end 65, change for January 1.56%.
BLUE CHANNEL- Monthly and Weekly UP
Double Lines- Peak of .com bubble and All-Time High from 1999/2000 *Broken
Search in ideas for "MICROSOFT"

Microsoft's Remarkable Ascent in AI: A Key to its 40% YTD Stock Microsoft's Remarkable Ascent in AI: A Key to its 40% YTD Stock Surge
Microsoft's stock has experienced an impressive 40% year-to-date surge, driven significantly by its dominant position in the realm of artificial intelligence (AI). With its early investments in AI, Microsoft has gained a substantial lead over its competitors. Companies like Amazon and Alphabet have been playing catch-up in the first half of the year, striving to match Microsoft's strides in the AI arena.
However, Microsoft's strength extends beyond AI, as it boasts a portfolio of high-performing productivity services with millions of users worldwide. This strong brand recognition and extensive user base position Microsoft as a potential go-to choice for anyone seeking AI services. Here are three key insights that savvy investors are aware of regarding Microsoft's current standing:
Charting a Course Towards $10 Billion in AI Revenue:
During the recent Goldman Sachs Communacopia & Technology Conference, Microsoft's Chief Financial Officer, Amy Hood, reaffirmed the company's ambitious projection: the AI division is poised to surge past the $10 billion revenue milestone at an unprecedented pace, surpassing all previous business endeavors.
Microsoft's strategic investment of $1 billion in the ChatGPT developer, OpenAI, in 2019, has been instrumental in catalyzing its ascendancy in the AI realm. This partnership has granted Microsoft exclusive licenses to numerous OpenAI AI models, leading to transformative enhancements across various in-house platforms. Iconic products like Word, Excel, Bing, and Azure have all undergone substantial AI-driven upgrades. Furthermore, Microsoft's subscription-based Microsoft 365 office suite is on the brink of introducing an array of AI-infused products, ushering in a new era of productivity.
The transformative potential of AI extends across various industries, including education, healthcare, consumer goods, robotics, autonomous vehicles, and more. Persuading businesses to integrate AI tools into their daily operations holds great promise, and Microsoft is well-positioned to capitalize on this trend.
With a commanding presence through its cloud platform, Azure, and an extensive suite of productivity tools, Microsoft is poised to become the preferred destination for enterprises seeking AI services to enhance operational efficiency. The combination of iconic brands—Windows, Office, and Azure—may give Microsoft an edge over formidable rivals like Amazon in the AI-driven landscape.
Strategic Investment in the Semiconductor Arena:
Microsoft's deep involvement in semiconductor technology lays a strong foundation for the long-term growth of the AI market. Recognizing the importance of robust hardware in the AI industry, Microsoft has made steady investments in various chip manufacturers to diversify the ecosystem, which has long been dominated by Nvidia.
Earlier this year, Bloomberg reported Microsoft's substantial financial and engineering support for Advanced Micro Devices (AMD) in its AI chip expansion efforts. This month, the chip startup d-Matrix secured $110 million in funding, with Microsoft among its prominent backers.
D-Matrix focuses on the "inference" facet of AI processing, avoiding direct competition with Nvidia in training large AI models. Microsoft's investment strategy here represents strategic diversification, aligning with a distinct segment of the chip market, separate from its engagements with AMD and Nvidia.
While d-Matrix's 2023 revenue projection is around $10 million, primarily from chip testing, it anticipates substantial growth as demand for AI chips rises. The company targets annual revenues ranging from $70 million to $75 million within the next two years.
Sustained Dividend Growth:
Unlike tech giants like Amazon and Alphabet, which have forgone dividend offerings, Microsoft has remained a dividend-friendly player, positioning itself at the forefront of the market. The company boasts a dividend yield of 0.81%, a notable figure compared to Apple's 0.53%.
What truly underscores Microsoft's appeal to dividend-seeking investors is its consistent upward trajectory in dividend yield over the past decade. Microsoft's cash dividend has grown from $0.28 in 2013 to an impressive $0.68 this year. As Microsoft expands its presence in the AI landscape, which is projected to sustain a robust compound annual growth rate of 32% until 2030, the potential for amplified earnings augments the possibility of further dividend increases.
While Microsoft's dividend yield may not rival that of industry peers like Verizon, which offers a substantial yield of approximately 7%, the company's unwavering commitment to growth solidifies its status as an attractive investment proposition, making its stock increasingly compelling.
In conclusion, Microsoft's strategic positioning in the AI industry, its investments in the semiconductor sector, and its consistent dividend growth make it a standout choice for investors seeking long-term value and potential growth in their portfolios.

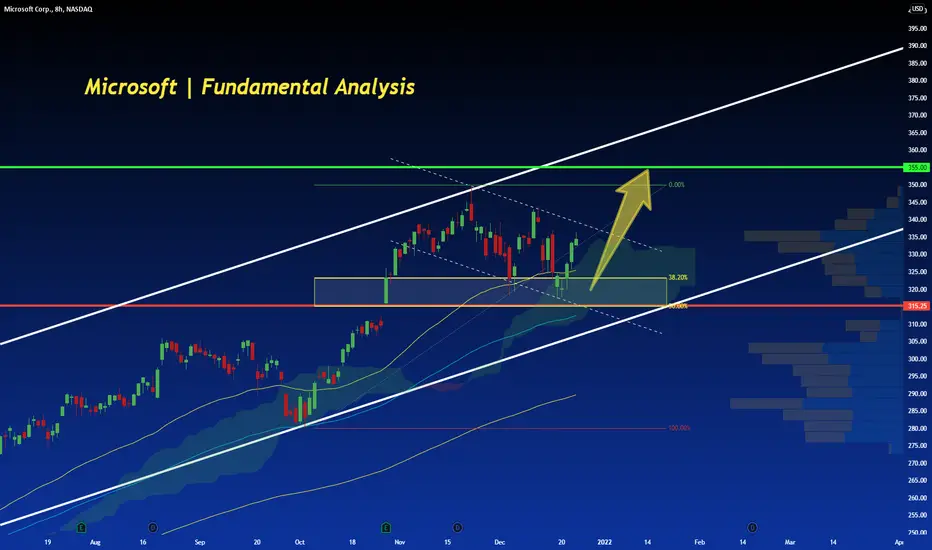
Microsoft | Fundamental Analysis | MUST READ | LONG SETUP ⚡️The market was on the upswing yesterday as receding fears of Omicron strain and renewed expectancy for the "Build Back Better" bill led to significant gains in stocks. Amid all the exciting moves in battered cyclical stocks and small-cap stocks, another important story -- actually, two stories -- surrounding technology star Microsoft may have slipped past your attention. These headlines were not only important in and of themselves, but also in terms of what they connote for Microsoft's growth prospects.
Two days ago, the European Commission approved Microsoft's upcoming deal with Nuance Communications. Microsoft announced a $16 billion deal with Nuance back in April, but its prospects have never been entirely certain. Microsoft is a large and powerful technology company, which means antitrust concerns are always a danger to any deal -- especially a big one. The Nuance deal is the second-largest for Microsoft after its 2016 acquisition of LinkedIn.
But Microsoft seems to know what it's doing when it targets a company. That wasn't evident last year when executives of most FAANG stocks had to testify before Congress about their market power. And Europe has been particularly tough on big tech companies in recent years, even tougher than the U.S.
Nevertheless, the commission concluded that the Nuance acquisition would not significantly reduce competition in artificial intelligence (AI) in health care. Now that the merger is set to take place, Nuance's AI capabilities are expected to strengthen Microsoft's already strong cloud-based healthcare services.
During the merger, CEO Satya Nadella said: "Nuance provides a level of AI at the point of care and is a pioneer in the real-world application of enterprise AI. AI is a critical technology priority, and healthcare is its most relevant application. Together with our partner ecosystem, we will put advanced AI solutions in the hands of professionals everywhere to drive better decisions and create more meaningful connections, accelerating the growth of Microsoft Cloud for Healthcare and Nuance."
Over the past two years, Microsoft has managed to maintain outstanding cloud growth through the introduction of industry clouds. It looks like Nuance will fill some of the gaps in Microsoft's healthcare capabilities.
With the ability to still make large and meaningful acquisitions, MSFT seems to have an advantage over some competitors who seem to be attracting more antitrust attention for some reason. This ability may let it support growth longer than skeptics believe.
Following this good news, Microsoft wasted no time in announcing another acquisition. This time Microsoft will acquire digital advertising technology company Xandr from AT&T. Xandr is the result of a merger of AT&T's own digital advertising capabilities with AppNexus, the programmatic advertising company it acquired for $1.6 billion in 2018.
AT&T had hoped to turn Xandr into a powerful programmatic advertising company, but apparently, the scale wasn't enough to justify keeping it. AT&T has recently sought to sell non-core assets to pay down debt in anticipation of the spin-off and merger of WarnerMedia with Discovery. The terms of the deal have not been disclosed, so we don't know how much Microsoft will pay.
Microsoft will likely try to merge Xandr with Bing, its second-ranked search engine, to create better programmatic and artificial intelligence-driven advertising capabilities. Bing is often something of secondary consideration for Microsoft investors, but it's not worth telling management. Microsoft seems intent on developing its digital advertising capabilities to compete with the dominant "walled gardens" of digital advertising, especially since privacy restrictions could open up competitive opportunities.
While many are willing to settle for Microsoft's enterprise software alone, the tenacity to push into other areas of growth is admirable and is music to the ears of this happy shareholder. If there is any danger of over-diversifying the business away from core capabilities, as AT&T has done, it has not manifested itself in Microsoft's financial performance.
After rising 43% over the past 12 months, marking another successful year for the market, and finding itself just below historic highs at $327 per share, Microsoft may have investors wondering if the company can continue that streak. After all, it's harder to grow fast the bigger you get.
However, people said this a few years ago about Microsoft when the stock price was still in double digits. Earnings in several of the company's core businesses remain strong, and these two new acquisitions demonstrate management's tenacity in pursuing growth across an impressive portfolio.
MICROSOFT'S Fiscal 2023 Q4 Results: Assessing Growth and....Microsoft's Fiscal 2023 Q4 Results: Assessing Growth and Profitability
Investors are eagerly anticipating Microsoft's fiscal 2023 fourth-quarter results, set to be unveiled on July 25. The upcoming report holds significance as it is expected to include the company's outlook for fiscal year 2024, making it a crucial event for evaluating Microsoft's growth opportunities, profitability, and cash demand trends.
When considering Microsoft as an investment, three key factors set it apart from others.
Diverse Business:
Microsoft's strength lies in its diverse business offerings. Unlike companies that focus on specific industries or technologies, Microsoft provides exposure to various growth niches, including enterprise cloud services, AI, productivity software, and more. Owning Microsoft allows investors to capitalize on multiple expansion opportunities under one brand, thereby reducing the risks associated with heavy reliance on a single sector.
High Profitability:
Despite some fluctuations in financial metrics since the peak of the pandemic in 2021 and early 2022, Microsoft remains one of the most efficient generators of cash and profits in the market. In the last quarter, the company achieved an impressive 15% year-over-year increase in operating income, resulting in $22.4 billion in profit on $53 billion in sales. This high level of profitability reinforces Microsoft's position as a robust and stable investment option.
As the report is released, investors should focus on these essential growth indicators and look beyond short-term sales volatility to assess Microsoft's long-term potential. The company's diverse business and strong profitability make it an attractive investment opportunity for those seeking stability and growth in their portfolio.
Pricey Stock:
In terms of valuation, Microsoft is considered a pricey stock, with investors having to pay a premium for its valuable assets. Presently, Microsoft stock is valued at over 12 times its annual sales, comparable to the faster-growing Palo Alto Networks. However, in comparison, Apple offers a relatively better bargain with a valuation of 8 times its sales, while Amazon is even cheaper at less than 3 times its sales.
While there is a possibility that Microsoft's valuation may decrease in the coming quarters, particularly if the company reports disappointing sales results in late July or forecasts challenges in the upcoming operational year, the more likely scenario is that the business will continue to gain market share in various significant global tech industries. Additionally, any cyclical downturn in its operating system segment or consumer tech devices division is expected to be short-lived.
Considering Microsoft's bright long-term outlook, industry-leading profit margins, ample cash flow, and rising dividend payments, it emerges as an incredibly attractive stock to consider adding to your portfolio. For tech stock investors who prefer a less risky approach in a fast-moving industry, Microsoft provides an excellent opportunity to gain exposure to major trends while investing in one of the most valuable companies in the world.

Microsoft | Fundamental Analysis | SHORTOn Tuesday, Microsoft announced its intention to acquire video game giant Activision Blizzard in a deal worth $75 billion, or $68.7 billion based on Activision's net cash position. That corresponds to a price of $95 a share, up from Activision's share price of $65 last Friday, but still below Activision's 52-week high of $104.53.
If the deal passes antitrust scrutiny, it could be a clever move. In fact, the deal is reminiscent of Warren Buffett's approach to value investing at his Berkshire Hathaway conglomerate. Given Buffett's close friendship with former Microsoft chairman Bill Gates, it is not surprising that Microsoft is making reasonable acquisitions at reasonable prices during its mature growth phase.
Activision Blizzard has a leading portfolio of video game franchises, including Call of Duty, Candy Crush, Overwatch, and many others. With such a high market capitalization, it is one of the world's largest pure-play video game developers, ranking fifth in total game revenue worldwide.
Recently, however, the company found itself "on the operating table," so to speak. Last summer, California regulators filed a lawsuit against Activision, accusing it of widespread sexual harassment and gender pay inequality. In November, about a fifth of Activision's employees signed a petition urging CEO Bobby Kotick, who has led the company for more than 30 years, to leave. Although the company has taken various steps to correct apparent misconduct, including firing or disciplining more than 80 employees and altering some internal rules, Activision stock has not recovered and is down more than 35 percent from its February 2021 highs.
Although Microsoft is paying a substantial premium to last week's market price, the valuation is about 25 times this year's average earnings estimate of $3.80. If you pay attention to Activision's net cash position, the valuation drops to about 23. That's a pretty reasonable price for Activision's "drama-free," given the strength of its franchises and the way it has traded in the past.
Even if Microsoft gets a reasonable price for a separate Activision, Activision could be even more profitable in Microsoft's hands than as an independent company.
Given the turmoil in Activision's management, The Wall Street Journal reported that Kotick is likely to leave his post after the deal closes. Thus, new leadership and a culture change at Activision itself could help bring key talent and reinvigorate the business after the current employee crisis.
And just as streaming video platforms are spending heavily on their own content, video games, too, are moving to a subscription-based streaming package model. CEO Satya Nadella has doubled down on spending on native content for Microsoft's Game Pass, which Microsoft said in a press release reached more than 25 million subscribers, up from 18 million in early 2021. Activision itself has 400 million monthly active players, so it's reasonable to assume that some of those users will switch to Game Pass, which Microsoft promotes as "Netflix for gaming."
Finally, in an interview with CNBC on Tuesday, Kotick said that as games increasingly move into the metaverse, gaming companies will need technology expertise that Activision may not have, and it will probably be difficult to attract from the big tech companies -- especially given recent employee problems. Therefore, it does make sense to sell the company to a large tech giant with a variety of technology expertise. Microsoft, of course, has such expertise in abundance, thanks to its Azure cloud platform, Xbox gaming platform, and Hololens AR/VR headset.
While the ZeniMax acquisition went off without a hitch, Microsoft may be pushing the limits of its acquisition capabilities with this deal, given Activision's sheer size. At the time of writing, Activision's stock was only trading to the $82 mark, which leaves a lot of room below the $95 acquisition price. This seems to indicate a certain amount of skepticism about completing the deal.
Microsoft has been very good at avoiding antitrust regulators in Washington, who are instead mostly going after other FAANG stocks, particularly those related to social media. However, Microsoft is also not done with two other noteworthy acquisitions in the process in medical AI and advertising technology. Given the speed and size of the new deals, Microsoft could face a lot of resistance to buying Activision.
Nevertheless, if the deal goes through, it's a huge win and terrific use of the enormous $130 billion cash pile on Microsoft's balance sheet. Microsoft is doing great in the cloud computing and enterprise software markets, and that business alone would be enough for management to rest on its laurels. But to see management working hard to grow its consumer-oriented businesses -- search advertising and video games -- is refreshing. First-rate capital allocation and relentless pursuit of growth is another reason Microsoft deserves its high praise.

Microsoft (MSFT): The "Can’t Go Wrong" Stock... Until It DoesAh, Microsoft—the tech titan that could probably survive a meteor impact. 🌍☄️ With a market cap so large it could buy entire countries and still have spare change for a few yachts, MSFT is the stock that everyone loves... even when it’s overvalued. But hey, let’s take a look at the "genius" behind the current price action. 🔍💰
📊 The Almighty Stock Performance (Because Fundamentals Don’t Matter Anymore?)
📉 Price: $385.76 (up a whole 0.00584%! Call the champagne guy! 🍾)
📊 Intraday High: $387.88
📉 Intraday Low: $383.27 (because even Microsoft has bad days, right? 😅)
🔮 200-day moving average: $423.98 (oh look, it's trading below that... bearish much? 🐻)
So, let me get this straight. MSFT is 7.80% down year-to-date, but analysts are still screaming “BUY! 🚀.” Sure, because blindly trusting price targets has always worked out well for retail investors. 🤑
💰 Valuation: Overpriced? Who Cares, It’s Microsoft!
📢 Intrinsic Value Estimate: $316.34
😬 Current Price: $385.76
💰 Overvaluation? About 18%
But let’s be honest—does valuation even matter anymore? If people are throwing money at meme coins, why not pay a premium for MSFT? 🤷♂️ It’s basically a subscription service at this point—you pay every month, and the stock just keeps draining your wallet. 💸
🤖 AI Goldmine or Just Another Buzzword?
Microsoft has been riding the AI hype train harder than a teenager with ChatGPT. 🚂💨 Their enterprise AI growth is over 100%, and they’re pulling in a $13 billion annual run rate from AI services. But sure, let’s pretend that no one remembers the last time “the next big thing” crashed and burned. (cough dot-com bubble cough). 💀💾
Evercore analysts claim MSFT will dominate AI for enterprises. Well, duh. If you’re an enterprise and don’t buy Microsoft AI services, Satya Nadella himself might show up at your office and force you to install Windows 11. 🏢💻
📉 Risk Factors? No Way! MSFT is Invincible... Right?
🦅 Hawkish Fed = Potential Market Sell-Off (But don’t worry, just HODL, right? 🤡)
🚀 Tech Bubble Concerns (Microsoft will totally be the exception… like every overhyped stock before it. 😬)
🧐 Overvaluation? Pfft, who cares? (People said the same about Tesla at $400. Look how that turned out. 🪦)
📢 Analyst Hot Takes (Because They’re Always Right 😂)
📊 D.A. Davidson: Upgraded to Buy with a price target of $450. (Ah yes, let’s just throw numbers out there. Why not $500? $600? 🚀)
🔮 UBS: Predicts $3,200 for gold, but Microsoft will somehow go even higher. (Probably. Because… reasons. 🤷♂️)
🎭 Final Thoughts: Buy? Sell? Just Panic?
Microsoft is basically the “safe” tech stock everyone clings to while pretending that the market isn’t built on dreams and overleveraged hedge funds. 🏦💰 If you believe in the power of monopolies, overpriced AI services, and analysts pulling price targets out of thin air, then MSFT is your golden ticket. 🎟️💎
Otherwise, maybe—just maybe—waiting for a dip below fair value isn’t the worst idea in the world. But what do I know? I’m just some guy on the internet. 🤷♂️
🚀💸 Good luck, traders. You’ll need it. 😈📉
💬 What do you think? Drop your thoughts below! 👇🔥

Microsoft & Estee Lauder Company Join Forces to Bolster AI TechThe Estée Lauder Companies (ELC) and tech giant Microsoft ( NASDAQ:MSFT ) have unveiled a pioneering collaboration, heralding a new era of innovation and consumer engagement. This strategic partnership aims to harness the transformative power of generative AI to revolutionize product development, marketing strategies, and customer experiences across ELC's esteemed portfolio of over 20 prestige beauty brands.
Empowering Beauty with AI
At the heart of this collaboration lies the establishment of an AI Innovation Lab, a dynamic hub where cutting-edge generative AI capabilities, fueled by Microsoft's Azure OpenAI Service, will be unleashed to drive unparalleled advancements in beauty. By leveraging AI technologies, ELC seeks to forge deeper connections with consumers, anticipate trends with agility, and deliver products tailored to local preferences with unprecedented speed and relevance.
Accelerating Consumer-Centric Solutions
One of the most exciting prospects of this collaboration is the development of an internal generative AI chatbot, engineered to enhance marketing effectiveness on a global scale. This innovative tool harnesses advanced conversational AI to navigate ELC's vast reservoir of product and claim data swiftly, enabling brands to launch locally relevant campaigns at an accelerated pace. By deciphering social trends and consumer demands in real-time, ELC aims to cultivate more personalized experiences that resonate with modern beauty enthusiasts.
Redefining Product Innovation
Furthermore, ELC and Microsoft ( NASDAQ:MSFT ) are spearheading efforts to revolutionize product innovation through the integration of generative AI tools into research and development processes. By leveraging AI-driven insights, scientists and product development specialists can swiftly respond to emerging trends and consumer preferences, expediting the creation of cutting-edge beauty solutions. This collaborative approach not only accelerates time-to-market but also fosters a culture of agility and innovation within ELC's renowned laboratories.
A Testament to Partnership
Jane Lauder, EVP of Enterprise Marketing and chief data officer at The Estée Lauder Companies, underscores the pivotal role of technology in amplifying the company's core strengths of quality products and immersive consumer experiences. By harnessing Microsoft's generative AI tools and expertise, ELC aims to unlock the full potential of its extensive data ecosystem, paving the way for enhanced consumer engagement and actionable insights.
Shelley Bransten, corporate vice president of Global Industry Solutions at Microsoft, echoes this sentiment, emphasizing the transformative impact of generative AI on the beauty landscape. Through close collaboration with ELC, Microsoft is committed to not only providing a platform for AI innovation but also nurturing deep partnerships to translate groundbreaking innovations into tangible realities.
A Legacy of Innovation
This visionary collaboration marks a significant milestone in the enduring partnership between ELC and Microsoft ( NASDAQ:MSFT ), which first took flight in 2017. From the groundbreaking Voice-Enabled Makeup Assistant, empowering visually impaired users to confidently apply makeup, to the latest AI Innovation Lab, this partnership exemplifies a shared commitment to pushing the boundaries of innovation and inclusivity in the beauty industry.
As the AI-powered beauty revolution unfolds, consumers can anticipate a future where personalized experiences, sustainable practices, and cutting-edge products converge to redefine the essence of prestige beauty. With ELC and Microsoft ( NASDAQ:MSFT ) leading the charge, the future of beauty has never looked more radiant or promising.

MICROSOFT 460 BY 2025 ?TOP 3 REASONS WHY !!
Earnings Growth: One of the most important factors for any growth Astock is earnings growth1. Microsoft has a historical EPS growth rate of 21.3%, and it’s projected to grow 13.2% this year, outpacing the industry average. This consistent and robust earnings growth is a strong indicator of the company’s financial health and future prospects, which could drive its stock price higher.
Cloud Services: Microsoft Azure, the company’s cloud platform, has been a significant driver of growth. Demand for cloud infrastructure services is higher than ever, as organizations seek digital solutions in a post-COVID-19 world. With Azure’s revenue increasing by 48%, it’s expected to exceed both Office and Windows in annual revenue by next year. This growth in the cloud sector represents a massive opportunity for Microsoft and could be a major factor in boosting its stock price.
Productivity and Gaming: Microsoft’s productivity and business processes segment, which includes Office 365, has shown solid results with consistent revenue growth. The transition of Office to a subscription service has been beneficial for Microsoft’s core software business2. Additionally, the gaming sector, particularly Xbox, is another area where Microsoft is seeing significant growth2. With the successful launch of the Xbox Series X and Series S, and the rapid growth of the Xbox Game Pass subscription service, the future looks bright for Microsoft’s gaming business.

What Fuels Microsoft's Unstoppable Rise?Microsoft Corporation consistently demonstrates its market leadership, evidenced by its substantial valuation and strategic maneuvers in the artificial intelligence sector. The company's proactive approach to AI, particularly through its Azure cloud platform, positions it as a central hub for innovation. Azure now hosts a diverse array of leading AI models, including xAI’s Grok, alongside offerings from OpenAI and other industry players. This inclusive strategy, driven by CEO Satya Nadella's vision, aims to establish Azure as the definitive platform for emerging AI technologies, offering robust Service Level Agreements and direct billing for hosted models.
Microsoft's AI integration extends deeply into its product ecosystem, significantly enhancing enterprise productivity and developer capabilities. GitHub's new AI coding agent streamlines software development by automating routine tasks, allowing programmers to focus on complex challenges. Furthermore, Microsoft Dataverse is evolving into a powerful, secure platform for AI agents, leveraging features like prompt columns and the Model Context Protocol (MCP) server to transform structured data into dynamic, queryable knowledge. The seamless integration of Dynamics 365 data within Microsoft 365 Copilot further unifies business intelligence, enabling users to access comprehensive insights without switching contexts.
Beyond its core software offerings, Microsoft's Azure cloud provides critical infrastructure for transformative projects in highly regulated sectors. The UK's Met Office, for instance, successfully transitioned its supercomputing operations to Azure, improving weather forecasting accuracy and advancing climate research. Similarly, Finnish startup Gosta Labs utilizes Azure's secure and compliant environment to develop AI solutions that automate patient record-keeping, significantly reducing administrative burdens in healthcare. These strategic partnerships and technological advancements underscore Microsoft's foundational role in driving innovation across diverse industries, cementing its position as a dominant force in the global technology landscape.

Microsoft’s $69 Billion Activision Blizzard cleared by Britain LONDON - Britain finally cleared Microsoft (NASDAQ:MSFT)'s $69 billion acquisition of Activision Blizzard (NASDAQ:ATVI) on Friday after it forced the Xbox owner to sell the steaming rights to games including "Call of Duty" to address its competition concerns.
The deal was blocked in April by the Competition and Markets Authority (CMA) which said it could give the U.S. computing giant a stranglehold over the nascent cloud gaming market.
But the regulator ripped up its play book by reopening the case after Microsoft agreed to sell the streaming rights to Activision's games to Ubisoft Entertainment, with remedies to ensure the terms were enforceable.
The deal was the biggest test of the CMA's global power to take on the tech giants since Britain left the European Union.
It said "sticking to its guns" in the face of criticism from the merging companies had delivered an outcome that was better for competition, consumers and economic growth.
The approval paves the way for Microsoft to close the deal by Oct. 18 after it extended the deadline to secure UK approval.
The CMA said Microsoft's concession on streaming was a "gamechanger", adding that it was the only competition agency globally to have delivered this outcome.
The new deal will stop Microsoft from locking up competition in cloud gaming as this market takes off, preserving competitive prices and services for UK cloud gaming customers," it said in a statement.
Microsoft announced the deal in early 2022, aiming to boost its growth in console, mobile, PC, and cloud gaming to compete with the likes of Tencent as well as PlayStation-owner Sony (NYSE:SONY).
The U.S. Federal Trade Commission opposed the deal but after failing to stop it, the CMA was left standing alone.

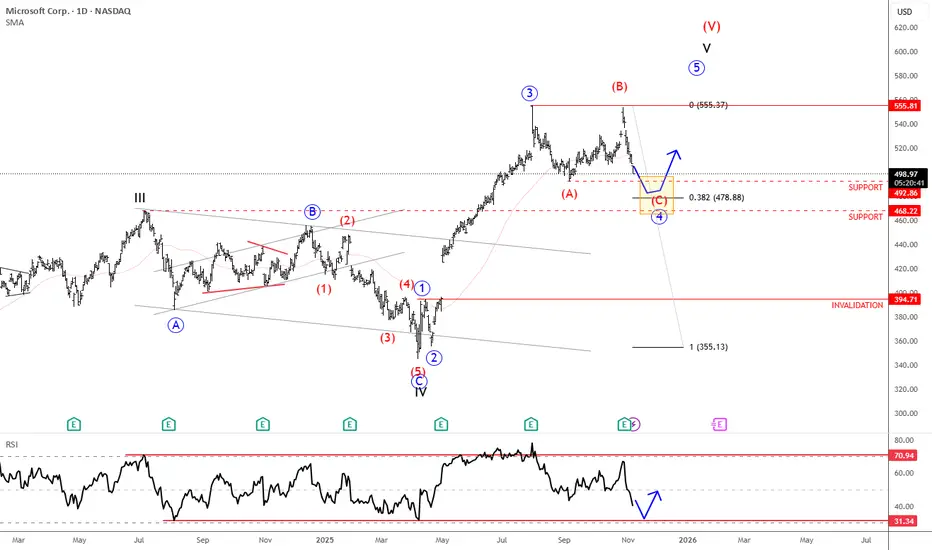
Microsoft Is Finishing Wave 4 CorrectionMicrosoft is in a wave 4 correction, and once it's fully completed, it can extend the rally within wave 5 from a technical point of view and according to Elliott wave theory.
Microsoft is a global technology company founded by Bill Gates and Paul Allen in 1975. It’s best known for its Windows operating system, Microsoft Office suite, and cloud platform Azure. Over the years, Microsoft has expanded into gaming (with Xbox), professional networking (LinkedIn), and AI (through partnerships like OpenAI). Today, it’s one of the world’s most valuable and influential companies, shaping software, hardware, and cloud computing industries.
Microsoft reported earnings last Wednesday after the close, with the price turning lower after reaching new highs. The structure still appears to be a wave four in progress — a flat correction where the current drop likely represents wave C. Wave C often stabilizes near wave A levels, suggesting support around 492 and 468 (the former 2024 high). Holding this zone could set up the next rebound into the final higher-degree wave five.
Highlights:
Trend: Corrective phase, wave C of flat in progress
Potential: Rebound toward new highs once support holds
Support: 492 / 468
Invalidation: Below 394
Note: Watch for stabilization at support before potential wave five continuation
Microsoft (MSFT): Decision Point – Will It Hold or Drop?Since our last analysis on Microsoft, not much has changed in terms of price action, as it rose to $469 before getting stuck again at $416. However, there is one major development – Microsoft has formed a new trend channel. We have marked this crucial channel in red and labeled it "Must hold for more upside," emphasizing its importance. A major decision is approaching for $MSFT.
Either Microsoft holds this channel, leading to a surge higher, or it loses this level, which would confirm the bearish head and shoulder pattern. We've maintained a bearish outlook on Microsoft since January 2024, and recent developments seem to support our analysis. For now, we're patiently waiting and letting the market decide.
If Microsoft loses the channel, we could find initial support for wave (A) around $316-306. However, a better buying opportunity for wave II may present itself closer to $220 – though reaching this level will take some time. 🫡

Microsoft (MSFT) Stock Hits a 4.5-Month HighMicrosoft (MSFT) Stock Hits a 4.5-Month High
On 31 October, our analysis of Microsoft (MSFT) stock highlighted:
→ The price is forming a long-term upward channel, illustrated in blue.
→ The channel’s lower boundary serves as a significant support level.
On Friday, MSFT stock climbed to $445, its highest level since mid-July, buoyed by news that OpenAI may grant Microsoft access to key AI-related technologies.
Will the Price Continue to Rise?
There are reasons to suspect that the bullish momentum may not sustain.
Technical analysis of MSFT’s chart today suggests:
→ The price is near the median of the long-term channel, and this median could act as resistance. This is hinted at by the long upper shadows on Thursday and Friday’s candles.
→ The emerging bullish breakout above the September high around $441 might prove to be a false breakout, similar to the false bearish breakout of early October support near $408 (highlighted with arrows).
Additionally, Microsoft’s stock has underperformed compared to market indices, which are at historic highs. This could mean the price may retrace to $430 or lower, aligning more closely with average autumn levels.
Analysts, however, remain optimistic about MSFT’s prospects. According to TipRanks:
→ 26 out of 29 analysts recommend buying MSFT stock.
→ The average 12-month price target for MSFT is $497.
This article represents the opinion of the Companies operating under the FXOpen brand only. It is not to be construed as an offer, solicitation, or recommendation with respect to products and services provided by the Companies operating under the FXOpen brand, nor is it to be considered financial advice.

Microsoft - Is The Top Already In?One of the key points to Microsoft is it is, in essence, a U.S. state-backed corporation, and one that is trading at more than $2.5 trillion market cap at present.
You're looking at a company that just set a new all time high while the overall market is not healthy and the macroeconomic fundamentals are actually bearish.
And so, we have to seriously ask ourselves if it's time to short God the top.
Microsoft's price action on the monthly is curious.
The price action is healthy and natural all the way from where it bounces to the top, and only becomes curiously strange when it gets to the top.
Why does a stock that bounces at the right place and forms a fully proper reversal pattern, which we see on the weekly:
Only sweep the All Time High?
Why doesn't it raid the ATH and run bigly larger like NVDIA did?
Well, the answer is actually quite clear when you overlay NVDA to MSFT:
In essence, NVDA at $480-450 is MSFT at $350. The difference in price action you see today is because NVDA was relatively weaker in the past, meaning MSFT was inordinately strong in the past.
Anything that reaches an extreme will reverse. If it reaches the extreme twice, it will reverse hard twice.
The geopolitical situation in the world is not healthy. There is a ton of sabre rattling between NATO and the Nation of China at the moment.
The western propaganda machine wants you to believe that Xi Jinping intends to invade Taiwan because he's very evil very super Mao Zedong++, but in reality it's more like the "International Rules Based Order" wants to use the fact that the Chinese Communist Party is rotten and unforgivable as a handle to depose Xi and have Taiwan invade the Mainland under the guise of international "aide".
Why this matters to you as a trader is because you're flirting with getting gapped down hard since Beijing daytime is New York night time.
If you want to be long right now you need to be hedged long volatility, or you're risking your life.
Moreover, Xi, in order to defend himself, his faction of Chinese nationalists, and China's 5,000 year history, can overthrow the CCP in a Gorbachev-style coup overnight, weaponizing the 24-year-long persecution and genocide of Falun Dafa by the faction belonging to former Chairman Jiang Zemin (it died this year).
The significance is major to traders because your beloved governments, banks, and corporations have stained their hands crimson flirting with the Jiang faction toadies in Shanghai (Babylon) in order to get all the benefits they desire.
Google the Neil Heywood story if you want to see a classic example of a British billionaire getting gibbed by the greatest evil of all time.
Much to do before the call's key points.
Before we continue, I examine the price action I expect to manifest in SPY (SPX Futures ETF) for the remainder of the month, which can serve as something of a compass for what lies ahead:
SPY - A Dip Is Coming. Maybe Buy It?
Back to MSFT:
This is a very hard setup to trade
Because the June high may have been a hard top, double and triple top or not (See TSLA July-September '22)
Lower lows lower highs indicates the dip is hard to buy
But the short may only take us to the $320 range.
Sweeping $300 is the key to a bullish continuation above the highs
Maintaining ~$280 is the key to continuing upwards at all.
Microsoft has a really notable catalyst in that its earnings are on July 25 postmarket, which means price action will manifest the morning of July 26, which just so happens to be when the next FOMC meeting is.
After July FOMC the next FOMC is deferred until September 20, 9 days short of quarter end, notable because of the notorious JPM Collar, which I discuss here:
SPX/ES - An Analysis Of The 'JPM Collar'
What I expect is we see a fairly violent correction on Microsoft back to the $300s before we can see any kind of further meaningful flirtation with a run over the $350 ATH.
But the June high may have been the top for the foreseeable future, as evidenced by the relationship between NVDA and MSFT.
Be careful. The time we have left for happy and normal days is so short you can almost count it on the fingers.
When things really emerge, Nasdaq 8,500 will be the least of your concerns, really.

Microsoft channel break AnalysisFundamental / Technical / News analysis
Microsoft earnings were positive.
But they were not enough to break this channel since June 10th.
Today we gapped above resistance, breaking the channel.
This was caused due to Microsoft winning the JEDI contract from the US government; who beat Amazon, Oracle and IBM cloud platforms.
Revenue from the JEDI contract is estimated at $10 billion over 10 years.
The value of the contract isn't significant to Microsoft market cap of $1 trillion (1%), specially as it will take a decade to get.
However, Microsoft earnings gave Azure (cloud service) a lot of importance. Beating its competition in this area, will boost sentiment. After all... we did break resistance on this specific news! Price talks more than anything.

Microsoft in Focus Ahead of Key Earnings, AI Outlook Under WatchMacro:
- Microsoft (MSFT) climbed on cautious optimism ahead of major earnings and economic data.
- Four of the “Magnificent Seven,” AMZN, AAPL, META, and MSFT, are set to report, with investors focusing on Microsoft (MSFT) today.
- Wall Street expects EPS of 3.22 USD and revenue of 68.44 B USD, both up YoY. Microsoft’s strength in AI, cloud, and enterprise software, along with its continued investment in AI talent and solid dividend history, makes this a closely watched report.
- Key drivers will be its results, AI/cloud growth outlook, and forward guidance, while any surprises could shift the stock sharply.
Technical:
- MSFT recovered and tested the resistance at around 396, confluence with EMA78. The price is sideways, and we await a clearer breakout to determine the following direction.
- If MSFT breaks above 396, the price may approach the following resistance at 405, confluence with the 100% Fibonancci Extension.
- On the contrary, remaining below 396 may prompt a retest to the support at around 378, confluence with the broken descending channel.
Analysis by: Dat Tong, Senior Financial Markets Strategist at Exness

Microsoft - A Little Lower And Much Higher!Microsoft ( NASDAQ:MSFT ) is about to retest strong support:
Click chart above to see the detailed analysis👆🏻
In mid 2024 Microsoft perfectly retested the previous channel resistance trendline and the recent weakness has not been unexpected at all. However the overall trend still remains rather bullish and if Microsoft retests the previous all time high, a significant move will most likely follow.
Levels to watch: $350
Keep your long term vision!
Philip (BasicTrading)

Microsoft (MSFT): A Potential Plunge After a Decade's RiseOn the Microsoft three-day chart NASDAQ:MSFT , we've observed that the initial cycle of Wave (5) & I peaked at $430, hitting the 61.8% extension level, and has since declined to $402. We believe that $430 will now act as a strong resistance level.
We anticipate a significant correction for Microsoft, potentially dropping to between $220 and $100. This forecast is based on the end of the first bullish cycle, following a decade of substantial increases in Microsoft's stock price. Such a correction is seen as necessary for sustainable long-term growth
The exact nature of the correction, whether it adopts a Flat or Zigzag pattern, remains to be determined. Flats are more common than Zigzags, hence they are considered more likely, but we are keeping an open mind as we monitor the chart's developments.
We will hold off on positioning ourselves immediately, opting instead to watch how the situation unfolds on the broader chart before identifying potential smaller-scale entry points.

Microsoft - Slammed after the earnings report Prior to the beginning of the current earnings season, we warned investors that this would be a volatile period preceding the ECB and FED meetings, characterized by companies narrowly beating market expectations or failing to fulfill them. We also stated that this would enforce our thesis about the second stage of the bear market and progression deeper into the recession.
It did not take long before earning season arrived, and companies started to prove our predictions true (Adidas, Alphabet, Mattel, etc.). Unfortunately, we expect this trend to continue in the next earning season; indeed, we believe it will be far worse than the current one.
Yesterday, Microsoft announced its earnings for the third quarter of 2022, in which it reported an 11% increase in revenue and a 6% increase in operating income. Additionally, the company reported a 14% decrease in net income and a 13% decrease in diluted earnings per share. That subsequently led to a drop in the price of MSFT stock by more than 6.5% after hours.
In our opinion, this merely highlights what we have been reiterating for a while. The market is in recession, and the recent bounce off the 2022 lows represents merely another bear market rally predestined to fall later. With that being said, we expect economic conditions to worsen next week with another FED rate hike.
Illustration 1.01
Illustration 1.01 shows the daily chart of Microsoft stock. It can be seen closing at 250.66 USD yesterday; however, after the close and earnings report, it plunged more than 6.5% to 234 USD. This dramatic price action occurred despite Microsoft announcing an increase in revenue and operating expenses compared to the same period a year ago.
Technical analysis - daily time frame
RSI, MACD, and Stochastic are all bullish. DM+ and DM- are also bullish. Overall, the daily time frame is bullish; however, the data does not reflect the drop after earnings. Therefore, we expect the daily time frame to turn bearish today.
Illustration 1.02
Illustration 1.02 displays the daily chart of MSFT stock and simple support/resistance levels.
Technical analysis - weekly time frame
RSI, MACD, and Stochastic are flattening, trying to reverse. DM+ and DM- are bearish. Overall, the weekly time frame remains bearish.
Please feel free to express your ideas and thoughts in the comment section.
DISCLAIMER: This analysis is not intended to encourage any buying or selling of any particular securities. Furthermore, it should not be a basis for taking any trade action by an individual investor. Therefore, your own due diligence is highly advised before entering a trade.

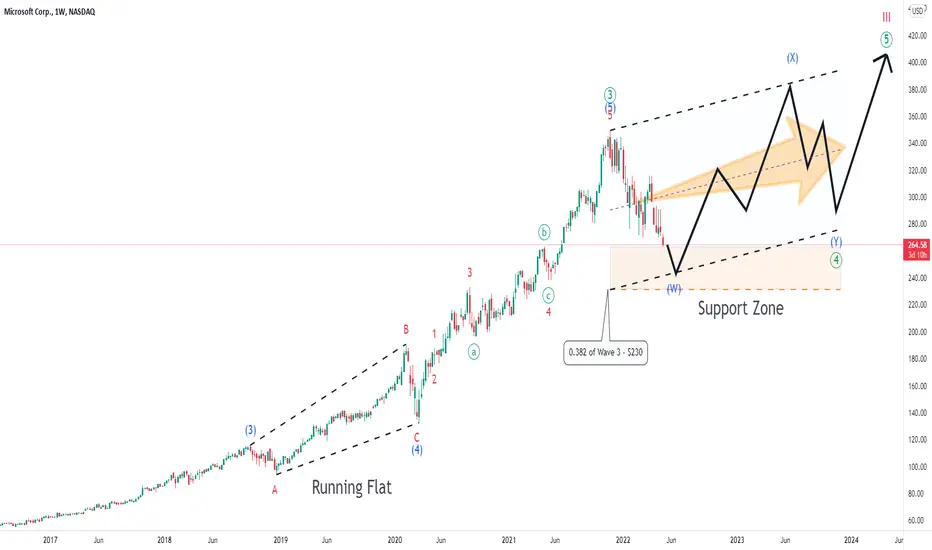
Microsoft - Time to Buy the Dip? Still the undefeated software giant Microsoft , top 3 company of the world has corrected for 25%, nearly as much as we have seen in March 2020.
Is it time to buy?
Fundamental indicators:
Revenue and Profits - consistent strong growth for the past 10 years
Profit margin - impressive 35% in 2021
P/E - although still above the norms with 27x ratio it can be considered by many very much acceptable for this highly effective company
Liabilities - no problems with debt
Technical Analysis (Elliott Waves):
The rapid drop in March 2020 has completed correction that has been observed for nearly year and a half and formed by a Running Flat
Since then Microsoft has enjoyed an explosive growth with over 150% increase in an impulse movement
And having peaked at $350 there is another correction developing now
Given the rank of this highly sought after stock it is possible to assume that this correction is going to be similar to the previous one and the depth is not going to exceed 0.382 Fibonacci retracement of wave 3, i.e. not lower than $230, and it will also be shaped as a Running Flat
Duration of this running correction is likely to be longer than the previous one lasting at least till end of 2023 followed by another rocket-like movement to the moon
What do you think about the prospects for Microsoft ?
Please share your thoughts in the comments and like this idea if you would like to see more stocks analysed using Elliott Waves.
Thanks
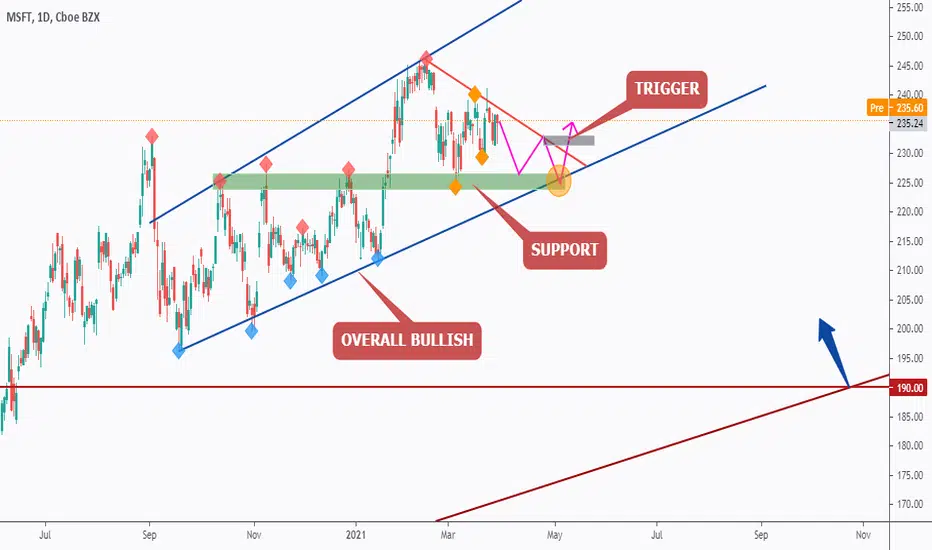
MICROSOFT - Trend-Following Setup!Hello Trading Family, I found MICROSOFT chart interesting.
We can see that MICROSOFT is currently trading inside these two blue trendlines forming a rising channel.
And it is currently approaching a strong rejection/ support area.
I call it "War Zone", highlighted in Orange (circle).
The highlighted orange circle is a strong area to look for buy setups as it is the intersection of support in green and the lower blue trendline acting as non-horizontal support. (trend-following setup)
As per my trading style/plan:
Short-term: As MICROSOFT approaches the orange circle (area), I will be looking for bullish reversal setups on lower timeframes (like a double bottom, trendline break, and so on...)
Long-term: I will be waiting for a third swing high to form around the upper red trendline (projection in purple) for it to become valid then buy on this last swing high (gray area) break upward.
Always follow your trading plan regarding entry, risk management, and trade management.
Good Luck
All Strategies Are Good; If Managed Properly!
~Rich
Microsoft will be reporting Q3 2020 Earnings on April 29Analysts are expecting close to $36.9 bn in revenues for Q3 2020. This represents a revenue growth estimate of around 20% YOY. Microsoft is in strong position to continue its business uninterrupted even during COVID-19 outbreak. However, 20% growth rate was baked into valuations at the end of January, before economic disruptions took place. Microsoft’s own guidance for Q3 2020 is - estimated revenue of $34.1 to $34.9 billion, which is lower than analysts’ estimates of $36.9 billion. Given a backdrop of economic slowdown, it will be hard for the company to exceed, and possibly even meet these expectations. The price action on the chart shows a lower top at $180 per share vs. $187 in March and RSI crossed pointing downward. In conclusion, Microsoft will remain one of the strongest drivers on the market. However, all the expectations may have been already priced in.

Microsoft broke the All-Time High !Hello, Traders!
Monfex is at your service and today we overview Microsoft .
Last Friday, the Pentagon selected Microsoft as the winner of its winner-takes-all cloud contract, which could be valued as high as $10B.
The Global 2000: The World’s Best Employers List consists of 500 companies.
In the second place - Microsoft !
A Flat top triangle pattern was broken and the price is over the resistance zone with a bullish formation and it's a good buy signal. Bulls dominance.
The target is 127% Fibonacci.
The target zone ~ $155
The local support zone ~ $142-142.5
The support zone ~ $136-137
Market Cap
1096.412B
Share your thoughts, ideas about the market under the chart.
Watch for our Updates to be the first who gets well-timed signals !
GOOD LUCK AND LOTS OF PROFITS !!
Disclaimer
This report is for information purposes only and should not be considered a solicitation to buy or sell any trading assets. Monfex accepts no responsibility for any consequences resulting from the use of this material. Any person acting on this trade idea does so entirely at their own risk.
