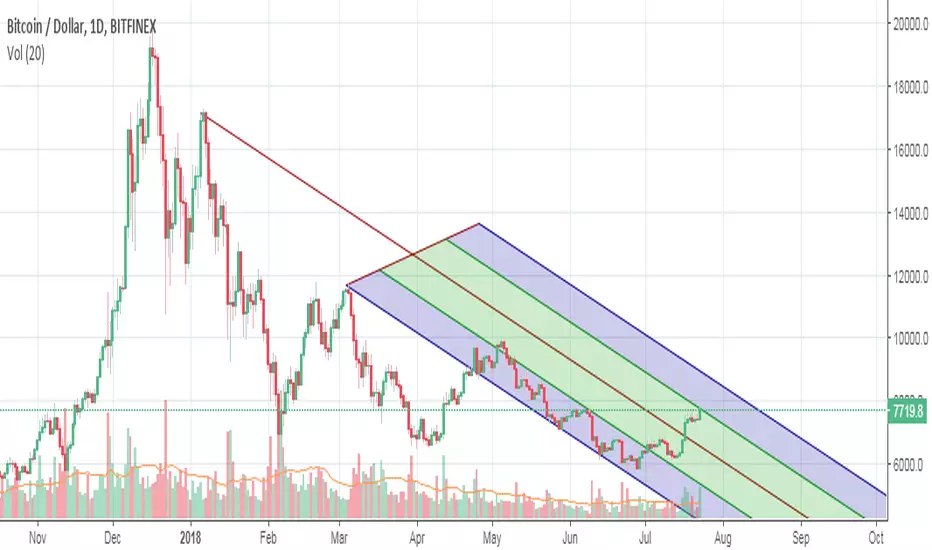
CELR/BTC approaching possible Support zones: Celer Network buy ?Plot to try and guage this crazy coin launch.
Confluence of important Fib extensions nearby.
Lets see if one bounces, or if this coin is dead.
See some of my other Alt coin Ideas below :
ADA breakoput call:
XLM breakout call:
ZRX bounce call:
RVN bounce call:
ONT topping call:
ENJ topping alert:
Search in ideas for "PLOT"

AUDUSD bullish scenario: AU extreme bull if Trade Wars turn?Plot of possible AU trend change and bull run.
The EW waves are hard to follow, but I am seeing a Green path and a Blue path, I II III IV V of each color.
I think we are in wave III of one of those scenarios.
I have a lower order 12345 of each color to play out the wave III of larger order.
I am actually an AU bear, so will be looking for shorting opportunities.
I do NOT expect it to be anywhere near this bullish, but if the sentiment turns, AU could swing fast as we know.
But recent Trade Wars news from China seems to be positive for AUD and EUR sentiment.
Personally I think Trump negotiates by starting hard-ass, and then working towards a mutually profitable agreement.
I also think China will come to the table after some tough-talk, since they surely can not lose out on the US market.
If China and US start negotiating, then some of the AU bear pressure will release.
If China and US agree to something, then AU bull pressure will add to the move.

OIL/M/USA Intentions for their gain?Plot:Will USA pull down Oil for their gain until December? TRUMP is in a TRADE WAR
USA: Intentions on dropping oil for their gain
+To harden Iran fresh sanctions in Nov
+Middle East Oil Exporters will be hardened
+Outcome : Oil becomes shortened Until December
December Oil rises due winter needs?
Results
+CAD to loose grip until NOV done.
+USDCAD to be on buying dips (NAFTA idk atm)
+with BOJ proposing of hiking rates CADJPY to lose?
If Price is Well Below 70$ in NOV Us Sanctions will hit hard on Iran
USA happy oil above 40$
Will USA pull down Oil for their gain until December?
UC:
CJ:
Trade with care this is my view.


Supertrend and 50 SMA Bollinger Band Trade SystemPlot standard deviations (SD) 1, 2, 3, 4, 5, and 6 for the 50 SMA along with the 2 ATR and 3 ATR settings for the Supertrend (ST) indicator (found under "public" for indicators).
The idea is to use the 2 ATR ST and MACD as filters to direction of trade and to take trades once price is above or below the 1 SD bollinger bands (the first band around the 50 SMA).
Entries are made off of tests of the 1 SD band or tests of the 2 ATR ST. The stop may be any of the 1 SD band, 2 ATR ST, or 3 ATR ST, that gives the price comfortable room and/or desirable reward to risk.
Stops may be trailed off of either of the ATRs (2 or 3), as long as they remain mostly on the other side of the 1 SD band (as in 3 fourths of the time, or more), relative to price.
In the case of longs, consider selling all, or a portion, of the position whenever price forms a bearish candle setups (with confirmation) near "extreme" levels, relative to either the SD bands or 50 SMA envelopes (the thick black line on the chart indicates a 25% envelope to the 50 SMA). Anything at or above the 2 SD line is extreme, particularly 3 SD and up. Especially be weary if price has tested a band two or three times previous and even more so if RSI or MACD are showing divergence with price tops.
In case of shorts, treat everything said for longs in reverse. Look for bullish candle setups out of the extreme conditions.
Examples of bearish candle formations that I'd be on the lookout for include "tweezer tops" (or bearish engulfing candles), long wick candles that counter the trend (some may prefer to wait for confirmation by a follow through day, but I let the circumstances determine what option is best), and multiple days of bearish fractals near a price range top (in which case the stop could be hugged up against the bottom of the range).

chfjpy possible turningpointplot it in your own chart, metatrader with oanda gives different results.

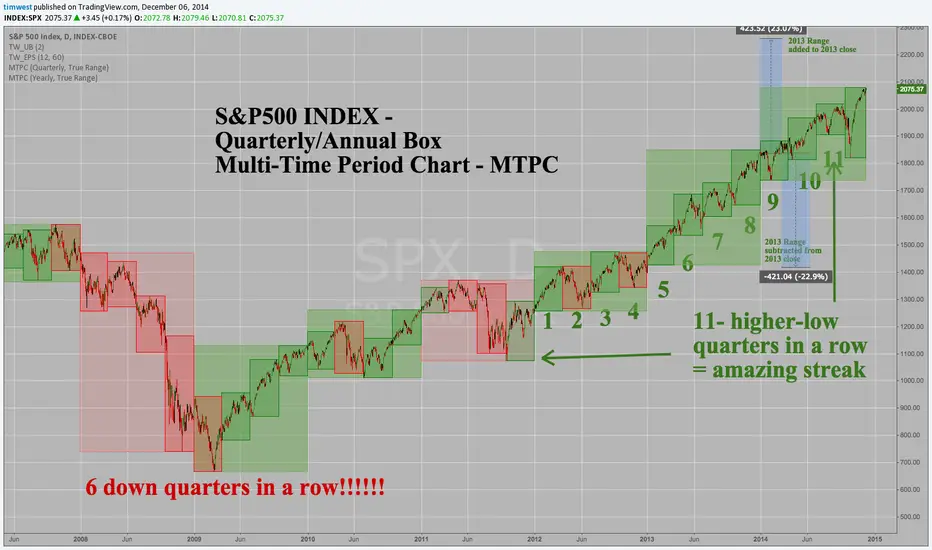
SPY quarterly reset vs S&P 500. Subtle but real. Plot the ratio of SPX to SPY and most would expect a fairly constant ratio around 10:1 to pop up. But the chart itself shows the same pattern - a quarterly reset starting at about 10.02 and then ratio decay to about 9.97. Last week we were trading 9.96 on average but at end of day Friday we popped to 10.02, right on time at options expiration..
Keep the ratio reset in mind as you do "math in your head" while studying the S&P 500 chart and pick support/resistance numbers for SPY trades.

S&P500 Index - Daily-Quarterly-Annual Multi-Time-Period-ChartsPlot multiple-time-frames with a new feature at TradingView.
Click "make it mine" on the "share" button to look up other markets to explore patterns.
Cheers!
Tim 12/6/2014 8:27PM EST
Correlation of SPY vs BLV (stocks vs bonds)Plot shows the 63 day correlation of price and weekly returns of SPY vs BLV.

ETH TrendLineYou can follow trendline to buy sell eth anytime anywhere !
Here is the open-source indicator code
if you want to trade on trendline. ,
//@version=4
study(title="1 Hour-Hull-Strategy", shorttitle="modcrypto 1 Hour", overlay=true)
//Source
src = input(close, title="Source")
//Hull Lengths
length1 = 14 //input(14, minval=1, title="Hull-14")
length2 = 50 //input(50, minval=1, title="Hull-50")
length3 = 100//input(100, minval=1, title="Hull-100")
//StdDev Multiplier
mult = input(0.5, minval=0.001, maxval=50, title="StdDev Multiplier")
//Hullma14 - 50 - 100
hullma14 = wma(2*wma(src, length1/2)-wma(src, length1), round(sqrt(length1)))
hullma50 = wma(2*wma(src, length2/2)-wma(src, length2), round(sqrt(length2)))
hullma100 = wma(2*wma(src, length3/2)-wma(src, length3), round(sqrt(length3)))
//stddev
dev = mult * stdev(src, 50)
//hullma50 upper
upper = hullma50 + dev
//hullma50 lower
lower = hullma50 - dev
//HULLMA PLOTS
/////////////////////////////////////////////////////////////////
plot(hullma14, color=color.lime, linewidth=2, title="Hullma-14")
plot(hullma50, color=#b71c1c, linewidth=2, title="Hullma-50")
plot(hullma100, color=color.orange, linewidth=2, title="Hullma-100")
p1 = plot(upper, color=color.blue, title="Hullma50 Upper")
p2 = plot(lower, color=color.blue, title="Hullma50 Lower")
/////////////////////////////////////////////////////////////////
showLabels = input(true, title="Hide/Show Labels")
//Volume Based Colored Bars
/////////////////////////////////////////////////////////////////
length= input(21, "Length", minval=1)
avrg=sma(volume,length)
vold1 = volume > avrg*1.5 and close= avrg*0.5 and volume<=avrg*1.5 and close avrg*1.5 and close>open
volu2 = volume >= avrg*0.5 and volume<=avrg*1.5 and close>open
volu3 = volume< avrg*0.5 and close>open
cold1=#800000
cold2=#FF0000
cold3=color.orange
colu1=#006400
colu2=color.lime
colu3=#7FFFD4
VolColor = vold1 ? cold1 : vold2 ? cold2 : vold3 ? cold3 : volu1 ? colu1 : volu2 ? colu2 : volu3 ? colu3 : na
barcolor(VolColor, title="Volume Based Bars")
/////////////////////////////////////////////////////////////////
//Hull Conditions and Labels
/////////////////////////////////////////////////////////////////
//Price > Hullma14 - Price < Hullma14
price_14_buy = cross(hullma14, src) and hullma14 <= src
price_14_sell = cross(hullma14, src) and src <= hullma14
plotshape(showLabels ? price_14_buy : na, style=shape.triangleup, location=location.belowbar, color=color.lime, title="Price > Hullma14", size=size.tiny)
plotshape(showLabels ? price_14_sell : na, style=shape.triangledown, location=location.abovebar, color=color.red, title="Hullma14 > Price", size=size.tiny)
//hullma14 > Lower - hullma14 > Upper
ready = cross(hullma14, lower) and lower <= hullma14
careful = cross(hullma14, upper) and hullma14 <= upper
plotshape(showLabels ? careful : na, style=shape.labeldown, location=location.abovebar, color=#ef9a9a, size=size.tiny, title="Careful Label", text="C", textcolor=color.white)
plotshape(showLabels ? ready : na, style=shape.labelup, location=location.belowbar, color=color.orange, size=size.tiny, title="Ready Label", text="R", textcolor=color.white)
buy1 = hullma50 >= hullma100 and crossover(hullma14, hullma100) //and (src > hullma14 or src > hullma14)
buy2 = hullma100 >= hullma50 and crossover(hullma14, hullma50) //and (src > hullma14 or src > hullma14)
plotshape(showLabels and buy1 ? hullma14 : na, style=shape.labelup, location=location.absolute, color=color.lime, size=size.tiny, title="Buy Label-1", text="B", textcolor=color.white)
plotshape(showLabels and buy2 ? hullma14 : na, style=shape.labelup, location=location.absolute, color=color.lime, size=size.tiny, title="Buy Label-2", text="B", textcolor=color.white)
//hullma14 > hullma50 - hullma100
add1 = hullma50 >= hullma100 and crossover(hullma14, hullma50) //and (src > hullma14 or src > hullma14)
add2 = hullma100 >= hullma50 and crossover(hullma14, hullma100) //and (src > hullma14 or src > hullma14)
plotshape(showLabels and add1 ? hullma14 : na, style=shape.labelup, location=location.absolute, color=color.green, size=size.tiny, title="Add Label-1", text="A", textcolor=color.white)
plotshape(showLabels and add2 ? hullma14 : na, style=shape.labelup, location=location.absolute, color=color.green, size=size.tiny, title="Add Label-2", text="A", textcolor=color.white)
//hullma14 < hullma50 - hullma100
dec1 = hullma50 >= hullma100 and crossunder(hullma14, hullma50)// and low < hullma14
dec2 = hullma100 >= hullma50 and crossunder(hullma14, hullma100)// and low < hullma14
plotshape(showLabels and dec1 ? hullma14 : na, style=shape.labeldown, location=location.absolute, color=color.red, size=size.tiny, title="Decrease Label-1", text="D", textcolor=color.white)
plotshape(showLabels and dec2 ? hullma14 : na, style=shape.labeldown, location=location.absolute, color=color.red, size=size.tiny, title="Decrease Label-2", text="D", textcolor=color.white)
//hullma14 < hullma50 - hullma100
sell1 = hullma50 >= hullma100 and crossunder(hullma14, hullma100)// and low < hullma14
sell2 = hullma100 >= hullma50 and crossunder(hullma14, hullma50)// and low < hullma14
plotshape(showLabels and sell1 ? hullma14 : na, style=shape.labeldown, location=location.absolute, color=color.black, size=size.tiny, title="Sell Label-1", text="S", textcolor=color.white)
plotshape(showLabels and sell2 ? hullma14 : na, style=shape.labeldown, location=location.absolute, color=color.black, size=size.tiny, title="Sell Label-2", text="S", textcolor=color.white)
/////////////////////////////////////////////////////////////////
//Pivot Settings
/////////////////////////////////////////////////////////////////
ShowPivots = input(true, title="Show Pivot Points")
ShowHHLL = input(true, title="Show HH/LL Labels")
left = input(5, minval=1, title="Left Pivot Length")
right = input(5, minval=1, title="Right Pivot Length")
ShowSRLevels = input(true, title="Show SR Levels")
maxLvlLen = input(0, minval=0, title="Maximum S/R Level Extension Length (0 = Max)")
ShowChannel = input(false, title="Show Fractal Chaos Channel")
ShowFB = input(false, title="Show Fractal Breakouts")
// Determine pivots
///////////////////////////////////////////////////////////////
pvtLenL = left
pvtLenR = right
// Get High and Low Pivot Points
///////////////////////////////////////////////////////////////
pvthi_ = pivothigh(high, pvtLenL, pvtLenR)
pvtlo_ = pivotlow(low, pvtLenL, pvtLenR)
// Force Pivot completion before plotting.
///////////////////////////////////////////////////////////////
pvthi = pvthi_
pvtlo = pvtlo_
//Higher Highs, Lower Highs, Higher Lows, Lower Lows
///////////////////////////////////////////////////////////////
valuewhen_1 = valuewhen(pvthi, high , 1)
valuewhen_2 = valuewhen(pvthi, high , 0)
higherhigh = na(pvthi) ? na : valuewhen_1 < valuewhen_2 ? pvthi : na
valuewhen_3 = valuewhen(pvthi, high , 1)
valuewhen_4 = valuewhen(pvthi, high , 0)
lowerhigh = na(pvthi) ? na : valuewhen_3 > valuewhen_4 ? pvthi : na
valuewhen_5 = valuewhen(pvtlo, low , 1)
valuewhen_6 = valuewhen(pvtlo, low , 0)
higherlow = na(pvtlo) ? na : valuewhen_5 < valuewhen_6 ? pvtlo : na
valuewhen_7 = valuewhen(pvtlo, low , 1)
valuewhen_8 = valuewhen(pvtlo, low , 0)
lowerlow = na(pvtlo) ? na : valuewhen_7 > valuewhen_8 ? pvtlo : na
// If selected Display the HH/LL above/below candle.
///////////////////////////////////////////////////////////////
plotshape(ShowHHLL ? higherhigh : na, title='Higher High', style=shape.triangledown, location=location.abovebar, color=color.new(color.red,25), text="HH", offset=-pvtLenR)
plotshape(ShowHHLL ? higherlow : na, title='Higher Low', style=shape.triangleup, location=location.belowbar, color=color.new(color.green,25), text="HL", offset=-pvtLenR)
plotshape(ShowHHLL ? lowerhigh : na, title='Lower High', style=shape.triangledown, location=location.abovebar, color=color.new(color.red,25), text="LH", offset=-pvtLenR)
plotshape(ShowHHLL ? lowerlow : na, title='Lower Low', style=shape.triangleup, location=location.belowbar, color=color.new(color.green,25), text="LL", offset=-pvtLenR)
plot(ShowPivots and not ShowHHLL ? pvthi : na, title='Pivot Top', style=plot.style_circles, join=false, color=color.green, offset=-pvtLenR, linewidth=3)
plot(ShowPivots and not ShowHHLL ? pvtlo : na, title='Pivot Bottom', style=plot.style_circles, join=false, color=color.red, offset=-pvtLenR, linewidth=3)
//Count How many candles for current Pivot Level, If new reset.
///////////////////////////////////////////////////////////////
counthi = 0
countlo = 0
counthi := na(pvthi) ? nz(counthi ) + 1 : 0
countlo := na(pvtlo) ? nz(countlo ) + 1 : 0
pvthis = 0.0
pvtlos = 0.0
pvthis := na(pvthi) ? pvthis : high
pvtlos := na(pvtlo) ? pvtlos : low
hipc = pvthis != pvthis ? na : color.new(color.red, 50)
lopc = pvtlos != pvtlos ? na : color.new(color.green, 50)
// Show Levels if Selected
///////////////////////////////////////////////////////////////
plot(ShowSRLevels and (maxLvlLen == 0 or counthi < maxLvlLen) ? pvthis : na, color=hipc, linewidth=2, offset=-pvtLenR, title="High Levels", style=plot.style_line) // not ShowChannel and
plot(ShowSRLevels and (maxLvlLen == 0 or countlo < maxLvlLen) ? pvtlos : na, color=lopc, linewidth=2, offset=-pvtLenR, title="Low Levels", style=plot.style_line) // not ShowChannel and
// Show Levels as a Fractal Chaos Channel
///////////////////////////////////////////////////////////////
plot(ShowSRLevels and ShowChannel ? pvthis : na, color=color.green, linewidth=1, style=plot.style_stepline, offset=0, title="Fractal Channel High Levels", trackprice=false)
plot(ShowSRLevels and ShowChannel ? pvtlos : na, color=color.red, linewidth=1, style=plot.style_stepline, offset=0, title="Fraktal Channel Low Levels", trackprice=false)
//Add Optional Fractal Break Alerts
///////////////////////////////////////////////////////////////
Pivotbuy = false
Pivotsell = false
Pivotbuy := close>pvthis and openpvtlos //open>=pvtlos
// Alerts
///////////////////////////////////////////////////////////////
plotshape(ShowFB and Pivotbuy?1:na, title="Pivot Buy", color=color.green, style=shape.triangleup, location =location.belowbar, size=size.small)
plotshape(ShowFB and Pivotsell?-1:na, title="Pivot Sell", color=color.red, style=shape.triangledown, location =location.abovebar, size=size.small)
//Fractal Alarms
///////////////////////////////////////////////////////////////
alertcondition(Pivotbuy or Pivotsell, title="Fractal Breakout", message="Fractal Breakout")
alertcondition(Pivotbuy,title="Fractal Brekout BUY", message="Fractal Brekout BUY")
alertcondition(Pivotsell,title="Fractal Brekout SELL", message="Fractal Brekout SELL")
////////////////////////////////////////
//Other Alarms
alertcondition(price_14_buy, "Price > Hullma14", "Price > Hullma14")
alertcondition(price_14_sell, "Hullma14 > Price", "Hullma14 > Price")
alertcondition(ready, "Be Ready", "Be Ready")
alertcondition(careful, "Be Careful", "Be Careful")
alertcondition(buy1, "Buy-1", "Buy-1")
alertcondition(buy2, "Buy-2", "Buy-2")
alertcondition(add1, "Add-1", "Add-1")
alertcondition(add2, "Add-2", "Add-2")
alertcondition(dec1, "Decrease-1", "Decrease-1")
alertcondition(dec2, "Decrease-2", "Decrease-2")
alertcondition(sell1, "Sell-1", "Sell-1")
alertcondition(sell2, "Sell-2", "Sell-2")
enjoy!

ichimoku-supertrend Quoc Le// © Maihoangtri
//@version=4
study("Ichimoku QL", shorttitle="Ichi Quoc Le",overlay=true)
Midpoint(len)=>avg(highest(len),lowest(len))
Offset=input(26,title="Displacement")
//-------------------------------------------------------------------------------------------------
//Draw Tenkan line
TK_lenghth=input(9,title="Tenkan leghth",minval=1)
TK=Midpoint(TK_lenghth)
plot(TK,title="Tenkan line",color=#002aff,linewidth=1)
//-------------------------------------------------------------------------------------------------
//Draw Kijun line
KJ_lenghth=input(26,title="Kijun leghth",minval=1)
KJ=Midpoint(KJ_lenghth)
plot(KJ,title="Kijun line",color=#ff4000,linewidth=1)
//-------------------------------------------------------------------------------------------------
//Draw Tenkan2 line
TK2_lenghth=input(65,title="Tenkan2 leghth",minval=1)
TK2=Midpoint(TK2_lenghth)
plot(TK2,title="Tenkan2 line",color=#002aff,linewidth=1)
//-------------------------------------------------------------------------------------------------
//Draw Kijun2 line
KJ2_lenghth=input(129,title="Kijun2 leghth",minval=1)
KJ2=Midpoint(KJ2_lenghth)
plot(KJ2,title="Kijun2 line",color=#ff4000,linewidth=1)
//-------------------------------------------------------------------------------------------------
//Draw Dagger 65
DG65_lenghth=input(65,title="Dagger 65 leghth",minval=1)
DG65=Midpoint(DG65_lenghth)
plot(DG65,title="Dagger 65 line",color=#ffa200,linewidth=2)
//-------------------------------------------------------------------------------------------------
//Draw Dagger 129
DG129_lenghth=input(129,title="Dagger 129 leghth",minval=1)
DG129=Midpoint(DG129_lenghth)
plot(DG129,title="Dagger 129 line",color=#6708c7,linewidth=2)
//-------------------------------------------------------------------------------------------------
//Chikou
CK = close
plot(CK,title="Chikou line",color=#283b57,linewidth=1,offset=-Offset)
//-------------------------------------------------------------------------------------------------
//Span A
SpanA=avg(TK,KJ)
//-------------------------------------------------------------------------------------------------
//Span B
SpanB_lenghth=input(52,title="Span B leghth",minval=1)
SpanB=Midpoint(SpanB_lenghth)
//-------------------------------------------------------------------------------------------------
//Span A2
SpanA2=avg(TK2,KJ2)
//-------------------------------------------------------------------------------------------------
//Span B2
SpanB2_lenghth=input(200,title="Span B2 leghth",minval=1)
SpanB2=Midpoint(SpanB2_lenghth)
//-------------------------------------------------------------------------------------------------
//Kumo Color
Kumo_color = SpanA>=SpanB ? color.new(color.green, 50): color.new(color.red, 50)
Kumo_line_color=SpanA>=SpanB ? color.new(color.green, 50): color.new(color.red, 50)
s1=plot(SpanA,title="Span A line",color=Kumo_line_color,linewidth=1,offset=Offset)
s2=plot(SpanB,title="Span B line",color=Kumo_line_color,linewidth=1,offset=Offset)
fill(s1,s2,title="Kumo Cloud Color",color=Kumo_color)
//-------------------------------------------------------------------------------------------------
//Kumo2 Color
Kumo2_color = SpanA2>=SpanB2 ? color.new(color.green, 50): color.new(color.red, 50)
Kumo2_line_color=SpanA2>=SpanB2 ? color.new(color.green, 50): color.new(color.red, 50)
s1a=plot(SpanA2,title="Span A2 line",color=Kumo2_line_color,linewidth=1,offset=Offset)
s2a=plot(SpanB2,title="Span B2 line",color=Kumo2_line_color,linewidth=1,offset=Offset)
fill(s1,s2,title="Kumo2 Cloud Color",color=Kumo2_color)
//-------------------------------------------------------------------------------------------------
// Tenkan & Kijun H1 for Breakout signal
donchian(len) => avg(lowest(len), highest(len))
TK_H1 = donchian(108)
KJ_H1 = donchian(204)
//-------------------------------------------------------------------------------------------------
//Draw Tekan & Kijun Vertical line
bgcolor(color=color.new(color.blue, 90), offset=-8,show_last=1,title= "TK vertical line")
bgcolor(color=color.new(color.red, 90), offset=-16,show_last=1,title= "KJ vertical line")
bgcolor(color=color.new(color.gray, 90), offset=-25,show_last=1,title= "Chikou vertical line")
//-------------------------------------------------------------------------------------------------
// Union Signal
Union_up=(TK>TK and KJ>KJ and TK==KJ) or (TK>TK and KJ>KJ and (TK-KJ)<=0.00004)
Union_down=(TKTK_H1 and KJ_H1>KJ_H1 and DG65>DG65 and DG129>DG129 and TK_H1-KJ_H1<=0.00004
Break_down=Union_down and TK_H1high ) and TK>KJ and (close>SpanA and close>SpanB ) and (low>SpanA and low>SpanB )
idealsell = (closeSpanA and low>SpanB )
sellcloud = crossunder(SpanA, SpanB) and (high up1 ? max(up,up1) : up
dn=src+(Multiplier*atr)
dn1 = nz(dn , dn)
dn := close < dn1 ? min(dn, dn1) : dn
trend = 1
trend := nz(trend , trend)
trend := trend == -1 and close > dn1 ? 1 : trend == 1 and close < up1 ? -1 : trend
upPlot = plot(trend == 1 ? up : na, title="Up Trend", style=plot.style_linebr, linewidth=2, color=color.green)
buySignal = trend == 1 and trend == -1
plotshape(buySignal ? up : na, title="UpTrend Begins", location=location.absolute, style=shape.circle, size=size.tiny, color=color.green, transp=0)
plotshape(buySignal and showsignals ? up : na, title="Buy", text="Buy", location=location.absolute, style=shape.labelup, size=size.tiny, color=color.green, textcolor=color.white, transp=0)
dnPlot = plot(trend == 1 ? na : dn, title="Down Trend", style=plot.style_linebr, linewidth=2, color=color.red)
sellSignal = trend == -1 and trend == 1
plotshape(sellSignal ? dn : na, title="DownTrend Begins", location=location.absolute, style=shape.circle, size=size.tiny, color=color.red, transp=0)
plotshape(sellSignal and showsignals ? dn : na, title="Sell", text="Sell", location=location.absolute, style=shape.labeldown, size=size.tiny, color=color.red, textcolor=color.white, transp=0)
mPlot = plot(ohlc4, title="", style=plot.style_circles, linewidth=0)
longFillColor = highlighting ? (trend == 1 ? color.green : color.white) : color.white
shortFillColor = highlighting ? (trend == -1 ? color.red : color.white) : color.white
fill(mPlot, upPlot, title="UpTrend Highligter", color=longFillColor)
fill(mPlot, dnPlot, title="DownTrend Highligter", color=shortFillColor)
alertcondition(buySignal, title="SuperTrend Buy", message="SuperTrend Buy!")
alertcondition(sellSignal, title="SuperTrend Sell", message="SuperTrend Sell!")
changeCond = trend != trend
alertcondition(changeCond, title="SuperTrend Direction Change", message="SuperTrend has changed direction!")

Pine Beginner with Gr8 Script Idea - Script part need helpHi everyone
So before you get to excited - this is only the half of an idea which needs some Pine Scripting polish before I would classify this idea as one to take note of. With that said, if there's someone reading this that is willing to amend the code of my poor attempt to combine 3 scripts together in to 1 rather successful (potentially) algo/auto-trading script which was initially intended to place trades on MT5 for those who are either stuck, to far tied-in or simply stubborn enough to continue using a broker/s that are not listed on TradingView's list of verified brokers.
I must add that I honestly think this script has the potential to be one hellofa successful strategy for any trader who is considering or attempting to learn this fascinating and exciting coding language that can either leave you more confused than blind deaf old man at a psychedelic's rave OR open up a whole new approach of trading that was previously unfathomable yet now with each unique scripts encounter becoming unquestionably clearer that traders who embrace this path can only empower their trading potentials. I think if more opportunistic scripts like this one (once correctly coded by someone who is not as much a rookie as I am - at Pine Script coding not trading) along with some helpful guidelines for traders who have not discovered the wonders that TradingView has to offer any/all traders - that these "aha" types of doorways will be easily flooded with new interest evoked traders to the TradingView world.
But that's just one traders opinion who is looking towards putting this somewhat overly thought concept to test/s and I welcome any of you who wish to do the same, particularly in terms of trying to make heads or tails of my script that in theory makes perfect sense in my mind by using well known trading concepts by those who don't necessarily need to know how to code them in order to use them. However, in this specific case, the knowledge of how to code them has been given the centre front spotlight so feel free to take your shot in it's lime light if you wish. I would most definitely appreciate it and I'm sure you would benefit from the final scripts results as well.
Thanks to any and all who give it a go.
// Here's the script that I feel is best to share - there is a more recent updated version, however, I feel that my scripting skills or lack of may have made that version a great deal more confusing and messy than what this version below is. Hopefully you can see where Im trying to go with it. If not, please don't hesitate to ask and I'll do my best to try clarify where needed.
//
//@version=4
//
// Thanks to dynausmaux falconCoin LazyBear RicardoSantos LucemAnb andreholanda73 for all the scripts I'm using here.
// Special thanks to TradingView for unarguably the best trading platform in the world that facilitates development and learning.
// Before I begin, TAKE NOTE: I'm not an expert trader or pine script coder as such and all the code used here is copied and/or modified from scripts freely found that are published through TradingView.
//
//
// For those of you who actually do look in to the code behind scripts they come accross - here's logic behind all the colorful shapes all over your charts.
//
// CIRCLES & TRIANGLES:
// - LITTLE CIRCLE: They appear at all WaveTrend wave crossings.
// - GREEN CIRCLE: The wavetrend waves are at the oversold level and have crossed up (bullish).
// - RED CIRCLE: The wavetrend waves are at the overbought level and have crossed down (bearish).
// - GOLD/ORANGE CIRCLE: When RSI is below 20, WaveTrend waves are below or equal to -80 and have crossed up after good bullish divergence (DONT BUY WHEN GOLD CIRCLE APPEAR).
// - None of these circles are certain signs to trade. It is only information that can help you.
// - PURPLE TRIANGLE: Appear when a bullish or bearish divergence is formed and WaveTrend waves crosses at overbought and oversold points.
//
// +BEARS/BULLS FLAG:
// - MFI+RSI Area are RED (Below 0).
// - Wavetrend wave above 0 and crossing over down.
// - VWAP Area below 0 on higher timeframe.
// - This pattern reversed becomes bullish.
// +SIDE NOTE: Check the last heikinashi candle from 2 higher timeframe
// - Bearish/Bullish DIAMOND:
// -- HT Candle is red
// -- WT > 0 and crossed down
study(title = 'VuManChu B Divergences', shorttitle = 'VuMan CBD')
// PARAMETERS {
// WaveTrend
wtShow = input(true, title = 'Show WaveTrend', type = input.bool)
wtBuyShow = input(true, title = 'Show Buy dots', type = input.bool)
wtGoldShow = input(true, title = 'Show Gold dots', type = input.bool)
wtSellShow = input(true, title = 'Show Sell dots', type = input.bool)
wtDivShow = input(true, title = 'Show Div. dots', type = input.bool)
vwapShow = input(true, title = 'Show Fast WT', type = input.bool)
wtChannelLen = input(9, title = 'WT Channel Length', type = input.integer)
wtAverageLen = input(12, title = 'WT Average Length', type = input.integer)
wtMASource = input(hlc3, title = 'WT MA Source', type = input.source)
wtMALen = input(3, title = 'WT MA Length', type = input.integer)
// WaveTrend Overbought & Oversold lines
obLevel = input(53, title = 'WT Overbought Level 1', type = input.integer)
obLevel2 = input(60, title = 'WT Overbought Level 2', type = input.integer)
obLevel3 = input(100, title = 'WT Overbought Level 3', type = input.integer)
osLevel = input(-53, title = 'WT Oversold Level 1', type = input.integer)
osLevel2 = input(-60, title = 'WT Oversold Level 2', type = input.integer)
osLevel3 = input(-75, title = 'WT Oversold Level 3', type = input.integer)
// Divergence WT
wtShowDiv = input(true, title = 'Show WT Regular Divergences', type = input.bool)
wtShowHiddenDiv = input(false, title = 'Show WT Hidden Divergences', type = input.bool)
showHiddenDiv_nl = input(true, title = 'Not apply OB/OS Limits on Hidden Divergences', type = input.bool)
wtDivOBLevel = input(45, title = 'WT Bearish Divergence min', type = input.integer)
wtDivOSLevel = input(-65, title = 'WT Bullish Divergence min', type = input.integer)
// Divergence extra range
wtDivOBLevel_addshow = input(true, title = 'Show 2nd WT Regular Divergences', type = input.bool)
wtDivOBLevel_add = input(15, title = 'WT 2nd Bearish Divergence', type = input.integer)
wtDivOSLevel_add = input(-40, title = 'WT 2nd Bullish Divergence 15 min', type = input.integer)
// RSI+MFI
rsiMFIShow = input(true, title = 'Show MFI', type = input.bool)
rsiMFIperiod = input(60,title = 'MFI Period', type = input.integer)
rsiMFIMultiplier = input(150, title = 'MFI Area multiplier', type = input.float)
rsiMFIPosY = input(2.5, title = 'MFI Area Y Pos', type = input.float)
// RSI
rsiShow = input(false, title = 'Show RSI', type = input.bool)
rsiSRC = input(close, title = 'RSI Source', type = input.source)
rsiLen = input(14, title = 'RSI Length', type = input.integer)
rsiOversold = input(30, title = 'RSI Oversold', minval = 50, maxval = 100, type = input.integer)
rsiOverbought = input(60, title = 'RSI Overbought', minval = 0, maxval = 50, type = input.integer)
// Divergence RSI
rsiShowDiv = input(false, title = 'Show RSI Regular Divergences', type = input.bool)
rsiShowHiddenDiv = input(false, title = 'Show RSI Hidden Divergences', type = input.bool)
rsiDivOBLevel = input(60, title = 'RSI Bearish Divergence min', type = input.integer)
rsiDivOSLevel = input(30, title = 'RSI Bullish Divergence min', type = input.integer)
// RSI Stochastic
stochShow = input(true, title = 'Show Stochastic RSI', type = input.bool)
stochUseLog = input(true, title=' Use Log?', type = input.bool)
stochAvg = input(false, title='Use Average of both K & D', type = input.bool)
stochSRC = input(close, title = 'Stochastic RSI Source', type = input.source)
stochLen = input(14, title = 'Stochastic RSI Length', type = input.integer)
stochRsiLen = input(14, title = 'RSI Length ', type = input.integer)
stochKSmooth = input(3, title = 'Stochastic RSI K Smooth', type = input.integer)
stochDSmooth = input(3, title = 'Stochastic RSI D Smooth', type = input.integer)
// Divergence stoch
stochShowDiv = input(false, title = 'Show Stoch Regular Divergences', type = input.bool)
stochShowHiddenDiv = input(false, title = 'Show Stoch Hidden Divergences', type = input.bool)
// Schaff Trend Cycle
tcLine = input(false, title="Show Schaff TC line", type=input.bool)
tcSRC = input(close, title = 'Schaff TC Source', type = input.source)
tclength = input(10, title="Schaff TC", type=input.integer)
tcfastLength = input(23, title="Schaff TC Fast Lenght", type=input.integer)
tcslowLength = input(50, title="Schaff TC Slow Length", type=input.integer)
tcfactor = input(0.5, title="Schaff TC Factor", type=input.float)
// Sommi Flag
sommiFlagShow = input(false, title = 'Show Sommi flag', type = input.bool)
sommiShowVwap = input(false, title = 'Show Sommi F. Wave', type = input.bool)
sommiVwapTF = input('720', title = 'Sommi F. Wave timeframe', type = input.string)
sommiVwapBearLevel = input(0, title = 'F. Wave Bear Level (less than)', type = input.integer)
sommiVwapBullLevel = input(0, title = 'F. Wave Bull Level (more than)', type = input.integer)
soomiFlagWTBearLevel = input(0, title = 'WT Bear Level (more than)', type = input.integer)
soomiFlagWTBullLevel = input(0, title = 'WT Bull Level (less than)', type = input.integer)
soomiRSIMFIBearLevel = input(0, title = 'Money flow Bear Level (less than)', type = input.integer)
soomiRSIMFIBullLevel = input(0, title = 'Money flow Bull Level (more than)', type = input.integer)
// Sommi Diamond
sommiDiamondShow = input(false, title = 'Show Sommi diamond', type = input.bool)
sommiHTCRes = input('60', title = 'HTF Candle Res. 1', type = input.string)
sommiHTCRes2 = input('240', title = 'HTF Candle Res. 2', type = input.string)
soomiDiamondWTBearLevel = input(0, title = 'WT Bear Level (More than)', type = input.integer)
soomiDiamondWTBullLevel = input(0, title = 'WT Bull Level (Less than)', type = input.integer)
// macd Colors
macdWTColorsShow = input(false, title = 'Show MACD Colors', type = input.bool)
macdWTColorsTF = input('240', title = 'MACD Colors MACD TF', type = input.string)
darkMode = input(false, title = 'Dark mode', type = input.bool)
// Colors
colorRed = #ff0000
colorPurple = #e600e6
colorGreen = #3fff00
colorOrange = #e2a400
colorYellow = #ffe500
colorWhite = #ffffff
colorPink = #ff00f0
colorBluelight = #31c0ff
colorWT1 = #90caf9
colorWT2 = #0d47a1
colorWT2_ = #131722
colormacdWT1a = #4caf58
colormacdWT1b = #af4c4c
colormacdWT1c = #7ee57e
colormacdWT1d = #ff3535
colormacdWT2a = #305630
colormacdWT2b = #310101
colormacdWT2c = #132213
colormacdWT2d = #770000
// } PARAMETERS
// FUNCTIONS {
// Divergences
f_top_fractal(src) => src < src and src < src and src > src and src > src
f_bot_fractal(src) => src > src and src > src and src < src and src < src
f_fractalize(src) => f_top_fractal(src) ? 1 : f_bot_fractal(src) ? -1 : 0
f_findDivs(src, topLimit, botLimit, useLimits) =>
fractalTop = f_fractalize(src) > 0 and (useLimits ? src >= topLimit : true) ? src : na
fractalBot = f_fractalize(src) < 0 and (useLimits ? src <= botLimit : true) ? src : na
highPrev = valuewhen(fractalTop, src , 0)
highPrice = valuewhen(fractalTop, high , 0)
lowPrev = valuewhen(fractalBot, src , 0)
lowPrice = valuewhen(fractalBot, low , 0)
bearSignal = fractalTop and high > highPrice and src < highPrev
bullSignal = fractalBot and low < lowPrice and src > lowPrev
bearDivHidden = fractalTop and high < highPrice and src > highPrev
bullDivHidden = fractalBot and low > lowPrice and src < lowPrev
// RSI+MFI
f_rsimfi(_period, _multiplier, _tf) => security(syminfo.tickerid, _tf, sma(((close - open) / (high - low)) * _multiplier, _period) - rsiMFIPosY)
// WaveTrend
f_wavetrend(src, chlen, avg, malen, tf) =>
tfsrc = security(syminfo.tickerid, tf, src)
esa = ema(tfsrc, chlen)
de = ema(abs(tfsrc - esa), chlen)
ci = (tfsrc - esa) / (0.015 * de)
wt1 = security(syminfo.tickerid, tf, ema(ci, avg))
wt2 = security(syminfo.tickerid, tf, sma(wt1, malen))
wtVwap = wt1 - wt2
wtOversold = wt2 <= osLevel
wtOverbought = wt2 >= obLevel
wtCross = cross(wt1, wt2)
wtCrossUp = wt2 - wt1 <= 0
wtCrossDown = wt2 - wt1 >= 0
wtCrosslast = cross(wt1 , wt2 )
wtCrossUplast = wt2 - wt1 <= 0
wtCrossDownlast = wt2 - wt1 >= 0
// Schaff Trend Cycle
f_tc(src, length, fastLength, slowLength) =>
ema1 = ema(src, fastLength)
ema2 = ema(src, slowLength)
macdVal = ema1 - ema2
alpha = lowest(macdVal, length)
beta = highest(macdVal, length) - alpha
gamma = (macdVal - alpha) / beta * 100
gamma := beta > 0 ? gamma : nz(gamma )
delta = gamma
delta := na(delta ) ? delta : delta + tcfactor * (gamma - delta )
epsilon = lowest(delta, length)
zeta = highest(delta, length) - epsilon
eta = (delta - epsilon) / zeta * 100
eta := zeta > 0 ? eta : nz(eta )
stcReturn = eta
stcReturn := na(stcReturn ) ? stcReturn : stcReturn + tcfactor * (eta - stcReturn )
stcReturn
// Stochastic RSI
f_stochrsi(_src, _stochlen, _rsilen, _smoothk, _smoothd, _log, _avg) =>
src = _log ? log(_src) : _src
rsi = rsi(src, _rsilen)
kk = sma(stoch(rsi, rsi, rsi, _stochlen), _smoothk)
d1 = sma(kk, _smoothd)
avg_1 = avg(kk, d1)
k = _avg ? avg_1 : kk
// MACD
f_macd(src, fastlen, slowlen, sigsmooth, tf) =>
fast_ma = security(syminfo.tickerid, tf, ema(src, fastlen))
slow_ma = security(syminfo.tickerid, tf, ema(src, slowlen))
macd = fast_ma - slow_ma,
signal = security(syminfo.tickerid, tf, sma(macd, sigsmooth))
hist = macd - signal
// MACD Colors on WT
f_macdWTColors(tf) =>
hrsimfi = f_rsimfi(rsiMFIperiod, rsiMFIMultiplier, tf)
= f_macd(close, 28, 42, 9, macdWTColorsTF)
macdup = macd >= signal
macddown = macd <= signal
macdWT1Color = macdup ? hrsimfi > 0 ? colormacdWT1c : colormacdWT1a : macddown ? hrsimfi < 0 ? colormacdWT1d : colormacdWT1b : na
macdWT2Color = macdup ? hrsimfi < 0 ? colormacdWT2c : colormacdWT2a : macddown ? hrsimfi < 0 ? colormacdWT2d : colormacdWT2b : na
// Get higher timeframe candle
f_getTFCandle(_tf) =>
_open = security(heikinashi(syminfo.tickerid), _tf, open, barmerge.gaps_off, barmerge.lookahead_on)
_close = security(heikinashi(syminfo.tickerid), _tf, close, barmerge.gaps_off, barmerge.lookahead_on)
_high = security(heikinashi(syminfo.tickerid), _tf, high, barmerge.gaps_off, barmerge.lookahead_on)
_low = security(heikinashi(syminfo.tickerid), _tf, low, barmerge.gaps_off, barmerge.lookahead_on)
hl2 = (_high + _low) / 2.0
newBar = change(_open)
candleBodyDir = _close > _open
// Sommi flag
f_findSommiFlag(tf, wt1, wt2, rsimfi, wtCross, wtCrossUp, wtCrossDown) =>
= f_wavetrend(wtMASource, wtChannelLen, wtAverageLen, wtMALen, tf)
bearPattern = rsimfi < soomiRSIMFIBearLevel and
wt2 > soomiFlagWTBearLevel and
wtCross and
wtCrossDown and
hwtVwap < sommiVwapBearLevel
bullPattern = rsimfi > soomiRSIMFIBullLevel and
wt2 < soomiFlagWTBullLevel and
wtCross and
wtCrossUp and
hwtVwap > sommiVwapBullLevel
f_findSommiDiamond(tf, tf2, wt1, wt2, wtCross, wtCrossUp, wtCrossDown) =>
= f_getTFCandle(tf)
= f_getTFCandle(tf2)
bearPattern = wt2 >= soomiDiamondWTBearLevel and
wtCross and
wtCrossDown and
not candleBodyDir and
not candleBodyDir2
bullPattern = wt2 <= soomiDiamondWTBullLevel and
wtCross and
wtCrossUp and
candleBodyDir and
candleBodyDir2
// } FUNCTIONS
// CALCULATE INDICATORS {
// RSI
rsi = rsi(rsiSRC, rsiLen)
rsiColor = rsi <= rsiOversold ? colorGreen : rsi >= rsiOverbought ? colorRed : colorPurple
// RSI + MFI Area
rsiMFI = f_rsimfi(rsiMFIperiod, rsiMFIMultiplier, timeframe.period)
rsiMFIColor = rsiMFI > 0 ? #3ee145 : #ff3d2e
// Calculates WaveTrend
= f_wavetrend(wtMASource, wtChannelLen, wtAverageLen, wtMALen, timeframe.period)
// Stochastic RSI
= f_stochrsi(stochSRC, stochLen, stochRsiLen, stochKSmooth, stochDSmooth, stochUseLog, stochAvg)
// Schaff Trend Cycle
tcVal = f_tc(tcSRC, tclength, tcfastLength, tcslowLength)
// Sommi flag
= f_findSommiFlag(sommiVwapTF, wt1, wt2, rsiMFI, wtCross, wtCrossUp, wtCrossDown)
//Sommi diamond
= f_findSommiDiamond(sommiHTCRes, sommiHTCRes2, wt1, wt2, wtCross, wtCrossUp, wtCrossDown)
// macd colors
= f_macdWTColors(macdWTColorsTF)
// WT Divergences
= f_findDivs(wt2, wtDivOBLevel, wtDivOSLevel, true)
= f_findDivs(wt2, wtDivOBLevel_add, wtDivOSLevel_add, true)
= f_findDivs(wt2, 0, 0, false)
wtBearDivHidden_ = showHiddenDiv_nl ? wtBearDivHidden_nl : wtBearDivHidden
wtBullDivHidden_ = showHiddenDiv_nl ? wtBullDivHidden_nl : wtBullDivHidden
wtBearDivColor = (wtShowDiv and wtBearDiv) or (wtShowHiddenDiv and wtBearDivHidden_) ? colorRed : na
wtBullDivColor = (wtShowDiv and wtBullDiv) or (wtShowHiddenDiv and wtBullDivHidden_) ? colorGreen : na
wtBearDivColor_add = (wtShowDiv and (wtDivOBLevel_addshow and wtBearDiv_add)) or (wtShowHiddenDiv and (wtDivOBLevel_addshow and wtBearDivHidden_add)) ? #9a0202 : na
wtBullDivColor_add = (wtShowDiv and (wtDivOBLevel_addshow and wtBullDiv_add)) or (wtShowHiddenDiv and (wtDivOBLevel_addshow and wtBullDivHidden_add)) ? #1b5e20 : na
// RSI Divergences
= f_findDivs(rsi, rsiDivOBLevel, rsiDivOSLevel, true)
= f_findDivs(rsi, 0, 0, false)
rsiBearDivHidden_ = showHiddenDiv_nl ? rsiBearDivHidden_nl : rsiBearDivHidden
rsiBullDivHidden_ = showHiddenDiv_nl ? rsiBullDivHidden_nl : rsiBullDivHidden
rsiBearDivColor = (rsiShowDiv and rsiBearDiv) or (rsiShowHiddenDiv and rsiBearDivHidden_) ? colorRed : na
rsiBullDivColor = (rsiShowDiv and rsiBullDiv) or (rsiShowHiddenDiv and rsiBullDivHidden_) ? colorGreen : na
// Stoch Divergences
= f_findDivs(stochK, 0, 0, false)
stochBearDivColor = (stochShowDiv and stochBearDiv) or (stochShowHiddenDiv and stochBearDivHidden) ? colorRed : na
stochBullDivColor = (stochShowDiv and stochBullDiv) or (stochShowHiddenDiv and stochBullDivHidden) ? colorGreen : na
// Small Circles WT Cross
signalColor = wt2 - wt1 > 0 ? color.red : color.lime
// Buy signal.
buySignal = wtCross and wtCrossUp and wtOversold
buySignalDiv = (wtShowDiv and wtBullDiv) or
(wtShowDiv and wtBullDiv_add) or
(stochShowDiv and stochBullDiv) or
(rsiShowDiv and rsiBullDiv)
buySignalDiv_color = wtBullDiv ? colorGreen :
wtBullDiv_add ? color.new(colorGreen, 60) :
rsiShowDiv ? colorGreen : na
// Sell signal
sellSignal = wtCross and wtCrossDown and wtOverbought
sellSignalDiv = (wtShowDiv and wtBearDiv) or
(wtShowDiv and wtBearDiv_add) or
(stochShowDiv and stochBearDiv) or
(rsiShowDiv and rsiBearDiv)
sellSignalDiv_color = wtBearDiv ? colorRed :
wtBearDiv_add ? color.new(colorRed, 60) :
rsiBearDiv ? colorRed : na
// Gold Buy
lastRsi = valuewhen(wtFractalBot, rsi , 0)
wtGoldBuy = ((wtShowDiv and wtBullDiv) or (rsiShowDiv and rsiBullDiv)) and
wtLow_prev <= osLevel3 and
wt2 > osLevel3 and
wtLow_prev - wt2 <= -5 and
lastRsi < 30
// } CALCULATE INDICATORS
// DRAW {
bgcolor(darkMode ? color.new(#000000, 80) : na)
zLine = plot(0, color = color.new(colorWhite, 50))
// MFI BAR
rsiMfiBarTopLine = plot(rsiMFIShow ? -95 : na, title = 'MFI Bar TOP Line', transp = 100)
rsiMfiBarBottomLine = plot(rsiMFIShow ? -99 : na, title = 'MFI Bar BOTTOM Line', transp = 100)
fill(rsiMfiBarTopLine, rsiMfiBarBottomLine, title = 'MFI Bar Colors', color = rsiMFIColor, transp = 75)
// WT Areas
plot(wtShow ? wt1 : na, style = plot.style_area, title = 'WT Wave 1', color = macdWTColorsShow ? macdWT1Color : colorWT1, transp = 0)
plot(wtShow ? wt2 : na, style = plot.style_area, title = 'WT Wave 2', color = macdWTColorsShow ? macdWT2Color : darkMode ? colorWT2_ : colorWT2 , transp = 20)
// VWAP
plot(vwapShow ? wtVwap : na, title = 'VWAP', color = colorYellow, style = plot.style_area, linewidth = 2, transp = 45)
// MFI AREA
rsiMFIplot = plot(rsiMFIShow ? rsiMFI: na, title = 'RSI+MFI Area', color = rsiMFIColor, transp = 20)
fill(rsiMFIplot, zLine, rsiMFIColor, transp = 40)
// WT Div
plot(series = wtFractalTop ? wt2 : na, title = 'WT Bearish Divergence', color = wtBearDivColor, linewidth = 2, offset = -2)
plot(series = wtFractalBot ? wt2 : na, title = 'WT Bullish Divergence', color = wtBullDivColor, linewidth = 2, offset = -2)
// WT 2nd Div
plot(series = wtFractalTop_add ? wt2 : na, title = 'WT 2nd Bearish Divergence', color = wtBearDivColor_add, linewidth = 2, offset = -2)
plot(series = wtFractalBot_add ? wt2 : na, title = 'WT 2nd Bullish Divergence', color = wtBullDivColor_add, linewidth = 2, offset = -2)
// RSI
plot(rsiShow ? rsi : na, title = 'RSI', color = rsiColor, linewidth = 2, transp = 25)
// RSI Div
plot(series = rsiFractalTop ? rsi : na, title='RSI Bearish Divergence', color = rsiBearDivColor, linewidth = 1, offset = -2)
plot(series = rsiFractalBot ? rsi : na, title='RSI Bullish Divergence', color = rsiBullDivColor, linewidth = 1, offset = -2)
// Stochastic RSI
stochKplot = plot(stochShow ? stochK : na, title = 'Stoch K', color = color.new(#21baf3, 0), linewidth = 2)
stochDplot = plot(stochShow ? stochD : na, title = 'Stoch D', color = color.new(#673ab7, 60), linewidth = 1)
stochFillColor = stochK >= stochD ? color.new(#21baf3, 75) : color.new(#673ab7, 60)
fill(stochKplot, stochDplot, title='KD Fill', color=stochFillColor)
// Stoch Div
plot(series = stochFractalTop ? stochK : na, title='Stoch Bearish Divergence', color = stochBearDivColor, linewidth = 1, offset = -2)
plot(series = stochFractalBot ? stochK : na, title='Stoch Bullish Divergence', color = stochBullDivColor, linewidth = 1, offset = -2)
// Schaff Trend Cycle
plot(tcLine ? tcVal : na, color = color.new(#673ab7, 25), linewidth = 2, title = "Schaff Trend Cycle 1")
plot(tcLine ? tcVal : na, color = color.new(colorWhite, 50), linewidth = 1, title = "Schaff Trend Cycle 2")
// Draw Overbought & Oversold lines
//plot(obLevel, title = 'Over Bought Level 1', color = colorWhite, linewidth = 1, style = plot.style_circles, transp = 85)
plot(obLevel2, title = 'Over Bought Level 2', color = colorWhite, linewidth = 1, style = plot.style_stepline, transp = 85)
plot(obLevel3, title = 'Over Bought Level 3', color = colorWhite, linewidth = 1, style = plot.style_circles, transp = 95)
//plot(osLevel, title = 'Over Sold Level 1', color = colorWhite, linewidth = 1, style = plot.style_circles, transp = 85)
plot(osLevel2, title = 'Over Sold Level 2', color = colorWhite, linewidth = 1, style = plot.style_stepline, transp = 85)
// Sommi flag
plotchar(sommiFlagShow and sommiBearish ? 108 : na, title = 'Sommi bearish flag', char='⚑', color = colorPink, location = location.absolute, size = size.tiny, transp = 0)
plotchar(sommiFlagShow and sommiBullish ? -108 : na, title = 'Sommi bullish flag', char='⚑', color = colorBluelight, location = location.absolute, size = size.tiny, transp = 0)
plot(sommiShowVwap ? ema(hvwap, 3) : na, title = 'Sommi higher VWAP', color = colorYellow, linewidth = 2, style = plot.style_line, transp = 15)
// Sommi diamond
plotchar(sommiDiamondShow and sommiBearishDiamond ? 108 : na, title = 'Sommi bearish diamond', char='◆', color = colorPink, location = location.absolute, size = size.tiny, transp = 0)
plotchar(sommiDiamondShow and sommiBullishDiamond ? -108 : na, title = 'Sommi bullish diamond', char='◆', color = colorBluelight, location = location.absolute, size = size.tiny, transp = 0)
// Circles
plot(wtCross ? wt2 : na, title = 'Buy and sell circle', color = signalColor, style = plot.style_circles, linewidth = 3, transp = 15)
plotchar(wtBuyShow and buySignal ? -107 : na, title = 'Buy circle', char='·', color = colorGreen, location = location.absolute, size = size.small, transp = 50)
plotchar(wtSellShow and sellSignal ? 105 : na , title = 'Sell circle', char='·', color = colorRed, location = location.absolute, size = size.small, transp = 50)
plotchar(wtDivShow and buySignalDiv ? -106 : na, title = 'Divergence buy circle', char='•', color = buySignalDiv_color, location = location.absolute, size = size.small, offset = -2, transp = 15)
plotchar(wtDivShow and sellSignalDiv ? 106 : na, title = 'Divergence sell circle', char='•', color = sellSignalDiv_color, location = location.absolute, size = size.small, offset = -2, transp = 15)
plotchar(wtGoldBuy and wtGoldShow ? -106 : na, title = 'Gold buy gold circle', char='•', color = colorOrange, location = location.absolute, size = size.small, offset = -2, transp = 15)
// } DRAW
// ALERTS {
// BUY
alertcondition(buySignal, 'Buy (Big green circle)', 'Green circle WaveTrend Oversold')
alertcondition(buySignalDiv, 'Buy (Big green circle + Div)', 'Buy & WT Bullish Divergence & WT Overbought')
alertcondition(wtGoldBuy, 'GOLD Buy (Big GOLDEN circle)', 'Green & GOLD circle WaveTrend Overbought')
alertcondition(sommiBullish or sommiBullishDiamond, 'Sommi bullish flag/diamond', 'Blue flag/diamond')
alertcondition(wtCross and wtCrossUp, 'Buy (Small green dot)', 'Buy small circle')
// SELL
alertcondition(sommiBearish or sommiBearishDiamond, 'Sommi bearish flag/diamond', 'Purple flag/diamond')
alertcondition(sellSignal, 'Sell (Big red circle)', 'Red Circle WaveTrend Overbought')
alertcondition(sellSignalDiv, 'Sell (Big red circle + Div)', 'Buy & WT Bearish Divergence & WT Overbought')
alertcondition(wtCross and wtCrossDown, 'Sell (Small red dot)', 'Sell small circle')
// } ALERTS

TradingBeastOB// This source code is subject to the terms of the Mozilla Public License 2.0 at mozilla.org
// © tradingbeasts
// This experimental Indicator helps identifying instituational Order Blocks.
// Often these blocks signal the beginning of a strong move, but there is a significant probability that these price levels will be revisited at a later point in time again.
// Therefore these are interesting levels to place limit orders (Buy Orders for Bullish OB / Sell Orders for Bearish OB).
//
// A Bullish Order block is defined as the last down candle before a sequence of up candles. (Relevant price range "Open" to "Low" is marked) / Optionally full range "High" to "Low"
// A Bearish Order Block is defined as the last up candle before a sequence of down candles. (Relevant price range "Open" to "High" is marked) / Optionally full range "High" to "Low"
//
// In the settings the number of required sequential candles can be adjusted.
// Furthermore a %-threshold can be entered. It defines which %-change the sequential move needs to achieve in order to identify a relevant Order Block.
// Channels for the last Bullish/Bearish Block can be shown/hidden.
//
// In addition to the upper/lower limits of each Order Block, also the equlibrium (average value) is marked as this is an interesting area for price interaction.
//@version=4
study("BEAST OB Finder", overlay = true)
colors = input(title = "Color Scheme", defval="DARK", options= )
periods = input(5, "Relevant Periods to identify OB") // Required number of subsequent candles in the same direction to identify Order Block
threshold = input(0.0, "Min. Percent move to identify OB", step = 0.1) // Required minimum % move (from potential OB close to last subsequent candle to identify Order Block)
usewicks = input(false, "Use whole range for OB marking?" ) // Display High/Low range for each OB instead of Open/Low for Bullish / Open/High for Bearish
showbull = input(true, "Show latest Bullish Channel?") // Show Channel for latest Bullish OB?
showbear = input(true, "Show latest Bearish Channel?") // Show Channel for latest Bearish OB?
showdocu = input(true, "Show Label for documentation tooltip?") // Show Label which shows documentation as tooltip?
ob_period = periods + 1 // Identify location of relevant Order Block candle
absmove = ((abs(close - close ))/close ) * 100 // Calculate absolute percent move from potential OB to last candle of subsequent candles
relmove = absmove >= threshold // Identify "Relevant move" by comparing the absolute move to the threshold
// Color Scheme
bullcolor = colors == "DARK"? color.white : color.green
bearcolor = colors == "DARK"? color.blue : color.red
// Bullish Order Block Identification
bullishOB = close < open // Determine potential Bullish OB candle (red candle)
int upcandles = 0
for i = 1 to periods
upcandles := upcandles + (close > open ? 1 : 0) // Determine color of subsequent candles (must all be green to identify a valid Bearish OB)
OB_bull = bullishOB and (upcandles == (periods)) and relmove // Identification logic (red OB candle & subsequent green candles)
OB_bull_high = OB_bull? usewicks? high : open : na // Determine OB upper limit (Open or High depending on input)
OB_bull_low = OB_bull? low : na // Determine OB lower limit (Low)
OB_bull_avg = (OB_bull_high + OB_bull_low)/2 // Determine OB middle line
// Bearish Order Block Identification
bearishOB = close > open // Determine potential Bearish OB candle (green candle)
int downcandles = 0
for i = 1 to periods
downcandles := downcandles + (close < open ? 1 : 0) // Determine color of subsequent candles (must all be red to identify a valid Bearish OB)
OB_bear = bearishOB and (downcandles == (periods)) and relmove // Identification logic (green OB candle & subsequent green candles)
OB_bear_high = OB_bear? high : na // Determine OB upper limit (High)
OB_bear_low = OB_bear? usewicks? low : open : na // Determine OB lower limit (Open or Low depending on input)
OB_bear_avg = (OB_bear_low + OB_bear_high)/2 // Determine OB middle line
// Plotting
plotshape(OB_bull, title="Bullish OB", style = shape.triangleup, color = bullcolor, textcolor = bullcolor, size = size.tiny, location = location.belowbar, offset = -ob_period, text = "Bullish OB") // Bullish OB Indicator
bull1 = plot(OB_bull_high, title="Bullish OB open", style = plot.style_linebr, color = bullcolor, offset = -ob_period, linewidth = 3) // Bullish OB Upper Limit
bull2 = plot(OB_bull_low, title="Bullish OB low", style = plot.style_linebr, color = bullcolor, offset = -ob_period, linewidth = 3) // Bullish OB Lower Limit
fill(bull1, bull2, color=bullcolor, transp = 0, title = "Bullish OB fill") // Fill Bullish OB
plotshape(OB_bull_avg, title="Bullish OB Average", style = shape.cross, color = bullcolor, size = size.normal, location = location.absolute, offset = -ob_period) // Bullish OB Average
plotshape(OB_bear, title="Bearish OB", style = shape.triangledown, color = bearcolor, textcolor = bearcolor, size = size.tiny, location = location.abovebar, offset = -ob_period, text = "Bearish OB") // Bearish OB Indicator
bear1 = plot(OB_bear_low, title="Bearish OB open", style = plot.style_linebr, color = bearcolor, offset = -ob_period, linewidth = 3) // Bearish OB Lower Limit
bear2 = plot(OB_bear_high, title="Bearish OB high", style = plot.style_linebr, color = bearcolor, offset = -ob_period, linewidth = 3) // Bearish OB Upper Limit
fill(bear1, bear2, color=bearcolor, transp = 0, title = "Bearish OB fill") // Fill Bearish OB
plotshape(OB_bear_avg, title="Bearish OB Average", style = shape.cross, color = bearcolor, size = size.normal, location = location.absolute, offset = -ob_period) // Bullish OB Average
var line linebull1 = na // Bullish OB average
var line linebull2 = na // Bullish OB open
var line linebull3 = na // Bullish OB low
var line linebear1 = na // Bearish OB average
var line linebear2 = na // Bearish OB high
var line linebear3 = na // Bearish OB open
if OB_bull and showbull
line.delete(linebull1)
linebull1 := line.new(x1 = bar_index, y1 = OB_bull_avg, x2 = bar_index - 1, y2 = OB_bull_avg, extend = extend.left, color = bullcolor, style = line.style_solid, width = 1)
line.delete(linebull2)
linebull2 := line.new(x1 = bar_index, y1 = OB_bull_high, x2 = bar_index - 1, y2 = OB_bull_high, extend = extend.left, color = bullcolor, style = line.style_dashed, width = 1)
line.delete(linebull3)
linebull3 := line.new(x1 = bar_index, y1 = OB_bull_low, x2 = bar_index - 1, y2 = OB_bull_low, extend = extend.left, color = bullcolor, style = line.style_dashed, width = 1)
if OB_bear and showbear
line.delete(linebear1)
linebear1 := line.new(x1 = bar_index, y1 = OB_bear_avg, x2 = bar_index - 1, y2 = OB_bear_avg, extend = extend.left, color = bearcolor, style = line.style_solid, width = 1)
line.delete(linebear2)
linebear2 := line.new(x1 = bar_index, y1 = OB_bear_high, x2 = bar_index - 1, y2 = OB_bear_high, extend = extend.left, color = bearcolor, style = line.style_dashed, width = 1)
line.delete(linebear3)
linebear3 := line.new(x1 = bar_index, y1 = OB_bear_low, x2 = bar_index - 1, y2 = OB_bear_low, extend = extend.left, color = bearcolor, style = line.style_dashed, width = 1)
// === Label for Documentation/Tooltip ===
chper = time - time
chper := change(chper) > 0 ? chper : chper
// === Tooltip text ===
var vartooltip = "Indicator to help identifying instituational Order Blocks. Often these blocks signal the beginning of a strong move, but there is a high probability, that these prices will be revisited at a later point in time again and therefore are interesting levels to place limit orders. \nBullish Order block is the last down candle before a sequence of up candles. \nBearish Order Block is the last up candle before a sequence of down candles. \nIn the settings the number of required sequential candles can be adjusted. \nFurthermore a %-threshold can be entered which the sequential move needs to achieve in order to validate a relevant Order Block. \nChannels for the last Bullish/Bearish Block can be shown/hidden."
// === Print Label ===
var label l_docu = na
label.delete(l_docu)
if showdocu
l_docu := label.new(x = time + chper * 35, y = close, text = "DOCU OB", color=color.gray, textcolor=color.white, style=label.style_label_center, xloc = xloc.bar_time, yloc=yloc.price, size=size.tiny, textalign = text.align_left, tooltip = vartooltip)
//plot(OB_bull ? 1.0 : OB_bear ? -1.0 : 0.0, "Output", transp=100)

How-to use Ichimoku Cloud to find out swing entries?The Ichimoku Cloud is a technical analysis indicator used to identify potential trend reversals, support and resistance levels, and generate entry and exit signals in financial markets. It was developed by a Japanese journalist named Goichi Hosoda, who went by the pen name Ichimoku Sanjin.
The Ichimoku Cloud consists of several components, including the Tenkan-sen (Conversion Line), Kijun-sen (Base Line), Senkou Span A (Leading Span A), Senkou Span B (Leading Span B), and the Cloud. The Tenkan-sen and Kijun-sen lines are calculated based on the average of the highest high and lowest low over a specific period of time. The Senkou Span A is the average of the Tenkan-sen and Kijun-sen, plotted ahead of the current price. The Senkou Span B is calculated based on the average of the highest high and lowest low over a longer period of time, also plotted ahead of the current price. The Cloud is the area between Senkou Span A and Senkou Span B and is often used to identify potential support and resistance levels.
The Ichimoku Cloud with Entry Signals script provided above is a TradingView Pine script that plots the Ichimoku Cloud on a chart, along with entry signals. The entry signals are generated based on the crossover and crossunder of the Tenkan-sen and Kijun-sen lines, as well as the relationship of the closing price with Senkou Span A and Senkou Span B. When the conditions for a long entry signal are met, a green triangle-up shape is plotted below the price bars. Conversely, when the conditions for a short entry signal are met, a red triangle-down shape is plotted above the price bars.
It's important to note that the Ichimoku Cloud is a versatile indicator that can be used in various ways, including identifying trends, determining support and resistance levels, and generating entry and exit signals. Traders and investors often use it in conjunction with other technical analysis tools and indicators to make informed trading decisions.
This piece of code is a TradingView indicator script used to plot Ichimoku Cloud and display entry signals. It is written in Pine Script language.
First, the `indicator` function is used to set the title and short title of the indicator and overlay it on the main chart.
Next, two parameters `tenkanPeriod` and `kijunPeriod` are defined to represent the calculation period of Tenkan-sen (Conversion Line) and Kijun-sen (Base Line) respectively. Then, the `ta.sma` function is used to calculate the values of Tenkan-sen and Kijun-sen, and they are plotted on the chart using the `plot` function.
After that, the value of Senkou Span A (Leading Span A) is calculated using the `math.avg` function, and it is plotted on the chart using the `plot` function. Similarly, the value of Senkou Span B (Leading Span B) is calculated and plotted.
Then, the `fill` function is used to fill the area between Senkou Span A and Senkou Span B with color, forming the cloud.
Finally, entry signals are determined based on certain conditions. If the conditions are met, the `plotshape` function is called to plot arrow shapes at the corresponding positions to represent entry points.

Amiriiiiiii//@version=4
study("Supertrend", overlay = true, format=format.price, precision=2, resolution="")
Periods = input(title="ATR Period", type=input.integer, defval=10)
src = input(hl2, title="Source")
Multiplier = input(title="ATR Multiplier", type=input.float, step=0.1, defval=3.0)
changeATR= input(title="Change ATR Calculation Method ?", type=input.bool, defval=true)
showsignals = input(title="Show Buy/Sell Signals ?", type=input.bool, defval=true)
highlighting = input(title="Highlighter On/Off ?", type=input.bool, defval=true)
atr2 = sma(tr, Periods)
atr= changeATR ? atr(Periods) : atr2
up=src-(Multiplier*atr)
up1 = nz(up ,up)
up := close > up1 ? max(up,up1) : up
dn=src+(Multiplier*atr)
dn1 = nz(dn , dn)
dn := close < dn1 ? min(dn, dn1) : dn
trend = 1
trend := nz(trend , trend)
trend := trend == -1 and close > dn1 ? 1 : trend == 1 and close < up1 ? -1 : trend
upPlot = plot(trend == 1 ? up : na, title="Up Trend", style=plot.style_linebr, linewidth=2, color=color.green)
buySignal = trend == 1 and trend == -1
plotshape(buySignal ? up : na, title="UpTrend Begins", location=location.absolute, style=shape.circle, size=size.tiny, color=color.green, transp=0)
plotshape(buySignal and showsignals ? up : na, title="Buy", text="Buy", location=location.absolute, style=shape.labelup, size=size.tiny, color=color.green, textcolor=color.white, transp=0)
dnPlot = plot(trend == 1 ? na : dn, title="Down Trend", style=plot.style_linebr, linewidth=2, color=color.red)
sellSignal = trend == -1 and trend == 1
plotshape(sellSignal ? dn : na, title="DownTrend Begins", location=location.absolute, style=shape.circle, size=size.tiny, color=color.red, transp=0)
plotshape(sellSignal and showsignals ? dn : na, title="Sell", text="Sell", location=location.absolute, style=shape.labeldown, size=size.tiny, color=color.red, textcolor=color.white, transp=0)
mPlot = plot(ohlc4, title="", style=plot.style_circles, linewidth=0)
longFillColor = highlighting ? (trend == 1 ? color.green : color.white) : color.white
shortFillColor = highlighting ? (trend == -1 ? color.red : color.white) : color.white
fill(mPlot, upPlot, title="UpTrend Highligter", color=longFillColor)
fill(mPlot, dnPlot, title="DownTrend Highligter", color=shortFillColor)
alertcondition(buySignal, title="SuperTrend Buy", message="SuperTrend Buy!")
alertcondition(sellSignal, title="SuperTrend Sell", message="SuperTrend Sell!")
changeCond = trend != trend
alertcondition(changeCond, title="SuperTrend Direction Change", message="SuperTrend has changed direction!")

BUY SELL DEVEN //@version=4
study("DEVEN DESAI ", overlay = true)
Periods = input(title="ATR Period", type=input.integer, defval=10)
src = input(hl2, title="Source")
Multiplier = input(title="ATR Multiplier", type=input.float, step=0.1, defval=2)
changeATR= input(title="Change ATR Calculation Method ?", type=input.bool, defval=true)
showsignals = input(title="Show Buy/Sell Signals ?", type=input.bool, defval=true)
highlighting = input(title="Highlighter On/Off ?", type=input.bool, defval=true)
atr2 = sma(tr, Periods)
atr= changeATR ? atr(Periods) : atr2
up=src-(Multiplier*atr)
up1 = nz(up ,up)
up := close > up1 ? max(up,up1) : up
dn=src+(Multiplier*atr)
dn1 = nz(dn , dn)
dn := close < dn1 ? min(dn, dn1) : dn
trend = 1
trend := nz(trend , trend)
trend := trend == -1 and close > dn1 ? 1 : trend == 1 and close < up1 ? -1 : trend
upPlot = plot(trend == 1 ? up : na, title="Up Trend", style=plot.style_linebr, linewidth=2, color=color.green)
buySignal = trend == 1 and trend == -1
plotshape(buySignal ? up : na, title="UpTrend Begins", location=location.absolute, style=shape.circle, size=size.tiny, color=color.green, transp=0)
plotshape(buySignal and showsignals ? up : na, title="Buy", text="Buy", location=location.absolute, style=shape.labelup, size=size.tiny, color=color.green, textcolor=color.white, transp=0)
dnPlot = plot(trend == 1 ? na : dn, title="Down Trend", style=plot.style_linebr, linewidth=2, color=color.red)
sellSignal = trend == -1 and trend == 1
plotshape(sellSignal ? dn : na, title="DownTrend Begins", location=location.absolute, style=shape.circle, size=size.tiny, color=color.red, transp=0)
plotshape(sellSignal and showsignals ? dn : na, title="Sell", text="Sell", location=location.absolute, style=shape.labeldown, size=size.tiny, color=color.red, textcolor=color.white, transp=0)
mPlot = plot(ohlc4, title="", style=plot.style_circles, linewidth=0)
longFillColor = highlighting ? (trend == 1 ? color.green : color.white) : color.white
shortFillColor = highlighting ? (trend == -1 ? color.red : color.white) : color.white
fill(mPlot, upPlot, title="UpTrend Highligter", color=longFillColor)
fill(mPlot, dnPlot, title="DownTrend Highligter", color=shortFillColor)
alertcondition(buySignal, title="SuperTrend Buy", message="SuperTrend Buy!")
alertcondition(sellSignal, title="SuperTrend Sell", message="SuperTrend Sell!")
changeCond = trend != trend
alertcondition(changeCond, title="SuperTrend Direction Change", message="SuperTrend has changed direction!")

Trend study("Trend Rainbow", overlay=true)
sae = input(true, title="Show Aggressive Entry?, Or Use as Alert To Potential Conservative Entry?")
sce = input(true, title="Show Conservative Entry?")
st = input(true, title="Show Trend Arrows at Top and Bottom of Screen?")
def = input(false, title="Only Choose 1 - Either Conservative Entry Arrows or 'B'-'S' Letters")
pa = input(true, title="Show Conservative Entry Arrows?")
sl = input(false, title="Show 'B'-'S' Letters?")
//EMA Definitions
emaSlow = ema(close, 62)
emaFast = ema(close, 38)
//Aggressive Entry or Alert To Potential Trade
pullbackUpT() => emaFast > emaSlow and close < emaFast
pullbackDnT() => emaFast < emaSlow and close > emaFast
//Conservative Entry Code For Highlight Bars
entryUpT() => emaFast > emaSlow and close < emaFast and close > emaFast
entryDnT() => emaFast < emaSlow and close > emaFast and close < emaFast
//Conservative Entry True/False Condition
entryUpTrend = emaFast > emaSlow and close < emaFast and close > emaFast ? 1 : 0
entryDnTrend = emaFast < emaSlow and close > emaFast and close < emaFast ? 1 : 0
//Define Up and Down Trend for Trend Arrows at Top and Bottom of Screen
upTrend = emaFast >= emaSlow
downTrend = emaFast < emaSlow
//Definition for Conseervative Entry Up and Down PlotArrows
codiff = entryUpTrend == 1 ? entryUpTrend : 0
codiff2 = entryDnTrend == 1 ? entryDnTrend : 0
//Color definition for Moving Averages
col = emaFast > emaSlow ? lime : emaFast < emaSlow ? red : yellow
//Moving Average Plots and Fill
p1 = plot(emaSlow, title="Slow MA", style=linebr, linewidth=4, color=col)
p2 = plot(emaFast, title="Slow MA", style=linebr, linewidth=2, color=col)
fill(p1, p2, color=silver, transp=50)
//Aggressive Entry, Conservative Entry Highlight Bars
barcolor(sae and pullbackUpT() ? yellow : sae and pullbackDnT() ? yellow : na)
barcolor(sce and entryUpT() ? aqua : sce and entryDnT() ? aqua : na)
//Trend Triangles at Top and Bottom of Screen
plotshape(st and upTrend ? upTrend : na, title="Conservative Buy Entry Triangle",style=shape.triangleup, location=location.bottom, color=lime, transp=0, offset=0)
plotshape(st and downTrend ? downTrend : na, title="Conservative Short Entry Triangle",style=shape.triangledown, location=location.top, color=red, transp=0, offset=0)
//Plot Arrows OR Letters B and S for Buy Sell Signals
plotarrow(pa and codiff ? codiff : na, title="Up Entry Arrow", colorup=lime, maxheight=30, minheight=30, transp=0)
plotarrow(pa and codiff2*-1 ? codiff2*-1 : na, title="Down Entry Arrow", colordown=red, maxheight=30, minheight=30, transp=0)
plotchar(sl and codiff ? low - tr : na, title="Buy Entry", offset=0, char='B', location=location.absolute, color=lime, transp=0)
plotchar(sl and codiff2 ? high + tr : na, title="Short Entry", offset=0, char='S', location=location.absolute, color=red, transp=0)

Trend rastudy("Trend Rainbow", overlay=true)
sae = input(true, title="Show Aggressive Entry?, Or Use as Alert To Potential Conservative Entry?")
sce = input(true, title="Show Conservative Entry?")
st = input(true, title="Show Trend Arrows at Top and Bottom of Screen?")
def = input(false, title="Only Choose 1 - Either Conservative Entry Arrows or 'B'-'S' Letters")
pa = input(true, title="Show Conservative Entry Arrows?")
sl = input(false, title="Show 'B'-'S' Letters?")
//EMA Definitions
emaSlow = ema(close, 62)
emaFast = ema(close, 38)
//Aggressive Entry or Alert To Potential Trade
pullbackUpT() => emaFast > emaSlow and close < emaFast
pullbackDnT() => emaFast < emaSlow and close > emaFast
//Conservative Entry Code For Highlight Bars
entryUpT() => emaFast > emaSlow and close < emaFast and close > emaFast
entryDnT() => emaFast < emaSlow and close > emaFast and close < emaFast
//Conservative Entry True/False Condition
entryUpTrend = emaFast > emaSlow and close < emaFast and close > emaFast ? 1 : 0
entryDnTrend = emaFast < emaSlow and close > emaFast and close < emaFast ? 1 : 0
//Define Up and Down Trend for Trend Arrows at Top and Bottom of Screen
upTrend = emaFast >= emaSlow
downTrend = emaFast < emaSlow
//Definition for Conseervative Entry Up and Down PlotArrows
codiff = entryUpTrend == 1 ? entryUpTrend : 0
codiff2 = entryDnTrend == 1 ? entryDnTrend : 0
//Color definition for Moving Averages
col = emaFast > emaSlow ? lime : emaFast < emaSlow ? red : yellow
//Moving Average Plots and Fill
p1 = plot(emaSlow, title="Slow MA", style=linebr, linewidth=4, color=col)
p2 = plot(emaFast, title="Slow MA", style=linebr, linewidth=2, color=col)
fill(p1, p2, color=silver, transp=50)
//Aggressive Entry, Conservative Entry Highlight Bars
barcolor(sae and pullbackUpT() ? yellow : sae and pullbackDnT() ? yellow : na)
barcolor(sce and entryUpT() ? aqua : sce and entryDnT() ? aqua : na)
//Trend Triangles at Top and Bottom of Screen
plotshape(st and upTrend ? upTrend : na, title="Conservative Buy Entry Triangle",style=shape.triangleup, location=location.bottom, color=lime, transp=0, offset=0)
plotshape(st and downTrend ? downTrend : na, title="Conservative Short Entry Triangle",style=shape.triangledown, location=location.top, color=red, transp=0, offset=0)
//Plot Arrows OR Letters B and S for Buy Sell Signals
plotarrow(pa and codiff ? codiff : na, title="Up Entry Arrow", colorup=lime, maxheight=30, minheight=30, transp=0)
plotarrow(pa and codiff2*-1 ? codiff2*-1 : na, title="Down Entry Arrow", colordown=red, maxheight=30, minheight=30, transp=0)
plotchar(sl and codiff ? low - tr : na, title="Buy Entry", offset=0, char='B', location=location.absolute, color=lime, transp=0)
plotchar(sl and codiff2 ? high + tr : na, title="Short Entry", offset=0, char='S', location=location.absolute, color=red, transp=0)

DrippytimeFilter = input.timeframe(title = "Cutoff time for indentifying HOD/LOD zone (EST). Recommended 9:30-11:30 AM EST", defval = "0930-1130", options = )
fastMAInput = input(title='Fast EMA Period', defval=9)
slowMAInput = input(title='Slow EMA Period', defval=21)
midMAInput = input(title='Mid EMA Period', defval=13)
srcHi = input(high, "Source for Highs")
srcLo = input(low, "Source for Lows")
showHi = input(true, "Show HOD breakout zone")
showLo = input(true, "Show LOD breakdown zone")
showCloud = input(true, "Show cloud for breakout and breakdown")
showTrendArrow = input(true, "Show trend arrows for breakout and breakdown")
showCandleMomentum = input(true, "Show candlesticks with strong upside/downside momentum")
upConvictionArrow = showTrendArrow
downConvictionArrow = showTrendArrow
= request.security(syminfo.ticker, "D", , lookahead=barmerge.lookahead_on)
rsi = ta.rsi(close , 14)
rsi5m = request.security(syminfo.tickerid, '5', rsi)
// Check to see if we are in allowed hours using session info on all 7 days of the week.
timeIsBeforeCriteria = time('1', timeFilter + ":1234567", timezone = "America/New_York")
var hiBeforeCriteria = 10e-10
var loBeforeCriteria = 10e10
var startCounting = false
if timeIsBeforeCriteria
// We are entering allowed hours; reset hi/lo.
if not timeIsBeforeCriteria
hiBeforeCriteria := srcHi
loBeforeCriteria := srcLo
else
// We are in allowed hours; track hi/lo.
hiBeforeCriteria := math.max(srcHi,hiBeforeCriteria)
loBeforeCriteria := math.min(srcLo,loBeforeCriteria)
remainingSession = switch timeFilter
'0930-1100' => '1100-1600'
'0930-1130' => '1130-1600'
// Calculate the fast and slow moving averages
fastMA = ta.ema(close, fastMAInput)
slowMA = ta.ema(close, slowMAInput)
midMA = ta.ema(close, midMAInput)
// Average Directional Index (ADX)
= ta.dmi(7, 3)
// Identify sideways market using ADX
sideways = adx < 30
uptrend = th > 30 and th < 70
downtrend = tl >30 and tl < 70
// Fill the price bars with a specific color when ADX is below 20
// barcolor(sideways ? color.purple : na)
barcolor(uptrend and showCandleMomentum? color.rgb(145, 255, 0) : na)
barcolor(downtrend and showCandleMomentum? color.rgb(255, 0, 200) : na)
t1 = time(timeframe.period, remainingSession, "America/New_York")
// Check if the stock is trading above ...
condition1 = close > slowMA and close > dOpen
// Check if the stock is making a new high after time specified by user
condition2 = time >= t1 and close > (hiBeforeCriteria * 1.001) and close > (hiBeforeCriteria * 1.001)
upConvictionArrow := showTrendArrow and th > 25 and condition1 and condition2 and (close > fastMA)
//upConvictionArrow := showTrendArrow and th > 25 and condition1 and condition2 and (close > fastMA) and (low > low )
// plot hi and low at 11
resistanceLowerBound = plot(t1 and showHi ? hiBeforeCriteria: na, style=plot.style_linebr, linewidth=1, color= color.red, title = "HOD lower limit")
resistanceUpperBound = plot(t1 and showHi ? hiBeforeCriteria * 1.001: na, style=plot.style_linebr, linewidth=1, color= color.red, title = "HOD upper limit")
fill(resistanceLowerBound, resistanceUpperBound, color = color.new(color.red, 80), title = "HOD breakout zone")
supportLowerBound = plot(t1 and showLo ? loBeforeCriteria*0.999 : na, style=plot.style_linebr, linewidth=0, color= color.green, title = "LOD lower limit")
supportUpperBound = plot(t1 and showLo ? loBeforeCriteria : na, style=plot.style_linebr, linewidth=0, color= color.green, title = "LOD upper limit")
fill(supportLowerBound, supportUpperBound, color = color.new(color.green, 80), title = "LOD breakdown zone")
fastPlot = plot(condition1 and condition2 and showCloud ? slowMA : na, color=color.new(color.green, 100), style = plot.style_linebr, linewidth = 1, title = "Fast EMA support line")
slowPlot = plot(condition1 and condition2 and showCloud ? fastMA : na, color=color.new(color.green, 100), style = plot.style_linebr, linewidth = 2, title = "Slow EMA support line")
fill(fastPlot, slowPlot, color=color.new(#30ff4c, 75), title = "Breakout support cloud")
plotshape(upConvictionArrow ? 1: 0, style = shape.triangleup, color = color.green, size = size.tiny, location = location.belowbar, title = "Breakout conviction arrow")
// Check if the stock is trading below both moving averages
condition3 = close < slowMA and close < dOpen
condition4 = time >= t1 and close < (loBeforeCriteria * 0.999) and close < (loBeforeCriteria * 0.999)
downConvictionArrow := downConvictionArrow and tl > 25 and condition3 and condition4 and (close < fastMA)
//downConvictionArrow := downConvictionArrow and tl > 25 and condition3 and condition4 and (close < fastMA) and (low < low )
// Combine the conditions and plot the result
fastPlot1 = plot(condition3 and condition4 and showCloud? slowMA : na, color=color.new(color.red, 100), style = plot.style_linebr, linewidth = 1, title = "Fast EMA resistance line")
slowPlot1 = plot(condition3 and condition4 and showCloud? fastMA : na, color=color.new(color.red, 100), style = plot.style_linebr, linewidth = 2, title = "Slow EMA resistance line")
fill(fastPlot1, slowPlot1, color=color.new(#ff0202, 75), title = "Breakdown resistance cloud")
plotshape(downConvictionArrow ? 1: 0, style = shape.triangledown, color = color.red, size = size.tiny, location = location.abovebar, title = "Breakdown conviction arrow")
