Thoughts on this 12345 Elliott Wave plot?So going off of my first published idea of the Flat 3-3-5 ABC Correction from June 16 to Oct 27, I've read that flats are typically found in the 4th wave position of the Elliott Impulse Wave pattern. If that's the case, then we should be looking at wave 5 next for AMP, which lines up with the EOY to Q1 2022 Altseason that's coming.
What I've been trying to figure out is where Waves 1, 2, and 3 should be plotted. I think the Coinbase listing effect in June disrupted the waves structure a bit because Wave 3 should've been in May when AMP hit an ATH of $0.0785. But where I've plotted Wave 3 now lines up with the ABC correction from June to October. I also tried plotting Wave 1 to the peak on Feb 12 and Wave 2 to the low on Mar 9, but that would break the rule where Wave 4 is not supposed to be lower than Wave 1.
Would like to hear your thoughts!
Search in ideas for "PLOT"

How to stop line plots once trade is closed?Hi, does anyone know how I would stop the TP/SL lines plotting once the trade is closed? Level plots I use below:
// S/L T/P Line Plots
longStop = na
longStop := shortCondition ? na : longCondition and strategy.position_size <=0 ? close - (atrout * stopMult) : longStop
shortStop = na
shortStop := longCondition ? na : shortCondition and strategy.position_size >=0 ? close + (atrout * stopMult) : shortStop
longTP = na
longTP := shortCondition ? na : longCondition and strategy.position_size <=0 ? close + (atrout * profitMult) : longTP
shortTP = na
shortTP := longCondition ? na : shortCondition and strategy.position_size >=0 ? close - (atrout * profitMult) : shortTP
strategy.exit("Long", "Long", stop=longStop, limit=longTP)
strategy.exit("Short", "Short", stop=shortStop, limit=shortTP)
s1 = plot(longStop, style=linebr, color=red, linewidth=1, title='Long ATR Stop')
s2 = plot(shortStop, style=linebr, color=red, linewidth=1, title='Short ATR Stop')
tp1 = plot(longTP, style=linebr, color=green, linewidth=1, title='Long ATR TP')
tp2 = plot(shortTP, style=linebr, color=green, linewidth=1, title='Short ATR TP')

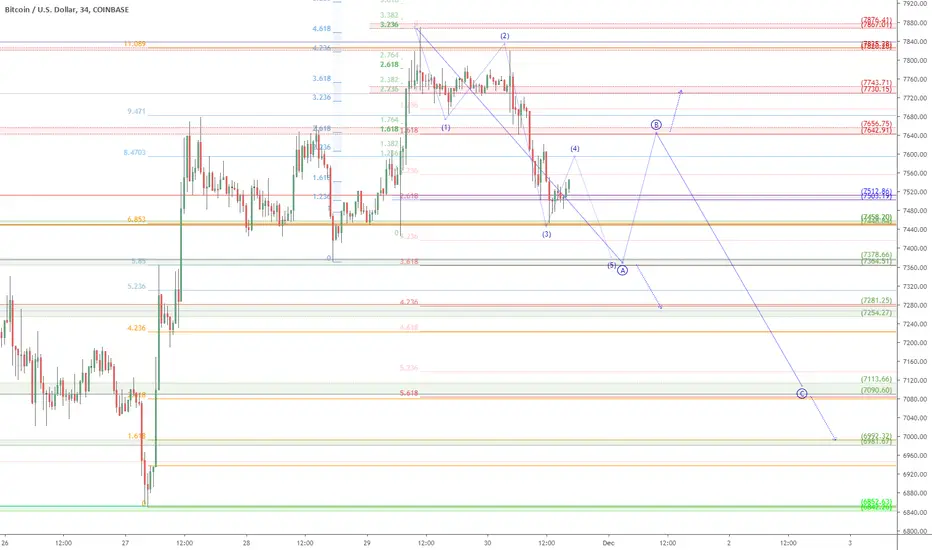
BTC.USD preliminary Retrace plot: Bitcoin pullback Road MapFollowup to my bigger picture plot posted here (click) .
Retrace started exactly where it was "supposed" to (see above link).
The pullback appears to be significant and possibly a big correction.
Question of which wave is retracing (last small one or entire bounce).
An alternate view would be to consider retrace done.
If and when such signs appear, I will try to post as such.
But the exact turn was predicted thus my faith in this one.
$ 7503 - 7513 (blue) is the KEY zone to to confirm or deny the paths.
$ 7642 - 7656 (red) should be pretty strong resistance if retrace is real.
$ 7730 - 7745 (red) is the maximum expected, or the plot is invalid.
Part of my ongoing Bitcoin analysis, been hitting every important turn (click):
7860 Retrace Call
7650 Resistance Map
6850 Bounce plot
5882 critical number
8700 Top Call
21k possible target (still possible)
9k bounce call
14k target call <=Perfect TP
10k target call
7.5k bounce call
3.1k bottom call (EXACT 2018 bottom)
Of course, I have had total FAILS on some ideas too, not going to pretend.
But all of my plots show PRECISE entries, TIGHT stops, and EXACT targets.
Precision is the way of the Fib. Almost every turn happens at a Fib Line.
.
MITH/BTC retrace plot: Mithril mini-bubble? Supports of interestJust quick plot to see how this retrace plays out.
Retrace has been following the red Fib so worth watching.
Nothing really worth trading, unless FOMO takes over.
1100 area might be worth a small gamble.
1000 area would be better given round-ness.
Break below 1000 indicates end of interest.
.
See some of my other ALT coin plots below
FET bounce
ADA breakout
XLM breakout
TRX Support
DASH top
ONT top
Of course, I have had total FAILS on some plots as well, not going to pretend.
But my plans offer PRECISE entries, TIGHT stops losses, and EXACT take profits.
Precision is the way of the Fib. Direction, however, is where the Tader comes in.

Why wont this script actually plot the open and close prices?As you can see on the chart, the open and close prices are not where the lines are. Please help.
Thank you
// This source code is subject to the terms of the Mozilla Public License 2.0 at mozilla.org
// © bradchris24
//@version=4
study("Short Term Levels me", shorttitle="STL", overlay=true)
t = time("1440", "0000-0930")
dclose = security(syminfo.tickerid, "D", close )
dopen = security(syminfo.tickerid, "D", open)
is_first = na(t ) and not na(t) or t < t
ending_hour = input(defval=9, title="Ending Hour", type=input.integer)
ending_minute = input(defval=30, title="Ending Minute", type=input.integer)
day_high = float(na)
if is_first and barstate.isnew and (hour < ending_hour or hour >= 16 or hour == ending_hour and minute < ending_minute)
day_high := high
else
day_high := day_high
if high > day_high and ((hour < ending_hour or hour >= 16) and hour < 16 or hour == ending_hour and minute < ending_minute)
day_high := high
day_high
plot(day_high, style=plot.style_line, color=color.yellow, linewidth=1)
plot(dclose, style=plot.style_line, color=color.green, linewidth=1)
plot(dopen, style=plot.style_line, color=color.red, linewidth=1)

HIGH TIMEFRAME FVG STRIKES AGAINThey say look to the left right? Here we can clearly see the benefits of plotting previous level FVG's on higher timeframes, as well as basic daily liquidity. When plotting like this, it helps in contract selection. As options traders we're looking to make the most out of the market right? Whats sexier than a contract going from like .10 to $200!? By plotting liquidity and FVG's, we are aided in contract selection and it takes a lot of the hoping and wishing out of the trade. Are we sweeping liquidity or not? Are we on track to reach a higher timeframe FVG or not? Make sure you have your contract levels planned prior to market open so you can take advantage of these life changing moves!
My ideal entries. This doesn't always happen but its nice when it does!
- Break of 30m PMKT ORB (initial entry)
- Break of 15m ORB (add)
- Break of 30M ORB (add)
- Break of FVG (SELL!!!)
Just look to the left! Draw the lines, draw the boxes. and don't panic, you got this!
The blue shaded box at the bottom is a previous FVG plotted from the 6HR timeframe

39. JHS and The Dot PlotYesterdays Powell's speech at the JHS carries ONLY one message -> there is NO PIVOT anytime soon. The US02Y seems to agree and promptly move up. It is now hugging around 3.40% which was the Fed Projection for Current Year 2022 as per the 06/2022 Dot Plot. What we can see is that Market is still thinking and awaiting direction as to what it thinks the 09/2022 would look like.
Prior to JHS, market was pricing in 75bps for 09/2022 and 50bps each for 11/2022 and 12/2022. This means market expecting rate hike at a SLOWER pace. Perhaps this would now require reassessment. What is the most important is HOW MUCH the Fed would project for Current Year 2022 in the 09/2022 Dot Plot? In the 06/2022 Dot Plot, Current Year was raised to 3.40% from 1.90%. This is an increase of 1.50%. Anything less than an 1.50% next month would be deemed as a SLOWDOWN in pace. My guess is that they would maintain the SAME PACE and raised current year expectation by 1.50% to 4.90%. And this would potentially gives us another 75bps in 11/2022 and 12/2022. Rates would end near 5.00% this year end!!!!!!
How would this affect EURUSD?
Well, this is easy enough. We would just look at the US02Y closely and wait for the 09/2022 Dot plot. If there would be a MAD DASH for DOLLAR, we would expect EURUSD to rise briefly. Remember, supplies can ONLY be found ABOVE. We should be well aware of the usual playbook. If not, just refer to the price action when the 06/2022 Dot Plot was announced. Price actually MOVED UP 150pips ++ in search of supplies. By now, you should know where to ENTER.
If indeed the Fed is to raise the Current Year by 1.50%, we can really make A LOT OF MONEY. Perhaps I need to sell ALL my bicycles to raise some cash so that I can trade more and make more profit :)
Till next time, have a great weekend.
P/S : As usual, do not just belief what I say. Use your common sense.

GBPJPY - Live Weekly Elliott plotsAs per plotting of the weekly in Advanced Get - we will update these ideas with daily plots.
Disclaimer
This idea does not constitute as financial advice. It is for educational purposes only, our principle trader has over 20 years’ experience in stocks, ETF’s, and Forex. Hence each trade setup might have different hold times, entry or exit conditions, and will vary from the post/idea shared here. You can use the information from this post to make your own trading plan for the instrument discussed. Trading carries a risk; a high percentage of retail traders lose money. Please keep this in mind when entering any trade. Stay safe.

EURJPY - Live Weekly Elliott plotAs per plotting of the weekly in Advanced Get - we will update these ideas with daily plots.
Disclaimer
This idea does not constitute as financial advice. It is for educational purposes only, our principle trader has over 20 years’ experience in stocks, ETF’s, and Forex. Hence each trade setup might have different hold times, entry or exit conditions, and will vary from the post/idea shared here. You can use the information from this post to make your own trading plan for the instrument discussed. Trading carries a risk; a high percentage of retail traders lose money. Please keep this in mind when entering any trade. Stay safe.

GBPUSD - live monthly Elliott PlotAs per plotting of the monthly in Advanced Get - we will update these ideas with weekly & daily plots.
Disclaimer
This idea does not constitute as financial advice. It is for educational purposes only, our principle trader has over 20 years’ experience in stocks, ETF’s, and Forex. Hence each trade setup might have different hold times, entry or exit conditions, and will vary from the post/idea shared here. You can use the information from this post to make your own trading plan for the instrument discussed. Trading carries a risk; a high percentage of retail traders lose money. Please keep this in mind when entering any trade. Stay safe.

EURUSD - Live Weekly Elliott plotAs per plotting of the Weekly in Advanced Get - we will update these ideas & with daily plots.
Disclaimer
This idea does not constitute as financial advice. It is for educational purposes only, our principle trader has over 20 years’ experience in stocks, ETF’s, and Forex. Hence each trade setup might have different hold times, entry or exit conditions, and will vary from the post/idea shared here. You can use the information from this post to make your own trading plan for the instrument discussed. Trading carries a risk; a high percentage of retail traders lose money. Please keep this in mind when entering any trade. Stay safe.

USDJPY - Live Weekly Elliott plotAs per plotting of the Weekly in Advanced Get - we will update these ideas & add daily plots.
Disclaimer
This idea does not constitute as financial advice. It is for educational purposes only, our principle trader has over 20 years’ experience in stocks, ETF’s, and Forex. Hence each trade setup might have different hold times, entry or exit conditions, and will vary from the post/idea shared here. You can use the information from this post to make your own trading plan for the instrument discussed. Trading carries a risk; a high percentage of retail traders lose money. Please keep this in mind when entering any trade. Stay safe.

USDCAD - Live monthly Elliott plotsAs per plotting of the monthly in Advanced Get - we will update these ideas with weekly & daily plots.
Disclaimer
This idea does not constitute as financial advice. It is for educational purposes only, our principle trader has over 20 years’ experience in stocks, ETF’s, and Forex. Hence each trade setup might have different hold times, entry or exit conditions, and will vary from the post/idea shared here. You can use the information from this post to make your own trading plan for the instrument discussed. Trading carries a risk; a high percentage of retail traders lose money. Please keep this in mind when entering any trade. Stay safe.

NZDUSD - Live weekly Elliott plotsAs per plotting of the Weekly in Advanced Get - we will update these ideas with daily plots.
Disclaimer
This idea does not constitute as financial advice. It is for educational purposes only, our principle trader has over 20 years’ experience in stocks, ETF’s, and Forex. Hence each trade setup might have different hold times, entry or exit conditions, and will vary from the post/idea shared here. You can use the information from this post to make your own trading plan for the instrument discussed. Trading carries a risk; a high percentage of retail traders lose money. Please keep this in mind when entering any trade. Stay safe.

AUDUSD - Weekly live Elliott plotAs per plotting of the weekly in Advanced Get - we will update these ideas with daily plots.
Disclaimer
This idea does not constitute as financial advice. It is for educational purposes only, our principle trader has over 20 years’ experience in stocks, ETF’s, and Forex. Hence each trade setup might have different hold times, entry or exit conditions, and will vary from the post/idea shared here. You can use the information from this post to make your own trading plan for the instrument discussed. Trading carries a risk; a high percentage of retail traders lose money. Please keep this in mind when entering any trade. Stay safe.

Called Top and it followed my plots for 48hrs!I knew I was on to something after I called the triple top and it followed suit with the long term bear trend I noticed. It started bouncing around in my channels and ranges as expected, so I drew a plot for shits and giggles. Damn if it didn't start following my plots as I drew them! Went to sleep and it followed everything perfectly for almost a whole day! It only diverged because the Bulls didn't put up as much fight as I thought they would. So it's even weaker. Today had all the signs of a classic bear trap. Dead all day, then an artificial run up in price at cash close to drum up some business and hand the bag to new retail investors. You gotta think bigger, never narrow. From 1min to max chart. To Infinity and Beyond! There's a lot of crazy meta fractal Fibonacci stuff going on here and the charts don't lie!
Even at a lower level it still followed my trend lines from past events, as well as getting general inflection points correct 2 days out. So I think I'm on to something here! What really made me smile is it hitting the same inflection point I called right before another big leg down. It looks like it's going to converge with my path again, perhaps. We'll see. Might be getting too distorted and I need to re-plot. It's possible we make another run back to the 311 area Friday, but I'm still calling it a continuation of the bull trap with lower highs and very low volume. P/C ratio has dropped, so volume will increase rapidly at first when they're convinced we're going back to 3200, that even they don't want to buy at that level themselves. I don't know why it's so hard for them to understand that there is always a limit, both ways, not just the ground. Actually with oil it can go negative, so think on that.

KMD/BTC significant bounce, can it Last? Important Zones plottedNear term look at the strong bounce today.
Bounce wave may have ended at blue 4,236
May hit the 4.618 before significant pullback.
If retrace starts, then keep an eye on the green zones.
Reaction at each fib line and zone will offer more clues.
Or if we surpass the blue 4.618 then I will re-evaluate.
The Purple Fib is from this big picture series:
.
See some of my other plots and trade calls below.
I also plot Forex and Stocks, take a look at my profile page .
BAT top call (still in play)
EOS top Call (near perfect plot)
LTC to $150 call (near perfect plot)
BTC $14k call (Near Perfect target, easy trade)
ETH breakout (instant Profits, no drawdown)
BTC bottom 3.1k (caught the EXACT bottom)
ADA breakout (PERFECT targets, massive profits)
ZRX bottom call (200% gain, Perfect target)
ZRX breakout (massive Profits, short wait)
XLM breakout (massive Profits, instant Win)
RVN top call (Perfect Target, take profits)
LINK re-entry (caught the spike)
MATIC top Warning (caught the EXACT top)
MATIC rocket (massive Profits, breakout entry)
NEO Rocket Launch (great entry, massive profits)
FET top warning (EXACTLY on time)
Of course, I have had total FAILS on some ideas too, not going to pretend.
But all of my plots show PRECISE entries, TIGHT stops, and EXACT targets.
Precision is the way of the Fib. Almost every turn happens at a Fib Line.

XAUUSD correction upon us? Gold Early Support PlotQuick plot to display possible supports.
Gold hit target exactly on my last plot (click) .
Was already looking like a top when news hit.
Perfect timing and price to start a correction.
This leg appears to have some momentum.
I will measure it as it develops and update.
We all knew it was coming, maybe this is it.
We can expect a bounce here, and that will be very telling.
Initial bounce off a support offers clues as to the strength.
I expect dead cat here, then pierced and full to next zone.
1417 is first support, perhaps optimistic at this time.
1415 ought to react strongly, if not, another clue.
1412 is confluence of two key fibs, watch closely.
Previous Analysis:
$1332 bounce
$1320 top call
$1270 bounce
$1280 break
$1380 call <= 4 mos ago
See some of my other Forex calls below.
I also plot Crypto and some Stocks, check my Profile Page .
XAU.USD top call (precise to the Penny)
EUR.USD long call (scalp that ran hard)
XAU.USD bounce call (perfect entry, huge profits)
USD.CAD top Call (warning just in time)
EUR.USD top Call (perfect top, still in play)
GBP.USD dip Call (just in time, quick 70 pips)
Silver Bounce scalp (Perfect entry, still in play)
DXY toping call (Upthrust warning just in time)
SPX recent top (Fib extensions at work)
XAU.USD long to short (recent perfect entries)
USD.JPY short to long (recent perfect entries)
EUR.USD long term Short (the very tippy-top a year ago)
AUD.USD long term Short (almost at a long term target now)
Of course, I have had total FAILS on some plots also, not going to pretend.
But my plans offer PRECISE entries, TIGHT stops, and EXACT take profits.
Precision is the way of the Fib. Almost every turn happens at a Fib Line.

GBPUSD on near term Ledge: GU could fall off, Support zones plotQuick plot of possible GU retrace to continue.
Currently sitting on support at previous lows.
Red Fib series of drop indicates further down.
Dollar is weak, no doubt, but it should retrace more.
Pound is well, the Pound, any news whips it around.
There should be bears waiting for support to break.
1.268x ought to provide a decent little bounce at least.
1.272x is questionable support, strong bull would bounce it.
1.265x looks like solid support, conservative bulls should buy.
See some of my other Forex calls below.
I also plot Crypto and some Stocks, check my Profile Page .
EUR.USD long call (scalp that ran hard)
XAU.USD bounce call (perfect entry, huge profits)
USD.CAD top Call (warning just in time)
EUR.USD top Call (perfect top, still in play)
GBP.USD dip Call (just in time, quick 70 pips)
XAU.USD to $1367? (caught most of the spike)
Silver Bounce scalp (Perfect entry, still in play)
DXY toping call (Upthrust warning just in time)
SPX recent top (Fib extensions at work)
XAU.USD long to short (recent perfect entries)
USD.JPY short to long (recent perfect entries)
EUR.USD long term Short (the very tippy-top a year ago)
AUD.USD long term Short (almost at a long term target now)
Of course, I have had total FAILS on some plots also, not going to pretend.
But my plans offer PRECISE entries, TIGHT stops, and EXACT take profits.
Precision is the way of the Fib. Almost every turn happens at a Fib Line.

LINK.USD poised for a breakout, possible First Target plottedChainLink just keeps on going up and up!
Looks like we are in a "wave 5" final leg.
But first we need to break above resistance.
This is an update to my last Analysis looking for a Break Out. (click) .
Previous LINK analysis:
$2.87 Target Call (perfect exits)
$2.65 Support Call (several long entries)
recent Impulse Redux (caught recent top)
$2.7 target plotted (perfect roadmap)
Support/Bounce zones (caught recent bottom)
Breakout Zones plot (caught the breakout)
May 2019 support zones (caught all turns)
$1.46 Bottom Call (caught exact bottom)
Of course, I have had total FAILS on some ideas too, not going to pretend.
But all of my plots show PRECISE entries, TIGHT stops, and EXACT targets.
Precision is the way of the Fib. Almost every turn happens at a Fib Line.
.

FORD stock in "No-Mans Land". Serious Support Resistance plottedFord stock is currently in "No-Mans Land" so is risky trading.
Above and below are two fib confluences well worth noting.
Break through this floor or ceiling will start it really moving.
Trade War sentiment will of course swing this wildly.
Trump Tweets can move whole sectors dramatically.
Trade Entries should include SL's and news nightly.
Updates to follow upon significant movement.
.
See some of my other plots and trade calls below.
I also plot Forex and Crypto, take a look at my profile page .
SPX bot June 2019
SPX top April 2019
SPX top Oct. 2018
FaceBook bounce
Twitter bounce
NetFlix bounce
Amazon scalp
Gold long
Silver long
Oil long
Of course, I have had total FAILS on some ideas too, not going to pretend.
But all of my plots show PRECISE entries, TIGHT stops, and EXACT targets.
Precision is the way of the Fib. Almost every turn happens at a Fib Line.
.

EUR.USD dipping Exactly as planned: EU short Targets plottedQuick update to my previous "Hunt of Shorts" Idea (click) .
EU bounce exactly up in our Ideal Shorts zone (see above link).
The rejection is clear but is not clear if only from profit taking.
Reactions at the various zones will help gauge retrace strength.
1.10746/753 will hopefully act as resistance now, we are right up to it.
1.10887/924 should be strong resistance now, Stop Losses just above.
1.11082/127 should not be broken, otherwise this is going Bull again.
1.10633/651 is first support, expect a bounce of some sort.
1.10540/559 is first strong support, expect a strong bounce.
1.10391/407 could end the retrace and return to uptrend.
Previous EUR.USD analysis (click) :
1.108 short call
1.102 Long call
1.116 Top Call
EUR.USD short call
EUR.USD bounce plot (found last bottom)
EUR.USD short call (in time, to the Pip)
EUR.USD long call (scalp that ran hard)
EUR.USD short Call (perfect top, huge profits)
EUR.USD trend Short (the exact top a year ago)
Of course, I have had total FAILS on some plots also, not going to pretend.
But my plans offer PRECISE entries, TIGHT stops, and EXACT take profits.
Precision is the way of the Fib. Almost every turn happens at a Fib Line.

NEO.USD hit target Exactly and retracing to where? Supports plotFollow up to my previous Map of Possible Tops (click) .
As you know, NEO has been flying due to China Pres XI's comments.
It has since hit an extended target and started pulling back today.
The EW paths are guesses, but the zones are SOLID: they WILL react.
$11.315-11.374 is first support zone, should bounce a bit.
$10.620-11.766 should be Strong support, may end retrace.
$ 9.969-10.033 will hold if any bull strength remains in market.
.
See some of my other plots and trade calls below.
I also plot Forex and Stocks, take a look at my profile page .
NEO $13.41 top call (to the Penny)
NEO Rocket (great entry, massive profits)
BAT top call (in time and on target)
EOS top Call (near perfect plot)
LTC to $150 call (near perfect plot)
BTC $14k call (Near Perfect target, easy trade)
ETH breakout (instant Profits, no drawdown)
BTC bottom 3.1k (caught the EXACT bottom)
ADA breakout (PERFECT targets, massive profits)
ZRX bottom call (200% gain, Perfect target)
ZRX breakout (massive Profits, short wait)
XLM breakout (massive Profits, instant Win)
RVN top call (Perfect Target, take profits)
LINK re-entry (caught the spike)
MATIC top Warning (caught the EXACT top)
MATIC rocket (massive Profits, breakout entry)
FET top warning (EXACTLY on time)
DASH top warning (EXACTLY on time)
Of course, I have had total FAILS on some ideas too, not going to pretend.
But all of my plots show PRECISE entries, TIGHT stops, and EXACT targets.
Precision is the way of the Fib. Almost every turn happens at a Fib Line.
