USD/CAD - Canadian dollar eyes retail salesThe Canadian dollar is showing limited movement on Thursday. In the North American session, USD/CAD is trading at 1.3474, up 0.09%.
Canada wraps up the week with the retail sales report on Friday. July's retail sales were weak, with a gain of 0.1% m/m and a decline of 0.6% y/y. August is expected to show improvement, with consensus estimates of 0.4% m/m and 0.5% y/y.
The Bank of Canada held the benchmark rate at 5.0% at the September 6th meeting. The BOC's summary of deliberations from that meeting, released on Wednesday, showed that the BoC considered raising rates due to stubbornly high underlying inflation.
In the end, the Governing Council members felt that earlier rate increases were having an effect on economic growth and voted to hold rates. Still, there was a concern that a pause might send the wrong message that the tightening cycle was over and that a cut in rates was coming. The BoC therefore stressed at the meeting that the door remained open to further rate increases and that underlying inflation was not falling fast enough.
The Federal Reserve maintained the benchmark rate at 5.5% at Wednesday's meeting. The Fed delivered a 'hawkish hold', signalling that it planned to keep rates in restrictive territory "higher for longer". This message sent US stock markets lower and US Treasury yields higher on Wednesday, with the US dollar showing short-lived volatility against most of the majors following the decision.
The dot plot from yesterday's meeting indicated that the Fed expects to raise rates once more before the end of the year, the same forecast as in the June dot plot. However, the September dot plot projected trimming rates by 50 basis points in 2024, compared to 100 basis points in the June dot plot. This "higher for longer" approach indicates hawkishness on the part of the Fed, which remains focused on bringing inflation back down to the 2% target.
USD/CAD is testing resistance at 1.3468. The next resistance line is 1.3553
1.3408 and 1.3323 are the next support lines
Search in ideas for "PLOT"

Simple strategy for intraday trading (not a chart analysis)
Herer in this video we have discussed a simple but effective trading strategy with the help of which you can achieve high accuracy with good risk to reward.
// This source code is subject to the terms of the Mozilla Public License 2.0 at mozilla.org
// © Rahul
//@version=5
indicator(title='Four Candles Scanner with Bollinger Bands', shorttitle='SEQ_VWEMA_BB', timeframe="", overlay=true)
//VARIABLE
body = close - open
//range_1 = ((high + high + high + high ) - (low + low + low + low )) / 4
// Sell Buy setup
buySEQ = body < 0 and body > 0 and body < 0 and body > 0
plotshape(buySEQ, title='Buy SEQ', location=location.belowbar, textcolor=color.lime, style=shape.triangleup, size=size.normal, color=color.lime, text='Buy\nAlert')
sellSEQ = body > 0 and body < 0 and body > 0 and body < 0
plotshape(sellSEQ, title='Sell SEQ', location=location.abovebar, textcolor=color.red, style=shape.triangledown,size=size.normal, color=color.red, text='Sell\nAlert')
//Bollinger Band
length = input.int(20, minval=1)
src = input(close, title="Source")
mult = input.float(1.5, minval=0.001, maxval=50, title="StdDev")
basis = ta.sma(src, length)
dev = mult * ta.stdev(src, length)
upper = basis + dev
lower = basis - dev
offset = input.int(0, "Offset", minval = -500, maxval = 500)
p1 = plot(upper, "Upper", color=#2962FF, offset = offset)
p2 = plot(lower, "Lower", color=#2962FF, offset = offset)
plot(ta.vwma(close, 5), color=#1a0e05f8)
plot(ta.vwap(close), color=#4c17d1e7)
plot(ta.ema(close, 200), color=#d11736f8 )

9 ema and vwap crossover //@version=4
study(title="VWAP and 9 EMA Cross Signals", overlay=true)
// Inputs
length = input(title="Length", type=input.integer, defval=9)
// VWAP Calculation
vwapSource = hlc3
vwapPeriod = input(title="VWAP Period", type=input.integer, defval=20)
vwap = vwma(vwapSource, vwapPeriod)
// EMA Calculation
ema = ema(close, length)
// Plot VWAP and EMA
plot(vwap, color=color.blue, linewidth=2, title="VWAP")
plot(ema, color=color.green, linewidth=2, title="EMA")
// VWAP and EMA Cross Signals
longCondition = crossover(ema, vwap)
shortCondition = crossunder(ema, vwap)
// Plot Signals
plotshape(longCondition, style=shape.triangleup, location=location.belowbar, color=color.green, size=size.small, title="Long Signal")
plotshape(shortCondition, style=shape.triangledown, location=location.abovebar, color=color.red, size=size.small, title="Short Signal")
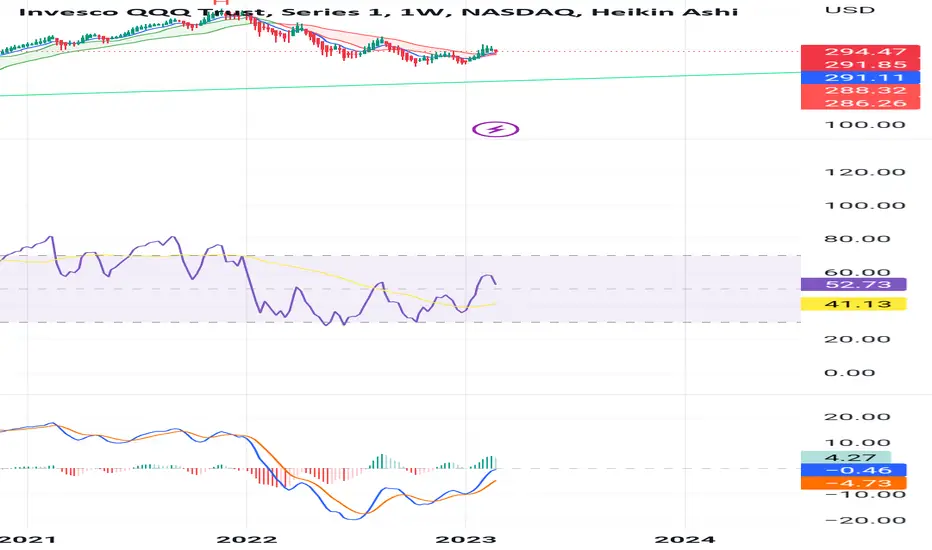
Forget the "Santa rally"Forget the "Santa rally," it's time to brace ourselves for a potentially tumultuous 2023 as concerns mount over bond market developments and their impact on Q1 earnings
Santa is tired, Kids
It is uncertain whether the annual "Santa rally" will occur in 2022 due to the bear market. There are concerns about the recent developments in the bond market and their potential impact on Q1 2023 earnings. Some stocks, such as Amazon, have approached their 2020 lows, which raises the possibility of a "sell the rumor, buy the fact" situation. In the past, when the NASDAQ has experienced a 20% annual drop, negative consequences have followed in subsequent years, with particularly poor performance in the first year. The 10-year treasury yields have reached their highest levels since November and the Federal Reserve may be unable to provide support as it did in 2008, putting portfolios at risk in the coming year. Most strategists expect market prices to remain around current levels by the end of the year, though some have forecasted SPX values of 3400, 3650, and 3725. A shooting star-style weekly candle on the Bond market has signaled potential significant drops in the S&P 500, ranging from 18-20%. There has been a rotation in market performance in the past month, with sectors such as energy, utilities, financials, staples, healthcare, and defensive stocks performing well, while semiconductors, tech, consumer discretionary, clean energy, and solar have struggled. This trend, known as stagflation, has also been reflected in the performance of assets like gold and the GDX. Valuation compression has also been observed in the market, particularly in the clean energy sector. The VIX, or volatility index, has reached levels similar to those seen during the Global Financial Crisis, raising concerns about a potential fear-driven market in 2023. The U.S. two-year yield and 10-year yield have also risen, with the potential for inflation to increase due to recent Covid outbreaks and supply chain disruptions. The high yield market has weakened, with the rejection of topping islands and a deviation from the usual two.
Hairy Bonds
Why is the bond market like a box of chocolates? You never know what you're gonna get! Bonds have recently experienced a sharp decline, largely due to expectations for the federal funds rate and the potential for further COVID-19 lockdowns. This is also contributing to concerns about inflation and the ability of the Federal Reserve to effectively combat it. As a result, the performance of bonds has been impacted, as they tend to do better in environments with rate cuts. The Federal Reserve's slower pace of cuts suggests it may take longer to support the economy and potentially puts additional pressure on economic fundamentals and company valuations. The S&P 500 has seen significant losses on specific days in 2022, including September 13th, May 18th, June 13th, April 29th, and May 5th. These days have resulted in drastic percentage moves, with some as high as 4.3%. In the past month, there has been a rotation in market performance, with sectors such as energy, utilities, financials, staples, healthcare, and defensive stocks performing well, while semiconductors, tech, consumer discretionary, clean energy, and solar have struggled. This trend, known as stagflation, has also been reflected in the performance of assets like gold and the GDX. Valuation compression, or a decrease in the price-to-earnings ratio, has also been observed in the market, particularly in the clean energy sector. It is important to continue monitoring key levels and considering the potential impact on portfolios.
Yield those Funds
FUN FUNDS!
The Federal Funds rate, also known as the benchmark interest rate, is the rate at which banks lend and borrow overnight funds from each other to meet their reserve requirements. It is set by the Federal Reserve, the central banking system of the United States, and is used as a tool to achieve its monetary policy objectives.
Over the past two decades, the Federal Funds rate has had a significant impact on the stock market, particularly the S&P 500 index (SPX). In general, changes in the Federal Funds rate can affect the stock market in a number of ways, including through the cost of borrowing, the level of economic growth, and investor sentiment.
During the early 2000s, the Federal Reserve implemented a series of interest rate cuts in response to the dot-com bubble and the 9/11 terrorist attacks, which helped to boost the stock market. The SPX reached an all-time high in 2007, just before the onset of the global financial crisis. In response to the crisis, the Federal Reserve implemented a series of aggressive interest rate cuts, which helped to stabilize the market and contribute to the recovery of the SPX.
Since the recovery from the financial crisis, the Federal Reserve has generally maintained a low interest rate environment, with the Federal Funds rate hovering around 0%. This has been supportive of the stock market, as low interest rates can make stocks more attractive to investors by reducing the opportunity cost of investing in stocks relative to other asset classes.
However, as the economy has improved and the stock market has reached new highs, the Federal Reserve has begun to gradually increase the Federal Funds rate. While the impact of these increases on the stock market has been relatively limited so far, some analysts have raised concerns that further increases could lead to a slowdown in the market.
Currently, in 2022 leading into 2023, there are no signs yet of the Federal Reserve cutting or tapering rates as the market continues to decline, marking a period of demand destruction. This suggests that the Federal Reserve may be hesitant to use monetary policy as a tool to support the market in the current environment. Instead, the Federal Reserve may be looking to continue rate hikes towards 2000 or 2008 levels.
See chart
In addition: also see
Interesting Inflation!
The "Interesting Inflation" indicator is a technical analysis tool that is designed to provide traders with information about the rate of inflation in the United States. It is designed to work on monthly charts and uses data from the Consumer Price Index (CPI) to calculate the average rate of inflation over a specified period of time.
On the chart, the light blue to orange line represents the average rate of inflation, while the dark blue line represents the trend in the inflation rate for the month of December. The green line represents U.S. interest rates.
The indicator includes a number of inputs, including a toggle to show the inflation rate for the month of December and a setting to enable or disable the display of U.S. interest rates. It also includes a number of plots, including plots for the U.S. inflation rate and U.S. interest rates.
To use the "Interesting Inflation" indicator, traders can simply add it to their chart and adjust the input settings as desired. The indicator will then display the average rate of inflation and, if enabled, the U.S. interest rates on the chart. Traders can use this information to understand the current inflation environment and to make informed decisions about their trades.
In addition to the average rate of inflation, the "Interesting Inflation" indicator also includes a plot for the inflation rate in the month of December. This can be useful for traders who are interested in understanding the trend in inflation over the course of the year and how it may affect the market.
In November 2022, the United States saw a 7.1% increase in prices compared to the previous year, according to the monthly consumer price index (CPI) for goods and services. The CPI, which measures the rate of inflation, shows the percentage change in the price of a basket of goods and services over time. Inflation in the United States has been particularly high in 2022 due to the COVID-19 pandemic, supply chain issues, and the Russian invasion of Ukraine. The annual inflation rate in the United States has risen from 3.2% in 2011 to 8.3% in 2022, indicating a decrease in the purchasing power of the U.S. dollar.
According to data from the International Monetary Fund, the U.S. CPI was approximately 258.84 in 2020 and is expected to reach 325.6 by 2027, compared to the base period from 1982 to 1984. In November 2022, the monthly percentage change in the CPI for urban consumers in the United States was 0.1% compared to the previous month.
Inflation is a significant economic indicator and is being closely watched in countries around the world. Brazil saw an inflation rate of 8.3% in 2021 compared to the previous year, while China's rate stood at 0.85%.
Like a Bottle!
The yield curve represented in blue on the bottom is the graphical representation of the relationship between bond yields and their corresponding maturities. In general, long-term bonds tend to have higher yields than short-term bonds, as investors demand a higher return to compensate for the additional risk associated with tying up their money for a longer period of time. This results in a normal yield curve, where long-term yields are higher than short-term yields.
However, in some cases, the yield curve may become inverted, with short-term yields exceeding long-term yields. This can occur when investors are concerned about the future outlook for the economy and are willing to accept lower returns on long-term bonds in exchange for the added security of a shorter investment horizon.
One specific aspect of the yield curve that is often monitored is the spread between the 10-year and 2-year yields. When the 10-year yield is lower than the 2-year yield, it is known as a yield curve inversion. A yield curve inversion is often viewed as a bearish sign for the stock market, as it can indicate that investors are concerned about the economic outlook and are becoming more risk-averse.
Historically, yield curve inversions have preceded recessions and bear markets, as investors become less willing to take on risk and demand safer, lower-yielding investments. As a result, a yield curve inversion can be an important signal for traders to consider when evaluating market conditions and making investment decisions.
One historical example of a yield curve inversion preceding a market crash is the global financial crisis of 2008. In early 2007, the yield curve inverted, with the yield on the 10-year Treasury bond falling below the yield on the 2-year Treasury bond. This was a clear warning sign that investors were becoming increasingly concerned about the economic outlook and were seeking out safer, shorter-term investments.
As the year progressed, the financial crisis deepened, with the housing market collapsing and major financial institutions experiencing significant losses. The stock market, as measured by the S&P 500 index, reached its peak in October 2007 and then began a steep decline, eventually bottoming out in March 2009.
The yield curve inversion was just one factor contributing to the financial crisis and market crash, but it was an important warning sign that investors should have paid attention since it is currently inverted, which has historically preceded a recession within the next two years. However, the size of the inversion does not necessarily determine the severity of the recession. While the current inversion is larger than previous ones, it does not necessarily mean that the upcoming recession will be worse. In addition, the stock market's recent behavior is not indicative of a burst bubble, meaning that the potential decline in the market during the recession may not be as severe as previous ones
It's worth what you pay for it
In the first quarter of 2023, earnings will be in focus for the market. The recent sell-off in stocks, particularly those such as Amazon that have almost reached 2020 lows, has raised concerns about what will happen next. The 10-year Treasury yields have risen to their highest levels since November, which could indicate a longer period for the Federal Reserve to combat inflation and support the economy. These factors, along with the high rates of Covid outbreaks and the potential for stagflation, have contributed to the rotations seen in the market, with energy, utilities, financials, staples, healthcare, and other inflation plays performing well, while semiconductors, tech, consumer discretionary, clean energy, and solar have struggled. The VIX, or volatility index, has also reached levels similar to those seen during the Global Financial Crisis, raising concerns about a potential fear-driven market in 2023. The U.S. two-year yield and 10-year yield have also risen, with the potential for inflation to increase due to the recent Covid outbreaks and supply chain disruptions. The high yield market has also weakened, with the rejection of topping islands and a deviation from the usual two to one ratio with the S&P 500. These factors could all impact market performance in the coming year.
Fearing Futures
The US dollar futures are currently looking strong, with indications of accumulation in the market. This is supported by the recent closure of nice wick rejections off the lows and a move above 104. The two-hour chart shows evidence of accumulation at this point, with a critical bottom and big rejections at a certain level, as well as a double bottom formation. If the market breaks above 104, there is potential for a bigger trade to reach 107. Despite negative sentiment towards the US dollar recently, most trend lines show a break through. It is important to note that a strengthening US dollar may not be positive for the US stock market. Gold has been exhibiting a series of higher lows and has broken to a new high. However, it is important to be cautious when trading gold at this time of year due to large spreads and illiquidity. Gold is currently rejecting these levels and it is important to monitor the weekly chart for any potential break and close above a certain price, which could lead to a drop met by strong demand. Oil stopped at 81 and has fallen off, with wick rejections in the 81-82 range. The two-hour chart for oil is difficult to interpret at this time, with no new lows. It is important to monitor the market for a break below a certain price, which could indicate a potential move to the downside.
King Elon, the Musk
The performance of Tesla (TSLA) has been a key focus in recent market analysis. According to the provided text, TSLA has recently moved above the 104 level, indicating some form of accumulation in the market. This is supported by the presence of "nice Wick rejections" at this level and the establishment of a new high, followed by a pullback to the 618 Fibonacci level where buyers were found again. While sentiment towards the US dollar has been negative, the trend lines suggest that the currency may continue to strengthen, which may not be positive for the US stock market as a whole. However, TSLA's performance may not be directly impacted by this trend. Instead, the focus is on whether TSLA can break above the 104 level and potentially reach a bigger trade with a target of 107. It is recommended to buy dips in TSLA at this time, although caution is advised due to the potential for large spreads and illiquidity in the market around the new year. Overall, the performance of TSLA will be closely watched in the coming week, as key indicators such as long leg doji candles suggest indecision or equilibrium in the market. It is important to exercise patience and react to developments rather than attempting to predict them, as the market for TSLA may be challenging to trade in the short term. The Tesla stock price has experienced significant volatility recently, with the stock reaching new highs and then falling off. This has resulted in many traders experiencing stop loss triggers and margin calls. The market has been bearish on tech stocks, particularly those with high valuations, and this has weighed on the overall market. It remains to be seen how the market will react to Q1 earnings, but it is expected to be a significant event that could impact the direction of the market. In the meantime, traders should keep an eye on key levels and be prepared for potential volatility.
Weighing a Giant
Apple's weekly close is significant because if it goes below the low formed in June, it may indicate that the biggest stock in the world is facing significant headwinds. There may be rallies, but they may be sold due to the stock approaching key levels. The Gap close for Apple is also relevant to Amazon, which is approaching its 2020 low at around 81.33. This may cause some buyers to recommit and trigger a lot of sell signals, as well as margin a lot of people's stop losses. Semiconductors have continuously sold off due to concerns about valuations and the impact on tech stocks, particularly in the market. It is possible that this could be due to selling rumors ahead of Q1 earnings. The Dax has been more technical and has sold off after reaching a resistance level. If the market trends sideways over the next few days, it may trap options money. The US30 has held up relatively well, but it has not yet reached a new high above 33,000. There may be gaps left behind in the area between 32,500 and 33,000. The US500 has formed a bearish flag and may test its 200-day moving average. If it breaks down from this pattern, it may indicate that the market is heading lower. The Nasdaq has been underperforming and may test its 50-day moving average. The Russell 2000 has been lagging and may test its 50-day moving average. The US dollar has been in a range and may test its 200-day moving average. Gold has formed a bearish flag and may test its 200-day moving average. Oil has formed a bearish flag and may test its 50-day moving average. The 20th is a significant options expiration date with almost 5 million units, and there is a large number of puts stacked compared to calls. This may indicate that the market may rally initially and then sell off later. Bitcoin has pulled back to a key level and needs to rally through 17,000 again to potentially reach 17,500 to 17,600. However, the current outlook is negative and there is a potential for it to go lower. The market trend has been for rallies to be met with sell demand due to risk-on and risk-off assets, with Bitcoin being a risky asset. In general, it is expected to trade between $9.5k and $11.5k
See charts:
TLDR
Bond market developments and their potential impact on Q1 2023 earnings
Santa rally may not occur in 2022 due to bear market
Some stocks, such as Amazon, approaching 2020 lows
NASDAQ has experienced 20% annual drop in past, negative consequences in subsequent years
10-year treasury yields at highest levels since November, Federal Reserve may not provide support
Market prices expected to remain around current levels by end of year, some S&P predictions of 3400, 3650, 3725
Shooting star-style candle on market signals potential significant drops in S&P 500
Rotation in market performance in past month, with energy, utilities, financials, staples, healthcare performing well, and semiconductors, tech, consumer discretionary, clean energy, solar struggling
Stagflation trend reflected in performance of assets like gold and GDX
Valuation compression in clean energy sector
VIX at levels similar to Global Financial Crisis, potential fear-driven market in 2023
U.S. two-year and 10-year yields have risen, potential for inflation due to Covid outbreaks and supply chain disruptions
High yield market has weakened, rejection of topping islands and deviation from usual two
Earnings in focus for market in Q1 2023
Sell-off in stocks raises concerns about future, 10-year Treasury yields at highest levels since November
Factors such as high Covid rates and potential stagflation contributing to market rotations
Potential for additional fiscal stimulus, potential for vaccine rollouts to impact market
It is important to monitor key levels and consider protective measures for portfolios heading into 2023
If you want to continue, good luck, Chuck!
The Blackest of Rocks
In a recent article, BlackRock Vice Chairman Philipp Hildebrand explains that the Great Moderation, a four-decade period of stable activity and inflation, is over and that we are now in a new regime of greater macro and market volatility. This new regime is characterized by a recession that is foretold and central banks that are on course to overtighten policy in an effort to tame inflation, leading to persistent inflation and output volatility, rate hikes that damage economic activity, rising bond yields, and ongoing pressure on risk assets. Hildebrand and the BlackRock Investment Institute team suggest that a new investment playbook is needed to navigate this new regime, with three key themes: pricing the damage, rethinking bonds, and living with inflation. They recommend balancing views on risk appetite with estimates of how markets are pricing in economic damage, taking more granular views by focusing on sectors, regions, and sub-asset classes, and considering tactical and strategic investments in inflation-linked bonds.
According to Mr. Hildebrand and the team at BlackRock, we have entered a new regime characterized by persistent inflation and output volatility, central banks pushing policy rates to levels that damage economic activity, and ongoing pressure on risk assets. This new regime is being driven by production constraints such as aging populations leading to worker shortages and the pandemic shift in consumer spending from services to goods causing shortages and bottlenecks. Central banks' policy rates are not equipped to resolve these production constraints and are left with a trade-off between crushing demand to achieve their inflation targets and allowing for more inflation. As a result, a recession is likely on the horizon, but as the economic damage becomes more apparent, central banks may stop their rate hikes even though inflation will not fully return to target levels. There are also long-term trends such as aging populations, persistent geopolitical tensions, and the transition to net-zero carbon emissions that are expected to continue to constrain production capacity and cement this new regime.
In the report "Navigating Markets in 2023" published by BlackRock, it is noted that navigating markets in 2023 will require more frequent portfolio changes.In determining tactical portfolio outcomes, BlackRock plans to consider two assessments: their assessment of market risk sentiment and their view of the economic damage reflected in market pricing. BlackRock is currently at its most defensive stance, with options for turning more positive, especially on equities. The company is also underweight in nominal long-term government bonds in each scenario in the new regime, which is their strongest conviction in any scenario. BlackRock can turn positive in different ways, either through their assessment of market risk sentiment or their view on how much damage is reflected in market pricing.
A recession is imminent as central banks attempt to control inflation. In contrast to past recessions, loose policy will not be used to support risk assets. As a result, the traditional strategy of "buying the dip" is not applicable in this context of increased macro volatility and trade-offs. Instead, it is necessary to continuously reassess the extent to which central bank actions are damaging the economy and factoring this damage into investment decisions. In the U.S., the impact can be seen in rate-sensitive sectors, such as the housing market, as well as declining CEO confidence, delayed capital spending plans, and a depletion of consumer savings. In Europe, the energy shock is exacerbated by tightening financial conditions. The ultimate economic damage will depend on the measures taken by central banks to reduce inflation. The author's approach to tactical investment is influenced by their assessment of market participant risk appetite and the extent to which damage is reflected in equity earnings expectations and valuations. They expect central banks to stop raising rates and for activity to stabilize in 2023, but do not believe that earnings expectations currently factor in even a mild recession. As a result, the author is currently underweight on developed market (DM) equities on a tactical horizon. However, they are prepared to become more positive as valuations better reflect economic damage and risk sentiment improves.
The recent increase in yields has made fixed income assets more attractive to investors who have been seeking yield for a long period of time. Blackrock takes a specific approach to investing in this environment, rather than taking broad, aggregate exposures. They believe that the case for investment-grade credit has improved and are raising their overweight position both tactically and strategically. They believe that these assets can hold up in a recession due to the fortification of company balance sheets through debt refinancing at lower yields. Agency mortgage-backed securities, a new tactical overweight, can also serve a diversified income role. Short-term government debt is also attractive at current yields, and Blackrock has created a separate tactical view for this category. In contrast, Blackrock does not believe that long-term government bonds, which have traditionally protected portfolios during recessions, will serve this purpose in the current environment. They argue that the negative correlation between stock and bond returns has reversed, meaning that both can decline simultaneously. This is due to the likelihood that central banks will not implement rapid rate cuts during recessions that they have caused in an effort to bring down inflation to policy targets. Instead, policy rates may remain higher for longer than the market expects. Investors may also demand higher compensation, or term premium, to hold long-term government bonds due to high debt levels, increasing supply, and rising inflation. Central banks are decreasing their bond holdings and Japan may cease purchases, while governments are continuing to run deficits, leading to the private sector having to absorb more bonds. As a result, Blackrock remains underweight on long-term government bonds in both tactical and strategic portfolios.
High inflation has caused cost-of-living crises, leading central banks to take action to bring down inflation. However, there has been little discussion about the impact on growth and employment. Blackrock believes that the narrative around the "politics of inflation" is on the verge of shifting as the negative effects become more apparent and the "politics of recession" take center stage. They also believe that central banks may be forced to stop tightening in order to prevent financial cracks from becoming more severe, as seen in the UK when investors reacted negatively to fiscal stimulus plans. Despite the impending recession, Blackrock expects that inflation will persist above policy targets in the coming years. They attribute this to normalization of spending patterns and a decrease in energy prices, as well as long-term constraints such as aging populations, geopolitical fragmentation, and the transition to a low-carbon world. Blackrock's strategic views have reflected this new regime, with an overweight to inflation-protected bonds for several years. However, market expectations and economist forecasts have only recently started to acknowledge the persistence of inflation. Blackrock believes that markets are underappreciating inflation and, as a result, have a high conviction, maximum overweight to inflation-linked bonds in strategic portfolios and maintain a tactical overweight regardless of how the new regime plays out.
Blackrock says, the best way to predict the future is to examine what their companies are saying. They have a 2023 playbook that is ready to adapt quickly depending on how markets price economic damage and their risk stance evolves. Blackrock prefers short-term government bonds for income, due to the increase in yields and the reduced need to take on risk by seeking yield further out the curve. They are adding to their overweight position in investment grade credit, which they believe may be better positioned than equities to weather recessions due to higher yields and strong balance sheets. They also like U.S. agency mortgage-backed securities for their higher income and credit protection through government ownership of the issuers. Blackrock's expectation for persistent inflation relative to market pricing keeps them overweight in inflation-linked bonds. They remain underweight on long-term government bonds and overall underweight on equities, as they do not believe that the upcoming recession is fully reflected in corporate earnings expectations or valuations, and disagree with the assumption that central banks will eventually support markets with rate cuts. Instead, they plan to focus on sectoral opportunities resulting from structural transitions, such as healthcare amid aging populations, in order to add granularity while staying underweight overall. Among cyclicals, they prefer energy and financials, with energy sector earnings expected to ease from historically high levels while still holding up amid tight supply and higher interest rates benefiting bank profitability. They also like healthcare due to attractive valuations and likely cashflow resilience during downturns.
“We expect views to change more frequently than in the past. Our stance heading into 2023 is broadly risk-off, with a preference for income over equities and long-term bonds. “
The Great Moderation, which allowed for relatively stable strategic portfolios, will not be effective in the current regime. Instead, they believe that portfolios will need to be more nimble. They do not expect a return to conditions that will support a joint bull market in stocks and bonds like the one that occurred in the prior decade. They argue that the asset mix is more important now and that getting the mix wrong could be four times as costly as it was during the Great Moderation. This is because the zero or even positive correlation between the returns of stocks and bonds means that it will take higher portfolio volatility to achieve similar levels of return. Blackrock sees private markets as a core holding for institutional investors, but is broadly underweight due to the potential for valuations to fall and the expectation of better opportunities in the future. They maintain a modest overweight on developed market (DM) equities, but believe that the overall return of stocks will be greater than fixed-income assets over the coming decade. Within fixed income, they prefer to take risk in credit, specifically public credit rather than private. They remain overweight on inflation-linked bonds and underweight on nominal DM government bonds, with a preference for short maturities to generate income and avoid interest rate risk.
Blackrock says that the aging population is a significant factor in the current production constraints and will continue to be a problem in the future. As the population ages, the share of the U.S. population that is of retirement age and therefore not in the workforce is increasing. This is a major contributor to the decline in the labor force participation rate, which measures the share of the adult population that is in work or actively looking for work. The aging population is also negative for economic growth because it means that the available workforce will expand much more slowly in the coming years, leading to reduced production capacity and continued inflation pressure. Additionally, rising government spending on care for the elderly is expected to add to debt. Within equities, Blackrock views the healthcare sector as attractive due to its focus on developing medicine and equipment to meet the needs of an aging population.
To conclude their playbook:
“A bottom-up look at what our
companies are telling us is
probably the best lens we have
into the future.”
The 2023 playbook is ready to
quickly adjust depending on how
markets price economic damage
and our risk stance evolves.
They prefer short-term government
bonds for income: The jump in
yields reduces the need to take risk
by seeking yield further out the
curve. U.S. two-year Treasury yields
have soared above 10-year yields.
See the chart. They break out shortterm Treasuries as a neutral.
They add to their overweight to
investment grade credit. Higher
yields and strong balance sheets
suggest to them investment grade
credit may be better placed than
equities to weather recessions.
They like U.S. agency mortgagebacked securities (MBS) for their
higher income and because they
offer some credit protection via the
government ownership of their
issuers. And their expectation for
persistent inflation relative to
market pricing keeps them overweight
inflation-linked bonds.
Long-term government bonds
remain challenged as they have
described, so they stay underweight.
In equities, they believe recession isn’t
fully reflected in corporate earnings
expectations or valuations – and they
disagree with market assumptions
that central banks will eventually
turn supportive with rate cuts. They
look to lean into sectoral
opportunities from structural
transitions – such as healthcare
amid aging populations – as a way
to add granularity even as they stay
overall underweight. Among
cyclicals, they prefer energy and
financials. They see energy sector
earnings easing from historically
elevated levels yet holding up amid
tight energy supply. Higher interest
rates bode well for bank profitability.
They like healthcare given appealing
valuations and likely cashflow
resilience during downturns.
A new strategic approach
The Great Moderation allowed for
relatively stable strategic
portfolios. That won’t work in the
new regime: They think they will need
to be more nimble.
They don’t see a return to conditions
that will sustain a joint bull market
in stocks and bonds of the kind they
experienced in the prior decade.
The asset mix has always been
important, yet their analysis posits
that getting the mix wrong could be
as much as four times as costly as
versus the Great Moderation. See
the difference between the orange
bar and yellow markers on the
chart. Zero or even positive
correlation between the returns of
stocks and bonds means it will take
higher portfolio volatility to achieve
similar levels of return as before.
They see private markets as a core
holding for institutional investors.
The asset class isn’t immune to
macro volatility and they are broadly
underweight as they think valuations
could fall, suggesting better
opportunities in coming years than
Now.
To read their full report with graphics see this link:
www.blackrock.com
Fear the VIX
If you're a bear on the market, a VIX at 45 might have you doing a happy dance - but for bulls, it could be a different story. The S&P 500 index is a widely-recognized measure of the performance of 500 large publicly-traded companies in the United States. It is often used as a benchmark for the overall health of the U.S. stock market and has generated an average annual return of around 9% since its inception in 1957. The index reached an all-time high in early 2020 but experienced a steep decline due to the COVID-19 pandemic, although it has since recovered much of those losses and is currently trading near all-time highs.
The CBOE Volatility Index, or VIX, is a measure of the expected volatility of the S&P 500 index over the next 30 days. It is calculated using option prices on the S&P 500 index and is commonly referred to as the "fear index." A high VIX suggests that investors expect the stock market to be more volatile in the near future, while a low VIX indicates that investors expect relatively stable market conditions.
For a bearish investor, or someone who expects stock prices to fall, a high VIX may be viewed as an opportunity to profit from falling stock prices. This is because a high VIX can be a sign of increased uncertainty or fear in the market, which may be caused by negative factors such as economic recession, geopolitical tensions, or natural disasters. On the other hand, a high VIX may be seen as a warning sign for bullish investors, who may decide to reduce their exposure to the stock market or implement protective measures to mitigate the potential impact of market volatility.
However, it's worth noting that the VIX is not a perfect indicator of market conditions and can be influenced by a range of factors beyond just the level of fear or uncertainty in the market. Additionally, a longer-term mindset bull, or someone with a long-term bullish outlook on the stock market, may actually welcome a spike in the VIX as it can sometimes signify a market bottom, or a point at which stock prices have reached a low point and are likely to start rising again. In this case, the high VIX may be viewed as an opportunity to buy into the market at a discounted price, with the expectation of generating returns over the long run. As such, it's important for investors to consider their individual investment goals and horizon when evaluating the significance of the VIX and other market indicators.
On the Chart Al La Carte
On the chart, we can see the daily movements of both the S&P 500 index (SPX) and the VIX. Historically, there has been a correlation between a spike in the VIX and a market bottom in the SPX. One of the most notable examples of this relationship was during the Global Financial Crisis (GFC) in 2020, when the VIX reached over 80. The reversal of the VIX marked the bottom of the market on March 16, 2020, a few days before the SPX hit its bottom on March 23.
Since the GFC, we have seen similar, although smaller, spikes in the VIX and corresponding market bottoms. These include October 28, 2020, January 24, 2022, March 8, 2022, March 19, 2022, June 16, 2022, and October 12, 2022. It's important to watch for divergence between the VIX and the SPX to understand if a market bottom may be forming.
See chart
One strategy that some investors use is to watch for divergence between the VIX and the SPX. When the VIX is rising and the SPX is falling, it may be a sign that the market is approaching a bottom. Conversely, when the VIX is falling and the SPX is rising, it may indicate that the market has reached a bottom and is starting to recover.
One example of divergence between the SPX and VIX occurred in late 2018, when the SPX was in a long-term uptrend and the VIX was trending downwards. This divergence may have indicated that the market was approaching a top and that investors should be cautious about taking on additional risk.
Another example of divergence occurred in March 2020, during the COVID-19 pandemic. The SPX experienced a steep decline due to the economic impact of the pandemic, while the VIX spiked to over 80. This divergence may have indicated that the market was approaching a bottom and that it was a good time for investors to start looking for opportunities to buy into the market.
One example of a technical analysis tool that can be used to understand the relationship between the SPX and the VIX is the "Vix_Fix" indicator. This indicator uses a number of inputs, including the lookback period for standard deviation, the Bollinger Band length, the Bollinger Band standard deviation, the lookback period for percentile, and the highest and lowest percentiles, to calculate the Williams Vix Fix (WVF). The WVF is a measure of the momentum of the SPX and is plotted on the chart as a histogram. The "Vix_Fix" indicator can be used to identify periods of divergence between the SPX and the VIX, as well as to identify potential points of market reversal. When the SPX is pushing lower and the VIX is pushing higher, it may be a sign that the market is approaching a bottom. Conversely, when the SPX is rising and the VIX is falling, it may indicate that the market has reached a bottom and is starting to recover.
See chart
In conclusion, it is important for investors to keep track of various economic indicators, such as the S&P 500 index, VIX, federal fund rate, and yield curve, in order to make informed investment decisions. While a bear market may be welcomed by some investors, it is important to consider the potential impact on the economy and individual investments. Understanding the historical trends and correlations between these indicators can help investors navigate bear markets and make the most of their investment strategy. It is also crucial to consider a range of factors and not rely on a single source of information when making investment decisions. Overall, staying informed and understanding the market can help investors make the most of their investments, even during a bear market.
If you made it this far, congratulations, you are one dedicated reader and thank you for your time!

Monday BTC LongI decided to place this small BTC long to see if this Monday move was a fake move.
The last 4 hourly contraction value line was plotted on the chart and an expansion below has happened, perhaps an uptrend to the value line can happen?
TP1: 16150
TP2: 16349
TP3: 16530
TP4: 16700
SL: 15788
═════════════════════════════════════════════════════════════════════════
Contraction Plotter Indicator and Expansion Index:
═════════════════════════════════════════════════════════════════════════

a//@version=5
indicator("REPLAY ichimoku" , overlay=true)
TIME = input.time(defval = timestamp('11 Feb 2022') , confirm=true)
RP = time < TIME
OPEN = RP ? open : na
HIGH = RP ? high : na
LOW = RP ? low : na
CLOSE = RP ? close : na
COLOR = close>open ? color.green : close math.avg(ta.lowest(len), ta.highest(len))
conversionLine = RP ? donchian(conversionPeriods) : na
baseLine = RP ? donchian(basePeriods) : na
leadLine1 = RP ? math.avg(conversionLine, baseLine) : na
leadLine2 = RP ? donchian(laggingSpan2Periods) : na
plot(conversionLine, color=#2962FF, title="Conversion Line")
plot(baseLine, color=#B71C1C, title="Base Line")
c_close= RP ? close : na
plot(c_close, offset = -displacement + 1, color=#43A047, title="Lagging Span")
p1 = plot(leadLine1, offset = displacement - 1, color=#A5D6A7,
title="Leading Span A")
p2 = plot(leadLine2, offset = displacement - 1, color=#EF9A9A,
title="Leading Span B")
fill(p1, p2, color = leadLine1 > leadLine2 ? color.rgb(67, 160, 71, 90) : color.rgb(244, 67, 54, 90))

MANA-USDT Buy and HoldBUY AND HOLD
In addition, we remind you that as the popularity of the metaverse and the Decentralized Earth has increased dramatically over the past year, which has led to an increase in demand, the digital assets associated with them (i.e. their own MANA token, real estate / real estate / LAND prices, etc.) have also increased significantly in price. This, in turn, led to increased interest in investing in a metaverse / decentralized territory and institutional implementation (for example, recognition and penetration into the corporate environment / brand).; A trend that is likely to continue in the future, when companies such as Atari acquire large holdings to interact with customers. This, along with the growing popularity of the NFT market and related digital assets in a decentralized country (for example, wearables, collectibles, etc.), is likely to continue to stimulate the value proposition of a Decentralized country in the future.
By facilitating the new and complex process of investing, buying and renting in decentralized and similar implementations of the metaverse, Metaverse Property aims to make the process of virtual real estate transactions smoother through various service offerings. These include: real estate management, development, consulting, marketing and investment through Metaverse REIT. The Metaverse property provides access to a variety of offerings in the main areas of the Decentralized Earth, including Crypto Valley, Dragon City, Ether City, Vegas City, Fashion Street and District X. Thus, Metaverse Property strives for a vision of the future that simulates the "First Player Preparing", where business and real estate will exist in tandem at new frontiers, including both material and digital reality. The company strives to promote this vision and commitment to its core principles of creating the best places to call home by doing what is right.
Take into account that the NFT market tripled last year with a very strong movement by 2021. As more and more wearables, collectibles and art become represented by NFT and with broader overall investments in space, the demand for a mechanism for storing and displaying these digital assets will constantly increase. Decentraland and similar metaverse implementations are the main mechanisms for storing / displaying these digital assets, thereby adding an additional dimension to the Decentraland value proposition.
Investing, Buying and Renting with Metaverse Property Even though virtual land / real estate is becoming an increasingly valuable emerging asset class across the metaverse, many investors may be overwhelmed by the novelty or complexity of buying / renting / investing in Decentraland digital real estate.
To this end, one of the partners of the GDA Group, Metaverse Property, has tried to make the process of operations with virtual real estate smoother with the help of various service offers.
Metaverse Property is the first virtual reality-based real estate company in the entire industry, providing access to the developing virtual land industry through various metaverse implementations, including:Decentraland, TheSandbox, Somnium, Cryptovoxels, and Upland.
Metaverse Property facilitates the purchase and sale of virtual property in addition to a set of other services led by pioneers in the NFT and blockchain industry.
Some of these services include:
● Property management: includes renting out real estate to clients, technical and aesthetic services, collecting rent from clients, a contact point for all questions and requests related to clients.
● Development: managing the design, design and development of a building, as well as creating a project on the map.
● Consultations: assistance to real estate owners / tenants in making important decisions in the field of real estate based on virtual reality using their knowledge about the virtual earth in the metaverses, as well as about the blockchain industry in general.
● Marketing: Metaverse Property has reliable access to a growing advertising network that exists in various metaverses. In addition, the team has significant experience in marketing various projects related to blockchain and NFT. Thus, they have demonstrated the ability to increase accessibility and can do this for virtual land or enterprises.
In addition, Metaverse Property has created the first virtual real estate investment trust (for example, Metaverse REIT), providing investors with access to the best real estate assets in the metaverse without burdensome barriers to entry, such as developing technological savvy in the blockchain and metaverse market spaces. Consumers can get access through the Metaverse Property REIT token: NFT, supported by the company's virtual land and real estate portfolio.
As for Decentraland, Metaverse Property provides access to land in five Decentraland districts, including some of the following:
● Crypto Valley: A virtual land / district in Decentraland, where a community of cryptocurrency / blockchain-based projects unites to form a community focused on promoting innovation.
This comes from the name of its real-world counterpart, Silicon Valley.
● Dragon City: Dragon City combines ancient Chinese culture and modern Western civilization, reflecting a kind of fusion of East and West.
● Etherian City: One of the main attractions of Decentraland, covering the largest cyberpunk community in Decentraland. Some of the attractions in it include a nightclub, various living quarters, a specially designated area for tournaments, various playgrounds and other events. In accordance with its cyberpunk nature, the setting of this area seems futuristic and includes an environment stylistically similar to "The First Player at the Ready".
● Vegas City: True to its name, Vegas City in Decentraland is actually a double of its real counterpart, Las Vegas. This is a party city, a Decentraland gambling district designed to mimic Vegas. There are many casinos, shopping centers, nightclubs, concert / concert halls and other entertainment venues.
● Fashion Street: This area reflects the real brands of leading brands (for example, Gucci, Prada, RalphLauren, etc.) and brings the same concept to Decentraland. In fact, Decentraland users can go to Fashion to get a more detailed shopping experience.
● District X: District X is the" red light district " in the Decentraland community, which contains many adult services, such as: VR pornography, dating services, adult e-shops, adult online chat and much more.
In particular, some of the offers that Metaverse Property owns or offers in Decentraland itself include the following:
● Global Digital Assets Estates
● GDA Dragon Estates: Global Digital Asset Estates near Dragon City.
● GDA Crypto Valley Estates: a meeting place for startups and investors.
● GDA Aetherean View,
● GDA Plaza Estate
● University-related district plot: A nice plot on the University highway, beautifully located within the district. It is suitable for driving on roads due to its proximity to the motorway.
● Plot associated with Anarchy International: a plot of land located with coordinates (x, y) = (30, 65) in Decentraland.
● The site connected to the conference room, on the main road: this site is an ideal opportunity for business / commerce due to the active activity around it and its convenient location.
● Fashion Street Estate: One of the most affordable estates on Fashion Street.
● Large Genesis Plaza Estate: This is one of the largest estates for sale in all of Decentraland, with a great location in close proximity to Genesis Plaza.
● Legacy of Blockchain Names: This estate includes some of the leading blockchain domain names in the world, including:
BlockchainJobs.com, CryptoInsurance.com, BlockchainSports.com and NewYorkBlockchain.com
Metaverse Property company adheres to the vision of the future, which simulates Ready Player One, where business and real estate will exist in tandem at a new frontier, including both material and digital reality. The company strives to promote this vision and commitment to its core principles of building the best places to call home by doing what is right.
In addition, Metaverse Property is headed by co-founders Michael Gord and Jason Cassidy, each of whom has extensive experience in finance, consulting, software and blockchains.

Volitility compression and pocket pivot//52-week high/low
High52 = security(syminfo.tickerid, "W", highest(high, 52))
Low52 = security(syminfo.tickerid, "W", lowest(low, 52))
//WMA
WMA10 = wma(close, 10)
WMA20 = wma(close, 20)
WMA50 = wma(close, 50)
WMA100 = wma(close, 100)
WMA200 = wma(close, 200)
//Standard Deviation with WMA
lenSD = input(20, minval=1)
sdavg13 = input(title="WMA SD", type=input.integer, defval=13)
sdavg22 = input(title="WMA SD", type=input.integer, defval=22)
src = input(close, title="Source")
SD = stdev(src, lenSD)
SDWMA13 = wma(SD, sdavg13)
SDWMA22 = wma(SD, sdavg22)
//ATR with MA
lenAtr = input(title="atr length", defval=1)
oatr = atr(lenAtr)
atravg5 = input(title="WMA ATR", type=input.integer, defval=5)
atravg13 = input(title="WMA ATR", type=input.integer, defval=13)
atravg22 = input(title="WMA ATR", type=input.integer, defval=22)
ATRWMA5 = wma(oatr, atravg5)
ATRWMA13 = wma(oatr, atravg13)
ATRWMA22 = wma(oatr, atravg22)
//Volume with WMA
VOLMA5 = wma(volume, 5)
VOLMA10 = wma(volume, 10)
VOLMA20 = wma(volume, 20)
//Pocket Pivot
greenDay = close >= close
redDay = close < close
highVolume = highest(volume, 10)
Redvolume = iff(redDay, volume, 0)
Greenvolume = iff(greenDay, volume, 0)
TopGreenV = highest(Greenvolume, 10)
TopRedV = highest(Redvolume, 10)
PocketPivotVol = volume > TopRedV
PocketPivotDay = PocketPivotVol and greenDay
// VARIABLES
Blue = close > High52 * 0.75 and close > Low52 * 1.3 and WMA50 > WMA100 and
WMA50 > WMA200 and WMA100 > WMA200 and
SD < SDWMA13 and SD < SDWMA22 and SDWMA13 < SDWMA22 and
oatr < ATRWMA5 and oatr < ATRWMA13 and oatr < ATRWMA22 and ATRWMA5 < ATRWMA13 and
ATRWMA13 < ATRWMA22 and
volume < VOLMA5 and volume < VOLMA10 and volume < VOLMA20 and VOLMA5 < VOLMA10 and
VOLMA10 < VOLMA20 and low <= WMA10
// PLOT
plotshape(Blue, title="Blue dot", text="+", textcolor=color.white, style=shape.circle, location=location.bottom, color=color.navy, transp=0, size=size.tiny)
plotshape(PocketPivotDay ? 1 : na, title="Pocket Pivot", style=shape.triangleup, location=location.belowbar, color=color.navy, size=size.tiny)
plot(High52, title='52 Week High', trackprice=true, color=color.orange, offset=-9999)
plot(Low52, title='52 Week Low', trackprice=true, color=color.orange, offset=-9999)

BTC has a path 10.9k, with minor pullbacks along the wayLooks like the expected correction was merely a "wave 4 of A of 5"
Now starting a wave 5 of the smallest order, and maybe wave "A of 5".
EW says wave 5 should have five sub waves, but this may have three subs.
$ 9556-9626 is key resistance that must now be flipped into support.
$ 10,292-271 is the MIN expected target, possible over shoot to 10,5xx
$ 10,916-950 is the MAX expected target, possible over shoot to 11,1xx
It is POSSIBLE that small wave 5 will also end larger wave 5 (circled).
It is PROBABLE that we break 10k then retrace to 9.6k for last bounce.
It is PLAUSIBLE of course that we crash short of 10k but UNLIKELY imo.
There will be much talk of the "CME Gap" from Friday close of 9300.
Perhaps that will be "filled" at some point, maybe even Sunday at open.
I think of gaps like "magnets": if price gets close enough, it will be attracted.
.
Recent Plots of this bounce:
Bottom of Crash : $3850 Bottom Taggged <= Fib nailed it.
Bounce Update 1: $6950 top Plotted
Bounce Update 2: $5900 launch caught
Bounce Update 3: $6600 top Plotted
Bounce Update 4: $6200 Foreseen
Bounce Update 5: $7300 top retrace
Bounce Update 6: $6600 Bottom mapped
Bounce Update 7: $6800 launch caught
Bounce Update 8: $9200 possible Top
Bounce Update 9: $9335 breakout call
Possible Bottom: $8106 possible Bottom <= Fib again.
.
The Big Picture: "One Fib to Rule them All":
.
My older charts catching every key turn and giving early warnings:
Mar 06, 2020: 9.2k Top Call
Feb 13, 2020: 10.5k Top call
Feb 10, 2020: 9.7k Bounce <= mapped within $10
Feb 08, 2020: 10k Targetted
Jan 17, 2020: 9k barrier Foretold <= Warning in Time
Jan 07, 2020: 8475 Top Call <= Mapped within $5
Jan 01, 2020: Sub 7k Foreseen
Dec 29, 2019: Big Picture Fibs <= the 3 Fibs of Life
Jun 02, 2019: 14k target call <=Perfect TP
May 12, 2019: 10k target call
Dec 03, 2018: 3.1k bottom call <=EXACT 2018 bottom
.
My "Book" detailing my Methodology with Numerous Examples:
Chapter 1: Introduction and numerous Examples
Chapter 2: Detailed views and Wave Analysis
Chapter 3: The Dreaded 9.618: Murderer of Moves
Chapter 4: Impulse Redux: Return to Birth place
Chapter 5: Golden Growth: Parabolic Expansions
Chapter 6: Give me a ping Vasili: one Ping only
.

BTC heads up going into 9k: "to B or not to B" ?Quick alert that we might be due for another leg down.
The pre-halving drop may have been a "Wave A" of ABC.
The bounce thus far resembles a corrective style wave B.
$ 8995-9000 is the OBVIOUS psychological resistance.
$ 9265-9295 is my BEST GUESS for possible top of wave B.
$ 9227-9253 is the DANGER zone as seen on last approach.
Seeing Blurry Numbers? that is a rendering bug.
Click Here for a SnapShot with clear numbers.
Recent Plots of this bounce:
Bottom of Crash : $3850 Bottom Taggged <= Fib nailed it.
Bounce Update 1: $6950 top Plotted
Bounce Update 2: $5900 launch caught
Bounce Update 3: $6600 top Plotted
Bounce Update 4: $6200 Foreseen
Bounce Update 5: $7300 top retrace
Bounce Update 6: $6600 Bottom mapped
Bounce Update 7: $6800 launch caught
Bounce Update 8: $9200 possible Top
Bounce Update 9: $9335 breakout call
Possible Bottom: $8106 possible Bottom <= Fib again.
.
The Big Picture: "One Fib to Rule them All":
.
My older charts catching every key turn and giving early warnings:
Mar 06, 2020: 9.2k Top Call
Feb 13, 2020: 10.5k Top call
Feb 10, 2020: 9.7k Bounce <= mapped within $10
Feb 08, 2020: 10k Targetted
Jan 17, 2020: 9k barrier Foretold <= Warning in Time
Jan 07, 2020: 8475 Top Call <= Mapped within $5
Jan 01, 2020: Sub 7k Foreseen
Dec 29, 2019: Big Picture Fibs <= the 3 Fibs of Life
Jun 02, 2019: 14k target call <=Perfect TP
May 12, 2019: 10k target call
Dec 03, 2018: 3.1k bottom call <=EXACT 2018 bottom
.
My "Book" detailing my Methodology with Numerous Examples:
Chapter 1: Introduction and numerous Examples
Chapter 2: Detailed views and Wave Analysis
Chapter 3: The Dreaded 9.618: Murderer of Moves
Chapter 4: Impulse Redux: Return to Birth place
Chapter 5: Golden Growth: Parabolic Expansions
Chapter 6: Give me a ping Vasili: one Ping only
.

BTC near term Retrace Targets: break and hold 9750 or test 9450Quick post for near term look at retrace.
Looks to be painting a classic "ABC" correction.
Perhaps a final shakeout going into the "Halving".
Probably in a "wave 4" down before wave 5 finale.
$ 9758-9783 is the key Resistance break to invalidate lower lows.
$ 9570-9585 is key support that MAY have been the bottom.
$ 9386-9395 should be very strong and should bounce hard.
$ 9256-9268 is pretty much Bulls' Last Stand but a juicy buy.
.
Recent Plots of this bounce:
Bottom of Crash : $3850 Bottom Taggged
Bounce Update 1: $6950 top Plotted
Bounce Update 2: $5900 launch caught
Bounce Update 3: $6600 top Plotted
Bounce Update 4: $6200 Foreseen
Bounce Update 5: $7300 top retrace
Bounce Update 6: $6600 Bottom mapped
Bounce Update 7: $6800 launch caught
Bounce Update 8: $9800 possible Top
Bounce Update 9: $9335 breakout call
.
The Big Picture: "One Fib to Rule them All":
.
My older charts catching every key turn and giving early warnings:
Mar 06, 2020: 9.2k Top Call
Feb 13, 2020: 10.5k Top call
Feb 10, 2020: 9.7k Bounce <= mapped within $10
Feb 08, 2020: 10k Targetted
Jan 17, 2020: 9k barrier Foretold <= Warning in Time
Jan 07, 2020: 8475 Top Call <= Mapped within $5
Jan 01, 2020: Sub 7k Foreseen
Dec 29, 2019: Big Picture Fibs <= the 3 Fibs of Life
Jun 02, 2019: 14k target call <=Perfect TP
May 12, 2019: 10k target call
Dec 03, 2018: 3.1k bottom call <=EXACT 2018 bottom
.
My "Book" detailing my Methodology with Numerous Examples:
Chapter 1: Introduction and numerous Examples
Chapter 2: Detailed views and Wave Analysis
Chapter 3: The Dreaded 9.618: Murderer of Moves
Chapter 4: Impulse Redux: Return to Birth place
Chapter 5: Golden Growth: Parabolic Expansions
Chapter 6: Give me a ping Vasili: one Ping only
.

9335 and 28 cents: BTC line in sand before 9928Presented here is the "Golden Fib of 2019/20".
This series has defined all key turning points.
Bulls are at the last key hurdle before $9928.
This is NOT the only hurdle, but the immediate big one.
We can expect serious resistance going into $9500 for sure.
Then we have the Impulse Core starting at $9626 (click).
.
Recent Plots of this run:
Bottom of Crash : $3850 Bottom Taggged
Bounce Update 1: $6950 top Plotted
Bounce Update 2: $5900 launch caught
Bounce Update 3: $6600 top Plotted
Bounce Update 4: $6200 Foreseen
Bounce Update 5: $7300 top retrace
Bounce Update 6: $6600 Bottom mapped
Bounce Update 7: $6800 launch caught
Bounce Update 8: $9200 possible Top
.
My older charts catching every key turn and giving early warnings:
Mar 06, 2020: 9.2k Top Call
Feb 13, 2020: 10.5k Top call
Feb 10, 2020: 9.7k Bounce <= mapped within $10
Feb 08, 2020: 10k Targetted
Jan 17, 2020: 9k barrier Foretold <= Warning in Time
Jan 07, 2020: 8475 Top Call <= Mapped within $5
Jan 01, 2020: Sub 7k Foreseen
Dec 29, 2019: Big Picture Fibs <= the 3 Fibs of Life
Jun 02, 2019: 14k target call <=Perfect TP
May 12, 2019: 10k target call
Dec 03, 2018: 3.1k bottom call <=EXACT 2018 bottom
.
My "Book" detailing my Methodology with Numerous Examples:
Chapter 1: Introduction and numerous Examples
Chapter 2: Detailed views and Wave Analysis
Chapter 3: The Dreaded 9.618: Murderer of Moves
Chapter 4: Impulse Redux: Return to Birth place
Chapter 5: Golden Growth: Parabolic Expansions
Chapter 6: Give me a ping Vasili: one Ping only
.

BTC bears' last chance to start big Dip before Halving: 9020 keyQuick update and heads up, $9020 is now the line in sand.
Break above invalidates a deeper retrace to the 7900 area.
If bears hold then a rejection should accelerate downward.
The pullback from 9400 resembles a classic ABC correction.
BUT it is possible it was a truncated wave C and completed.
IF so, we should STILL see a dip for wave 2 of new 12345 up.
Whichever direction it goes from here, we will have new clues.
I will post updates below as price action develops further.
If dip is invalidated, I will post a new Idea with Bull targets.
Blurry numbers on chart? That is a TV rendering bug.
Click Here for a Snapshot , hopefully with clear numbers.
.
Recent Plots of this bounce:
Bottom of Crash : $3850 Bottom Taggged
Bounce Update 1: $6950 top Plotted
Bounce Update 2: $5900 launch caught
Bounce Update 3: $6600 top Plotted
Bounce Update 4: $6200 Foreseen
Bounce Update 5: $7300 top retrace
Bounce Update 6: $6600 Bottom mapped
Bounce Update 7: $6800 launch caught
Bounce Update 8: $9200 possible Top
.
The Big Picture: "One Fib to Rule them All":
.
My older charts catching every key turn and giving early warnings:
Mar 06, 2020: 9.2k Top Call
Feb 13, 2020: 10.5k Top call
Feb 10, 2020: 9.7k Bounce <= mapped within $10
Feb 08, 2020: 10k Targetted
Jan 17, 2020: 9k barrier Foretold <= Warning in Time
Jan 07, 2020: 8475 Top Call <= Mapped within $5
Jan 01, 2020: Sub 7k Foreseen
Dec 29, 2019: Big Picture Fibs <= the 3 Fibs of Life
Jun 02, 2019: 14k target call <=Perfect TP
May 12, 2019: 10k target call
Dec 03, 2018: 3.1k bottom call <=EXACT 2018 bottom
.
My "Book" detailing my Methodology with Numerous Examples:
Chapter 1: Introduction and numerous Examples
Chapter 2: Detailed views and Wave Analysis
Chapter 3: The Dreaded 9.618: Murderer of Moves
Chapter 4: Impulse Redux: Return to Birth place
Chapter 5: Golden Growth: Parabolic Expansions
Chapter 6: Give me a ping Vasili: one Ping only
.

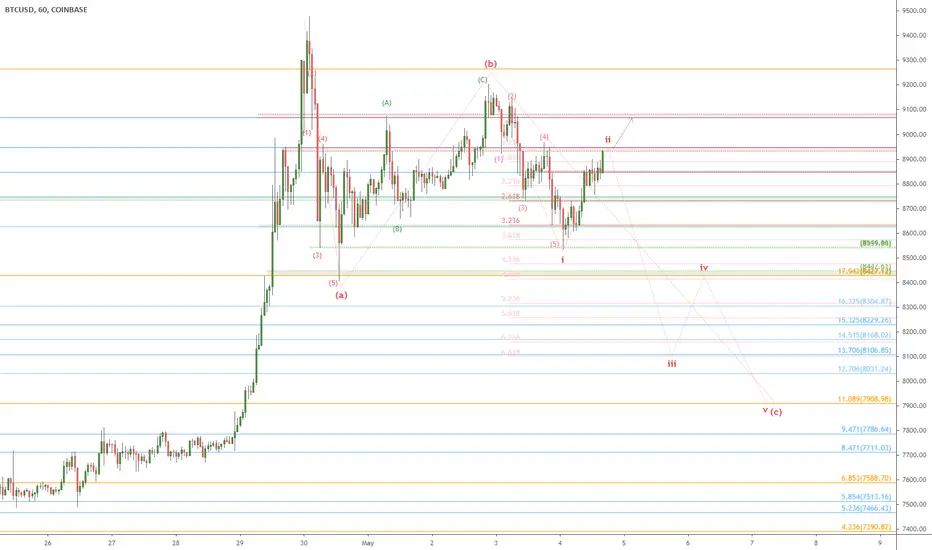
BTC at key Decision Zone: Wave C to start? or Bulls to gore it?Quick post and heads of possible strong pullback to come.
The consolidation from 9.4k top looks like an a-b-c wave.
Thus far waves (a) and (b) have the exact structure needed.
It is POSSIBLE that wave (ii) of (c) goes a little higher, testing $9100.
It is PROBABLE that wave (ii) will fail just below $9000 round number.
It is PLAUSIBLE that wave (i) was actually wave (c) and we move on up.
$ 845x area be pretty strong, so bears will need to tear thru it quickly.
$ 810x area should bounce well, possibly to retest previous support.
$790x is the expected target, essentially erasing the parabolic leg.
.
Recent Plots of this bounce:
Bottom of Crash : $3850 Bottom Taggged
Bounce Update 1: $6950 top Plotted
Bounce Update 2: $5900 launch caught
Bounce Update 3: $6600 top Plotted
Bounce Update 4: $6200 Foreseen
Bounce Update 5: $7300 top retrace
Bounce Update 6: $6600 Bottom mapped
Bounce Update 7: $6800 launch caught
Bounce Update 8: $9200 possible Top
.
The Big Picture: "One Fib to Rule them All":
.
My older charts catching every key turn and giving early warnings:
Mar 06, 2020: 9.2k Top Call
Feb 13, 2020: 10.5k Top call
Feb 10, 2020: 9.7k Bounce <= mapped within $10
Feb 08, 2020: 10k Targetted
Jan 17, 2020: 9k barrier Foretold <= Warning in Time
Jan 07, 2020: 8475 Top Call <= Mapped within $5
Jan 01, 2020: Sub 7k Foreseen
Dec 29, 2019: Big Picture Fibs <= the 3 Fibs of Life
Jun 02, 2019: 14k target call <=Perfect TP
May 12, 2019: 10k target call
Dec 03, 2018: 3.1k bottom call <=EXACT 2018 bottom
.
My "Book" detailing my Methodology with Numerous Examples:
Chapter 1: Introduction and numerous Examples
Chapter 2: Detailed views and Wave Analysis
Chapter 3: The Dreaded 9.618: Murderer of Moves
Chapter 4: Impulse Redux: Return to Birth place
Chapter 5: Golden Growth: Parabolic Expansions
Chapter 6: Give me a ping Vasili: one Ping only
.
BTC topped EXACTLY as expected, now "B ware wave B"Hope my last Top Warning helped bulls exit or at least not buy the top.
Quick heads up that we might be headed for a quick drop soon.
The drop thus far fits a perfect "ABC" structure, now in wave B.
So this could start wave "3 of C" soon, and 3's are always furious.
It is POSSIBLE that we range between zones for a while.
It is PLAUSIBLE that we retest 9k before next leg down.
It is PROBABLE that we will see a lower low as yet.
Blurry numbers on chart? Click here for a Snapshot .
(there has been a TV rendering bug causing this).
Recent Plots of this bounce:
Bottom of Crash : $3850 Bottom Taggged <= Within Pennies
Bounce Update 1: $6950 top Plotted
Bounce Update 2: $5900 launch caught
Bounce Update 3: $6600 top Plotted
Bounce Update 4: $6200 Foreseen
Bounce Update 5: $7300 top retrace
Bounce Update 6: $6600 Bottom mapped
Bounce Update 7: $6800 launch caught
Bounce Update 8: $9300 Top Warning <= Must See
.
The Big Picture: "One Fib to Rule them All":
.
My older charts catching every key turn and giving early warnings:
Mar 06, 2020: 9.2k Top Call
Feb 13, 2020: 10.5k Top call
Feb 10, 2020: 9.7k Bounce <= mapped within $10
Feb 08, 2020: 10k Targetted
Jan 17, 2020: 9k barrier Foretold <= Warning in Time
Jan 07, 2020: 8475 Top Call <= Mapped within $5
Jan 01, 2020: Sub 7k Foreseen
Dec 29, 2019: Big Picture Fibs <= the 3 Fibs of Life
Jun 02, 2019: 14k target call <=Perfect TP
May 12, 2019: 10k target call
Dec 03, 2018: 3.1k bottom call <=EXACT 2018 bottom
.
My "Book" detailing my Methodology with Numerous Examples:
Chapter 1: Introduction and numerous Examples
Chapter 2: Detailed views and Wave Analysis
Chapter 3: The Dreaded 9.618: Murderer of Moves
Chapter 4: Impulse Redux: Return to Birth place
Chapter 5: Golden Growth: Parabolic Expansions
Chapter 6: Give me a ping Vasili: one Ping only
.

BTC bounce update 8: possible 7k retest in boundQuick post to give heads up for possible retest of 7k round.
Pullback thus far looks to be a bullish ABC structure so far.
"Bullish" ABC as in wave B challenged the local highs first.
7297-7300 is pretty much the IN-validation level.
7257-7270 should be pretty strong resistance for wave 4 end.
7120-7130 would a VERY bullish wave C end point, higher low.
If you see blurry numbers in chart, that is a TV bug, not on purpose.
Here is a snap shot of the chart hopefully with clear numbers:
.
Recent Plots of this bounce:
Bottom of Crash : $3850 Bottom Taggged
Bounce Update 1: $6950 top Plotted
Bounce Update 2: $5900 launch caught
Bounce Update 3: $6600 top Plotted
Bounce Update 4: $6200 Foreseen
Bounce Update 5: $7300 top retrace
Bounce Update 6: $6600 Bottom mapped
Bounce Update 7: $6800 launch caught
.
My older charts catching every key turn and giving early warnings:
Mar 06, 2020: 9.2k Top Call
Feb 13, 2020: 10.5k Top call
Feb 10, 2020: 9.7k Bounce <= mapped within $10
Feb 08, 2020: 10k Targetted
Jan 17, 2020: 9k barrier Foretold <= Warning in Time
Jan 07, 2020: 8475 Top Call <= Mapped within $5
Jan 01, 2020: Sub 7k Foreseen
Dec 29, 2019: Big Picture Fibs <= the 3 Fibs of Life
Jun 02, 2019: 14k target call <=Perfect TP
May 12, 2019: 10k target call
Dec 03, 2018: 3.1k bottom call <=EXACT 2018 bottom
.
My "Book" detailing my Methodology with Numerous Examples:
Chapter 1: Introduction and numerous Examples
Chapter 2: Detailed views and Wave Analysis
Chapter 3: The Dreaded 9.618: Murderer of Moves
Chapter 4: Impulse Redux: Return to Birth place
Chapter 5: Golden Growth: Parabolic Expansions
Chapter 6: Give me a ping Vasili: one Ping only
.

BTC bounce Update 7: now in Decision Zone going into Weekly OpenPart of my ongoing analysis of price action (see links below).
Please hit the LIKES to encourage more of these publications.
Between Mod duties and my own trading, it is not easy to post.
CHART NOTE:
If you are seeing "fuzzy" numbers, it is a bug with TV rendering, not on purpose.
As you know, price has been chopping aimlessly for several days.
The only clear result is that neither Bulls nor Bears are confident.
Maybe the new Weekly Open will bring some clues about sentiment.
Virus sentiment:
- China looks to be coming out of the Corona Death Grip.
- Europe may be near Peak spread Rate in Italy and Spain.
- America has yet to Flatten the Curve even in urban areas.
Economy sentiment:
- China claims to be re-opening businesses and factories.
- Europe still in lock down but maybe turning the corner.
- America will drop rescue money to people and companies.
.
Previous Plots of this bounce:
Bottom of Crash : $3850 Bottom Taggged
Bounce Update 1: $6950 top Plotted
Bounce Update 2: $5900 launch caught
Bounce Update 3: $6600 top Plotted
Bounce Update 4: $6200 Foreseen
Bounce Update 5: $7300 Top retrace
Bounce Update 6: $6600 Bottom?
.
The Big Picture pointing to $7413: "One Fib to Rule them All":
.
My older charts catching every key turn and giving early warnings:
Mar 06, 2020: 9.2k Top Call
Feb 13, 2020: 10.5k Top call
Feb 10, 2020: 9.7k Bounce <= mapped within $10
Feb 08, 2020: 10k Targetted
Jan 17, 2020: 9k barrier Foretold <= Warning in Time
Jan 07, 2020: 8475 Top Call <= Mapped within $5
Jan 01, 2020: Sub 7k Foreseen
Dec 29, 2019: Big Picture Fibs <= the 3 Fibs of Life
Jun 02, 2019: 14k target call <=Perfect TP
May 12, 2019: 10k target call
Dec 03, 2018: 3.1k bottom call <=EXACT 2018 bottom
.
My "Book" detailing my Methodology with Numerous Examples:
Chapter 1: Introduction and numerous Examples
Chapter 2: Detailed views and Wave Analysis
Chapter 3: The Dreaded 9.618: Murderer of Moves
Chapter 4: Impulse Redux: Return to Birth place
Chapter 5: Golden Growth: Parabolic Expansions
Chapter 6: Give me a ping Vasili: one Ping only
.

BTC bounce Update 5: near term Support levels of interestQuick post to map some support zones and relevant fib levels.
Followers know that we caught the bottom and every turn since.
Target still remains 7.4-7.5k, but it is time for a pullback here.
Previous Plots of this bounce:
Possible Bottom: $3850 Bottom Taggged
Bounce Update 1: $6950 top Plotted
Bounce Update 2: $5900 launch caught
Bounce Update 3: $6600 top Plotted
Bounce Update 4: $6200 Foreseen
.
The Big PIcture: " One Fib to Rule them All ":
.
My older charts catching every key turn and giving early warnings:
9.2k Top Call
10.5k Top call
9.7k Bounce <= mapped within $10
10k Targetted
9k barrier Foretold <= Warning in Time
8475 Top Call <= Mapped within $5
Sub 7k Foreseen
Big Picture Fibs <= the 3 Fibs of Life
14k target call <=Perfect TP
10k target call
3.1k bottom call <=EXACT 2018 bottom
.
Educational Posts about my Methods:
Chapter 1: Introduction and numerous Examples
Chapter 2: Detailed Samples and Wave Analysis
Chapter 3: The Dreaded 9.618: Murderer of Moves <= Current Example
Chapter 4: Impulse Redux: Return to Birth place
Chapter 5: Golden Growth: Parabolic Expansions
Chapter 6: Give me a ping Vasili: one Ping only
.

BTC bounce UPDATE 3: or whats left of the bounceQuick post to map nearby support zones as we retrace the bounce.
Time of post is just before weekly open for traditional markets.
Crypto has been sliding downward all weekend but due for a bounce.
Currently in a "Decision Zone" with contradicting Fib signals.
Blue 4.618 wants to declare end of weekend dump wave.
Red 4.236 denying permission and pointing to red 4.618
.
Previous Plots of this bounce:
Possible Bottom: $3850 Ping / Bounce
Bounce Update 1: $6950 top Plotted
Bounce Update 2: $5900 launch caught
Earlier Plots catching every turn:
9.2k Top Call
7.7k Retrace Target
10.5k Top call
9.7k Bounce <= mapped within $10
9k barrier Foretold <= Warning in Time
8475 Top Call <= Mapped within $5
Sub 7k Foreseen
Big Picture Fibs <= the 3 Fibs of Life
14k target call <=Perfect TP
3.1k bottom call <=EXACT 2018 bottom

BTC big picture and why $7413 is absolutely CRITICALAll markets have been falling precipitously.
Bitcoin is nearing a major "line in the sand".
Plotted is the parabolic bull run of 2019.
This is an example of a "Golden Fib".
Gold lines are 1.618 x previous Gold.
Blue lines are 1.236/.382 x last Gold.
This fib helped me plot/trade all of 2019 till now.
The true beauty is in the Simplicity of the chart.
Each line is a decision point for any trade position.
My previous charts catching every key turn and giving early warnings (click the links below):
7.7k Retrace
10.5k Top call
9.7k Bounce <= mapped within $10
10k Targetted
8.2k to 10k wave 5
9k barrier Foretold <= Warning in Time
8475 Top Call <= Mapped within $5
Big Picture Fibs <= the 3 Fibs of Life
14k target call <= Perfect Top map
10k target call
3.1k bottom call <= EXACT 2018 bottom
Of course, I have had total FAILS on some ideas too, not going to pretend.
But all of my plots show PRECISE entries, TIGHT stops, and EXACT targets.
Precision is the way of the Fib. Almost every turn happens at a Fib Line.
.

SPX pullback UPDATE 2: "wave B being Born"Update to my initial Retrace Plot before new Highs (click) .
The pullback has been stronger that expected in above plot.
We have probably only painted a "wave A" and now in wave B.
The height and fib-ness of wave B will help to map wave C paths.
It is POSSIBLE that correction is done (levels say yes, structure says no)
It is LIKELY to get a decent bounce (B) and then another leg down (C).
It is PLAUSIBLE that C dips only a little lower than A (strong support).
Previous Analysis (click links below):
Jan 16, 2019: Call for Top or Near Top
Jan 27, 2019: Initial plot of Virus effect
Jan 29, 2019: Virus effect A-B-C plot
Feb 24, 2019: Initial plot Dip to New Highs
Feb 25, 2019: Dip update 1 - Early plot
Feb 26, 2019: Dip update 2 - Wave B targets

AMD at or near a "Top"? Advanced Micro Devices flying TOO high?AMD has been flying as China talks came off the front page.
Now it is approaching some major resistance zones to watch.
This would be a good place for "bad news" to be released soon.
$ 46.60-47.29 "should" have been the top but has extended beyond.
$ 48.97-49.41 is immediate resistance that is already showing validity.
$ 52.07-52.62 is likely to be hit and likely to push back against price.
There are other zones ABOVE the chart window.
Drag PRICE scale DOWN to see other zones above.
Drag PRICE scale UP to reduce overlapping numbers.
.
See some of my other plots and trade calls below.
I also plot Forex and Crypto, take a look at my profile page .
TSLA $500 Target <= still in play
Peloton Top Call
FORD in No-Mans Land
AMZN decision Point
FaceBook bounce
Twitter bounce
NetFlix bounce
Amazon scalp
Oil long
Of course, I have had total FAILS on some ideas too, not going to pretend.
But all of my plots show PRECISE entries, TIGHT stops, and EXACT targets.
Precision is the way of the Fib. Almost every turn happens at a Fib Line.
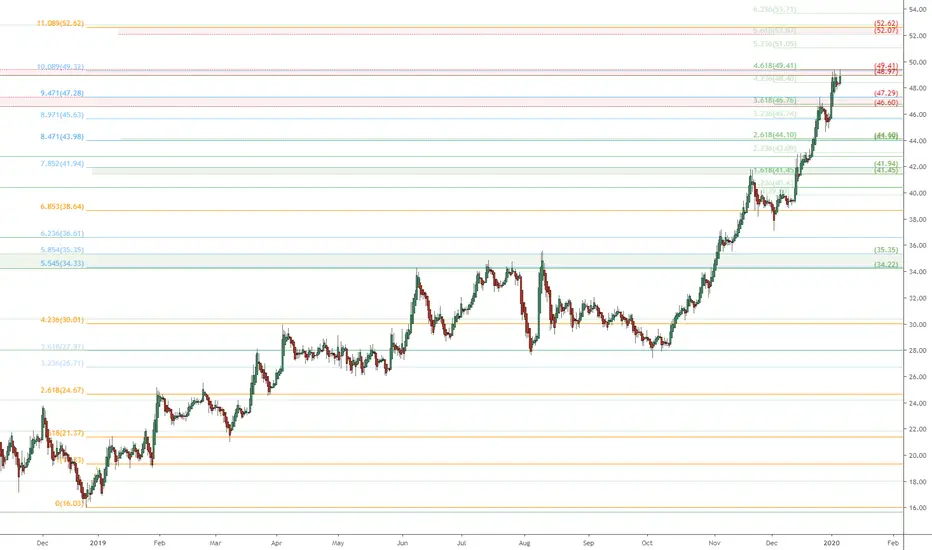
LINK.usd Vigorous Bounce about Done? ChainLink Resistance zonesLINK is one of the first alts to take off after the bitcoin spike.
Climbing in a near vertical path, and we all know that means :(
Let us hope for a controlled retrace that profits bears AND bulls.
Plotted are 3 upcoming resistance zones and individual Fib Lines.
Any one of these zones or lines could halt price and start retrace.
We may be in "wave 3", with w4 retrace and w5 final leg up to come?
$ 2.38-2.40 is first resistance zone enforced by the 2.40 Round number.
$ 2.47-2.50 will be VERY STRONG with multiple fibs and 2.50 round.
$ 2.58-2.60 is the MAXIMUM expected before a significant pullback.
.
Previous LINK analysis (click):
$1.95 Topping Map
Early Correction Estimate (early dip estimate)
Retrace Bounce Scalps (quick easy pips)
$2.87 Target Call (perfect exits)
$2.65 Support Call (several long entries)
$2.71 target plotted (perfect roadmap)
Support/Bounce zones (caught recent bottom)
Breakout Zones plot (caught the breakout)
May 2019 support zones (caught all turns)
$1.46 Bottom Call (caught exact bottom)
Of course, I have had total FAILS on some ideas too, not going to pretend.
But all of my plots show PRECISE entries, TIGHT stops, and EXACT targets.
Precision is the way of the Fib. Almost every turn happens at a Fib Line.
.
