BTC "Ping" that should break 50k again, to 52.8k next major fibPlotted here is Bitcoin's " Genesis Fib ", in 3 different timeframes.
Every one of these levels has been key on the way up and down.
We have just bounced with a " Ping " on last major fib before 50k.
.
I do not use "Fibs" in the "traditional" manner (retracements).
I use Fibs to plot "Ripples" (extensions) created by "Impulses".
Then look for "Confluences" to map the "interference Pattern".
My TV collection of ideas detailing the Concepts:
Chapter 1: Introduction and numerous Examples
Chapter 2: Detailed views and Wave Analysis
Chapter 3: The Dreaded 9.618: Murderer of Moves
Chapter 4: Impulse Redux: Return to Birth place
Chapter 5: Golden Growth: Parabolic Expansions
Chapter 6: Give me a ping Vasili: 'one' Ping only
.
Search in ideas for "PLOT"

DASH.usd near term Support Resistance map, $26x maybe local topPlotted are 3 different fib series from different time frames.
The thick Gold and Blue levels are from a very high tf fib series.
The others are local, including one for the last leg up from $185.
$ 265 - 268 would make for a good topping zone.
$ 232 - 233 is a good immediate support to hold.
$ 233.45 Golden fib is a MUST-Hold to keep trend.
For reference, here is the "Big" fib with the thick lines (weekly timeframe):
.
I do not use "Fibs" in the "traditional" manner (retracements).
I use Fibs to plot "Ripples" (extensions) created by "Impulses".
Then look for "Confluences" to map the "interference Pattern".
My TV collection of ideas detailing the Concepts:
Chapter 1: Introduction and numerous Examples
Chapter 2: Detailed views and Wave Analysis
Chapter 3: The Dreaded 9.618: Murderer of Moves
Chapter 4: Impulse Redux: Return to Birth place
Chapter 5: Golden Growth: Parabolic Expansions
Chapter 6: Give me a ping Vasili: 'one' Ping only
Chapter 7: The Mighty 2.618: like a Rook in Chess
.

FET coming up to a MAJOR level, expect a pullback from $ 0.4836Plotted is a single Fib series, of the "Golden" expansion sequence.
Coming up is a Golden (major) ratio at 0.4836 which will be a key.
Rejection likely on first kiss or several, but break shows strength.
NOTE: chart is Fet/usdT (tether) so levels could be a little different.
.
I do not use "Fibs" in the "traditional" manner (retracements).
I use Fibs to plot "Ripples" (extensions) created by "Impulses".
Then look for "Confluences" to map the "interference Pattern".
My TV collection of ideas detailing the Concepts:
Chapter 1: Introduction and numerous Examples
Chapter 2: Detailed views and Wave Analysis
Chapter 3: The Dreaded 9.618: Murderer of Moves
Chapter 4: Impulse Redux: Return to Birth place
Chapter 5: Golden Growth: Parabolic Expansions <= Current Example
Chapter 6: Give me a ping Vasili: 'one' Ping only
Chapter 7: The Mighty 2.618: like a Rook in Chess
.

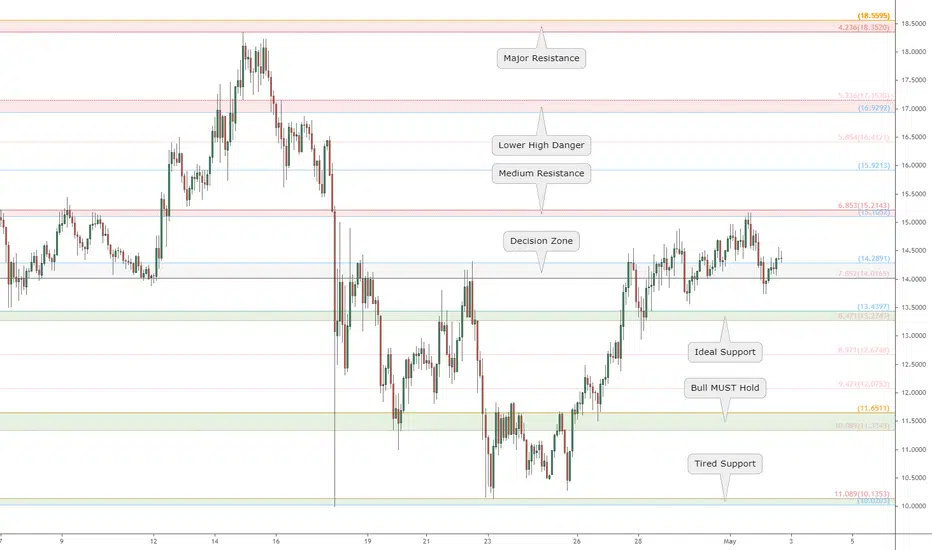
OMG major Target and Heads Up at $15.51: take some/all profitsPlotted are three different fib series from different timeframes.
Each level likely to relevant, higher timeframes fibs more so.
Confluence areas of the fibs are of special interest for turns.
Left Side is the "Genesis" wave since introduction at Coinbase.
Right Upper adds Dashed fib of uptrend from Covid Crash bottom.
Right Lower adds Dotted fib of last Impulse wave up from $8.5.
4.236 is the most common End Point of such a wave.
2.618 is the most common Mid Point to retrace from.
1.618 is the most common support after wave ends.
It is POSSIBLE that it goes past the 4.236.
It is PROBABLE that it retraces from there.
It is PLAUSIBLE that it can not be reached.
.
I do not use "Fibs" in the "traditional" manner (retracements).
I use Fibs to plot "Ripples" (extensions) created by "Impulses".
Then look for "Confluences" to map the "interference Pattern".
My TV collection of ideas detailing the Concepts:
Chapter 1: Introduction and numerous Examples
Chapter 2: Detailed views and Wave Analysis
Chapter 3: The Dreaded 9.618: Murderer of Moves
Chapter 4: Impulse Redux: Return to Birth place
Chapter 5: Golden Growth: Parabolic Expansions
Chapter 6: Give me a ping Vasili: 'one' Ping only
Chapter 7: The Mighty 2.618: like a Rook in Chess
.

SUSHI at a key Decision point: Range bound but looking to breakPlotted are the nearby Support and Resistance zones.
Currently in neutral grey area looking for decisive action.
If it is to start next leg upward, now would be a good time.
Drag the PRICE scale DOWN to see zones outside of window.
Drag the TIME scale RIGHT to see more price action around fibs.
Use the "Make it Mine" option under SHARING for your own copy.
.
I do not use "Fibs" in the "traditional" manner (retracements).
I use Fibs to plot "Ripples" (extensions) created by "Impulses".
Then look for "Confluences" to map the "interference Pattern".
My TV collection of ideas detailing the Concepts:
Chapter 1: Introduction and numerous Examples
Chapter 2: Detailed views and Wave Analysis
Chapter 3: The Dreaded 9.618: Murderer of Moves
Chapter 4: Impulse Redux: Return to Birth place
Chapter 5: Golden Growth: Parabolic Expansions
Chapter 6: Give me a ping Vasili: 'one' Ping only
Chapter 7: The Mighty 2.618: like a Rook in Chess
.
29,806 and 96 cents: Where BTC could "Top" without hitting 30k !Plotted are two fib sequences from drastically different timeframes.
Thick Blue lines are from Bitcoin's "Genesis" Sequence, posted here (click) .
Thin Green lines are local "Pulse" fib, which sets the increment of movement.
The precise confluence of both fibs at 29,806 is very interesting.
IF we get there, we can expect on of two reactions at that level:
1) Reject instantly, or 2) Go into "orbit" around it and decide later.
.
I do not use "Fibs" in the "traditional" manner (retracements).
I use Fibs to plot "Ripples" (extensions) created by "Impulses".
Then look for "Confluences" to map the "interference Pattern".
My TV collection of ideas detailing the Concepts:
Chapter 1: Introduction and numerous Examples
Chapter 2: Detailed views and Wave Analysis
Chapter 3: The Dreaded 9.618: Murderer of Moves
Chapter 4: Impulse Redux: Return to Birth place
Chapter 5: Golden Growth: Parabolic Expansions
Chapter 6: Give me a ping Vasili: one Ping only
.

UNI.usd at a "Must Bounce" level, even if NOT the "bottom"Plotted are two different fib series.
One "Golden" (parabolic) extensions.
One "Linear" (geometric) in Red zones.
Just hit a "Double Fib" (tight confluence).
Red fib levels have been reacting precisely.
Now at red 2.618 right on top of blue 12.706.
This is a follow up to an earlier plot just after Coinbase launch:
.
My "Book" detailing my Methodology with Examples:
Chapter 1: Introduction and numerous Examples
Chapter 2: Detailed views and Wave Analysis
Chapter 3: The Dreaded 9.618: Murderer of Moves
Chapter 4: Impulse Redux: Return to Birth place
Chapter 5: Golden Growth: Parabolic Expansions
Chapter 6: Give me a ping Vasili: one Ping only
.

BTC Long Term Entry and Exit using Fibonacci Time ZonesPlotting a Fibonacci Time Zone between 2011 peak and 2013 peak produces a 1.618 extension at the bottom of the 2014 bear and a 2.168 extension at the top of the 2017 bull. Seemingly defining both trends before hand. I have plotted the same time zone between 2013 peak and 2017 peak, let's see if these extensions are able to predict the trends again.

BTC/M2: A different ViewPLOTING btc price over M2 tells a much, much different story.
We have been the biggest accumulation of an asset in the history, shaking out retail all over 2021. This cycle is not over, and retail FOMO is yet to come...
2022/2023 possible market top.

Bitmex Futures vs. SpotPlots the Bitmex June 2021 futures vs. Spot price
Contracts are XBTM21 (June 21)
XBTUSD (Perpetual contract)
This idea plots (XBTM21 - XBTUSD) as the blue series and plots XBTUSD as the candlestick series
The bitmex june future was trading at a $6,000 premium earlier today! Now has dropped back to $5,000.
Upon expiry the future spread will drift to zero ... So, selling short the future vs. spot you have is a great arbitrage trade if you want to capture the premium risk-free

DisneyPlotted. Was going as per plan. Then GAPPED. So missed. Better luck next time.
or to wait for a breakout formation as long as the Gapped bar is not broken.

Monthly BTC index fib levelsPlotting fib levels on the monthly I noticed a pattern. After a run we find an average around .786. Plotting the fibs based off the pull back then gives us an ATH target for the next run at 30.618 with the exception of this last run ending at 18.618. Assuming this pattern continues that puts the next ATH between $312,508(18.618) and $511,902(30.618) and a bottom of the 48,000 range. *assuming* these are the rough future highs and lows. Case 1 and 2 show possible price targets for the following run should the pattern repeat.
Halving events marked in white vertical lines for time frame reference


RANGE-TRADING SYSTEM!!! -simple but ...:)$$$ $SPY $EBAY $NVDA...Plot LInear Regression as much as possible horizontal, close to 0.000
With the number YOU get plot EMA, BB with 1&2 deviation and Stoch.
For clues plot Ichimoku standard line and for divergence CMO or other indicators You like - settings according to your trading plan.
YOU can use this system on all timeframes - on lower timeframes You must change settings more often to plot horizontal LINREG... (use also different deviations of LINREG...
just WATCH, DECIDE, INNoVATE and make $$$ - GLT.
EURUSD - Bearish ChannelPlotted a narrow channel on the 4hr that price seems to be sticking too. Interested to see when it will breakout, for the next 72 hours however I anticipate a few retests as plotted with the blue arrows.
I am a Premium Student of the Diamond Forex Academy; instagram.com/diamondforex/
My personal tutor is Masum, a Top Author on TradingView; uk.tradingview.com/u/masumhussain/

Another takePlotted it in terms of BTC and not USD.
Took the Fib's off, plotted two lines or resistance that need to be broken.
Hope you like it?

Spreader Pro Plot the spread of any two securities as -,+,/ or *
This enhanced version adds the 50 day sma of the spread as a gray plot
Another free and very useful indicator courtesy of Tarzan.

Is the correction over? in the NasdaqPlotted the possible moves in the Nasdaq to explore the next target levels for support and resistance

BNBUSD - Double Top ScenarioPlotting a second double top that could push BNB way lower
Bars pattern in red shows this drop
This is the daily chart for BNB
Cautionary chart

AXP - Parabolic CurvePlotting a parabolic curve that acts as a support along the fib circle
Price dumps along each of the circle lines just to recover along the curved dotted line comes into play
The next dump will be down to the pink line after we see the finishing of bull movement
Bullish idea on this weekly timeframe

Plotted by TrumpI’ve been telling people that this is just a panic sell that people are doing, just keep your position no matter which price it goes to. 55,50,45,40. Its okay because ive advised to buy crude without leverage for investing. Its time to buy more actually!
I got some more positions yesterday, and might get another if it falls to 55. 👌
Keep it up because our trades will be profitable😁
Levels for NQ come Sunday / Monday.Plotted from 4 hour candles looking for areas of interest along with 15 min candles. . My personal assumptions to see how my modeling will play out. Not financial advice.

ETHUSDT (Ethereum) Using Elliott Waves: Back to 1K? Plotting waves on Ethereum: The current correction may be a larger degree wave (2) or a wave (4) consolidation. Taking either would depend on the analyst's bias.
In both the cases, what matters is spotting the corrective patterns and participating in the larger impulses.
The June'22 bottom is a relevant one as many coins bottomed out then. But have we made a long term bottom on ETH or not? This upmove on Ethereum does not seem impulsive in the eyes of EW. With the trendline broken and monthly RSI going for a reset, the alt season may not be here anytime soon.
If this move is supported, we can see a sharp decline in the coming months taking the price back to 1K (or slightly below). The political interference on crypto can keep giving random shakeouts so it is important to keep a firm view on either side. Until the price remains below 3K, I would like to keep my bearish view.
