Short the Cypher @D // IF=THEN ®FX:AUDCAD
A closer look at this pair:
1. The 3h chart, forged supportH1 and price still above it;
2. This is the C point for an eventual Cypher Pattern that points to previous supportW1 (now resistance);
3. IF this patterns completes,a the first target is the supportD1 , and the second is the resistanceH4 , the 38.2% and 61.8% respectively;
4. The finalization of a Double Bottom formation on higher timeframe;
5. The Right Shoulder of an weekly H&S formation. (check previous published idea for the appropriate view);
CYPHER :
Point B:
38.2% to 61.8% XA
Point C:
127% to 141% ext XA
Point D:
78.6% XC
Targets:
TP1 38.2% CD
TP2 61.8% CD
Ratios here:
Safe trades;
Search in ideas for "RATIO CHART"

Eventual AB=CD pattern // Bearish Cypher // IF=THEN ®FX:GBPUSD
Eventual AB=CD setup with target synced with point C for Pink Cypher, a supportH4 appears to be broken along the way at 1.52580 and at the same time, does not invalidate the green major Cypher pointing around 1.53800.
Short the CYPHERS :
Point B:
38.2% to 61.8% XA
Point C:
127% to 141% ext XA
Point D:
78.6% XC
Target:
TP1 38.2% CD
TP2 61.8% CD
Ratios:
Safe Trades;
open.spotify.com

Daily // Two Bears facing one Bull // IF=THEN ®FX:EURJPY
Advanced patterns:
GARTLEY
Point B:
61.8% can not touch 78.6% XA
Point C:
38.2% to 88.6% AB
Point D:
78.6% XA
127% ext AB
Target:
TP1 38.2% AD
TP2 61.8% AD
BAT :
Point B:
38.2% to 50% XA
Point C:
38.2% to 88.6% AB
Point D:
88.6% XA
Targets:
TP1 38.2% AD
TP2 61.8% AD
CYPHER :
Point B:
38.2% to 61.8% XA
Point C:
127% to 141% ext XA
Point D:
78.6% XC
Target:
TP1 38.2% CD
TP2 61.8% CD
Ratios here:

Bearish and Bullish Patterns // IF=THEN ®FX:SPX500
GARTLEY
Point B:
61.8% can not touch 78.6% XA
Point C:
38.2% to 88.6% AB
Point D:
78.6% XA
127% ext AB
Target:
TP1 38.2% AD
TP2 61.8% AD
CRAB
Point B:
38.2% to 61.8% XA
Point C:
38.2% to 88.6% AB
Point D:
161% ext XA
224% to 316% ext AB
Target:
TP1 61.8% CD
TP2 127% CD
Ratios:
Safe trades;

Gartley vs Structure // IF=THEN ®FX:EURJPY
Completed Bearish Gartley pattern:
Point B:
61.8% can not touch 78.6% XA
Point C:
38.2% to 88.6% AB
Point D:
78.6% XA
127% ext AB
Targets:
TP1 38.2% AD
TP2 61.8% AD
Ratios:
Safe trades;

The Canadian Bat // IF=THEN ®FX:CADJPY
Bearish Bat Pattern:
Short @D
Point B:
38.2% to 50% XA
Point C:
38.2% to 88.6% AB
Point D:
88.6% XA
Targets:
TP1 38.2% AD
TP2 61.8% AD
Ratios:
Safe trades;

2618 setup / Long the 61.8 retracement / Short Crab // IF=THEN ®FX:GBPUSD
Let's see what the market is cooking, at the moment began a retracement and pulled in 61.8% from previous weekly support.
IF the price break the previous structure, and IF starts a new fall that reaches the 61.8%, it forges one bullish 2618 setup with expectations of an upward move that by "default" breaks the nearest structure pressure zones, or resistances in this case, generaly speaking, IT CAN give us a rally.
At the same time, and this is why i'm publishing this idea a second time, and deleted previous on time, an eventual Crab pattern (with the point C at its limit) appeared on my sight with a target near previous structure zone. (look left)
Long the 61.8% retracement
Short the Crab when completed (point D)
CRAB
Point B:
38.2% to 61.8% XA
Point C:
38.2% to 88.6% AB
Point D:
161% ext XA
224% to 316% ext AB
Targets:
TP1 61.8% CD
TP2 127% CD
Ratios:
Safe trades;

Bearish Cypher rules // IF=THEN ®FX:EURUSD
Bearish CYPHER:
Point B:
38.2% to 61.8% XA
Point C:
127% to 141% ext XA
Point D: (SHORT)
78.6% XC
Targets:
TP1 38.2% CD
TP2 61.8% CD
Ratios:

Bullish Patterns // IF=THEN ®FX:AUDNZD
CYPHER:
Point B:
38.2% to 61.8% XA
Point C:
127% to 141% ext XA
Point D:
78.6% XC
Targets:
TP1 38.2% CD
TP2 61.8% CD
BAT:
Point B:
38.2% to 50% XA
Point C:
38.2% to 88.6% AB (close below point A)
Point D:
88.6% XA
Targets:
TP1 38.2% AD
TP2 61.8% AD
Ratios:

Call 112 - There's a sick selling dollar ;) // IF=THEN ®A lot of things i see here for FX:USDJPY
1. Major Cypher(1) pointing 112.0; (note:* for this cypher(1) I took the impulse leg with the candle that breaks out the structure and not the bottom of structure, marked on chart with yellow circle);
2. Double top formation forging a 2618 trade setup; (a little lame because the second attempt did not even touched the close price of the first attempt, but the behaviour of price action is very very similar)...
... Double top, breakout the previous structure support, retracement expected on support and hit the 61.8% (also tested previous daily trendline), sell opportunity with expectancy to break previous structure support (D1);
3. Eventual AB=CD basic pattern born after breakout the weekly support(W1) confirmed with the 61.8% (also part of 2618 setup, as always) pointing the same target around 112.0;
4. Another Cypher(2) with target for point C around the same price, the 112.0; (4h chart looks better)
Trend lines:
1. Bullish Weekly and Monthly trend NOT broken unless the price forges point C below it;
2. Daily trend already broken (part of the confirmation process of this double top trade setup formation)
Check ratios:
CYPHER:
Point B:
38.2% to 61.8% XA
Point C:
127% to 141% ext XA
Point D:
78.6% XC
Targets:
TP1 38.2% CD
TP2 61.8% CD
Special note: All of this can go wrong if the market keeps rising for dollar ;), in fact it can go higher than those 61.8% creating a "triple top" or even going higher, so take safe trades.
Sorry about the "mess" ;)
Safe trades;
Trading_Jazz

15m Bearish Cypher & Gartley patterns // IF=THEN ®FX:GBPUSD
BEARISH CYPHER:
Point B:
38.2% to 61.8% XA
Point C:
127% to 141% ext XA
Point D:
78.6% XC
Targets:
TP1 38.2% CD
TP2 61.8% CD
BEARISH GATYLEY
Point B:
61.8% can not touch 78.6% XA
Point C:
38.2% to 88.6% AB
Point D:
78.6% XA
127% ext AB
Targets:
TP1 38.2% AD
TP2 61.8% AD
Short @D
Ratios:
Safe trades;

Bullish or Bearish!! IF=THEN ®FX:AUDUSD
BEARISH GARTLEY
Point B:
61.8% can not touch 78.6% XA
Point C:
38.2% to 88.6% AB
Point D: (EVENTUAL SELL OPTION)
78.6% XA
127% ext AB
Targets:
TP1 38.2% AD
TP2 61.8% AD
BULLISH CRAB
Point B:
38.2% to 61.8% XA
Point C:
38.2% to 88.6% AB
Point D: (EVENTUAL BUY OPTION)
161% ext XA
224% to 316% ext AB
Targets:
TP1 61.8% CD
TP2 127% CD
Check Ratios:
Safe Trades;

Clarifying Targets // Crab&Bat // IF=THEN ®Check previous published ideas for FX:EURUSD
Just to clarify potential targets for the Crab Pattern (and a Bat in the middle, Orange pattern).
Typically the point D ends with the XA extension and not as i demonstrate here an AB extension. But both of the targets are correct .
We can adjust those targets synced with previous structure, or taking into account the behaviour of price action at that time of the trade...
... in this case, both of the D point's are valid and synced with previous structure...
AB extension synced with previous structure highs (resistance) and XA extension with previous structure lows (support). Both now acting as Support obviously. ;)
BAT:
Point B:
38.2% to 50% XA
Point C:
38.2% to 88.6% AB
Point D:
88.6% XA
Targets:
TP1 38.2% AD
TP2 61.8% AD
CRAB
Point B:
38.2% to 61.8% XA
Point C:
38.2% to 88.6% AB
Point D:
161% ext XA
224% to 316% ext AB
Targets:
TP1 61.8% CD
TP2 127% CD
Hereupon...
Long @D ;)
Ratios here:
Safe Trades;
Trading_Jazz

Eventual Crab pointing to previous Highs around 318 // IF=THEN ®BITSTAMP:BTCUSD Bearish Crab
Previous published idea (The Daily Bat):
Bearish CRAB:
Point B:
38.2% to 61.8% XA
Point C:
38.2% to 88.6% AB
Point D:
161% ext XA
224% to 316% ext AB
Target:
TP1 61.8% CD
TP2 127% CD
Note*
This study is taking in consideration a rejection around 236.50 (resistance) and the beginning of a retracement that could reach the 88.6% from AB leg and above all, the point X to A as an impulse leg (strange one, indeed).
Ratios:
Safe trades;

Eventual Bat // IF=THEN ®FX:AUDCHF
Eventual Bearish Bat Pattern:
Short @D
Point B:
38.2% to 50% XA
Point C:
38.2% to 88.6% AB
Point D:
88.6% XA
Targets:
TP1 38.2% AD
TP2 61.8% AD
Ratios:
Safe Trades;

Once upon a time... IF=THEN ®... eventual Bearish Bat... FX:AUDCAD
Short @D
Point B:
38.2% to 50% XA
Point C:
38.2% to 88.6% AB
Point D:
88.6% XA
Targets:
TP1 38.2% AD
TP2 61.8% AD
Ratios:
Safe Trades;

Gartley target @ Support // IF=THEN ®FX:USDCAD
I don't know for sure it the price forges point B below or above 78.6% but it seems below...
Point B:
61.8% can not touch 78.6% XA
Point C:
38.2% to 88.6% AB
Point D: (Buy option)
78.6% XA
127% ext AB
Target:
TP1 38.2% AD
TP2 61.8% AD
Check previous published ideas:
Check Ratios:
Safe Trades;

Synced Patterns // IF=THEN ®FX:EURUSD
With a major target around 1.10 (check previous published idea - link below) the market present us with a few shot opportunities today...
Check ratios here:
Safe trades;

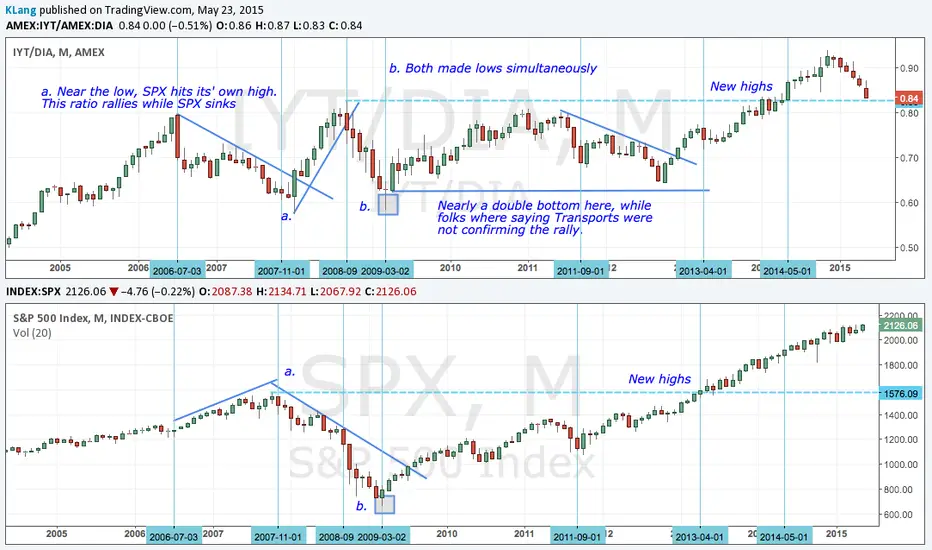
IYT/DIA ratio vs SPXSomeone on my twitter stream was concerned about IYT vs DIA. So I did a ratio chart which may or may not mean anything at all. Just for giggles.
Oil getting ready to seriously underperform gold This above breakdown is on a ratio chart measuring gold vs. oil.
Being all about weighing alternative scenarios in a probabilistic manner, another outcome that could be underway is the entire structure from W(V) high being a weak flat as B (labeled X on chart), failed to retrace all of A (labeled W). If this scenario were to play out, the most recent decline may still have it's own sub-waves 4 and 5 to complete to the downside.
Thanks to IvanLabrie for sharing this ratio chart a few weeks back now, follow our work for the latest setups in FX.

Gold is in a downtrend: Mapping support levelsGold is showing signs of an intermediate term downtrend, whereas silver has no signal of further continuation of the downtrend it began since the commodities boom in 2011.
The Silver/Gold ratio chart also shows an interesting level in effect, and a possible bottom, meaning it might be time to exchange our gold for silver...
As a sidenote, the usdollar/dxy chart is showing possible signs of an uptrend continuation of at least 6 weeks, so it's fairly possible that this forecast will be accurate. Intermediate term dollar strength before any meaningful reversal in gold.
I'll expand this post with a short term gold sell signal as well.
Cheers,
Ivan.

Pair Trade: Long Silver and Short Gold. Based on predictions of Fundamental Analysts, and in particularly Chris Weston's opinion.
Technically Ratio charts has broken Ichimoku cloud on Daily.
Initiating the following trade:
Long Silver Short Gold.
To make market neutral dollar value, proper dollar risk must be calculated for both contracts.
For example, for standard lots in Axitrader standard MT4 account we shall open the following trades:
Long XAGUSD 0.12 Lots
Short XAUUSD 0.08 Lots
It is almost neutral, the bias is only $250 towards Long XAGUSD.

LTCCNY - Litecoin Could Be About To See The Day Light - UpdatedUnfortunately, the support we identified in previously published chart gave way for another bearish move. Reviewing the wave counts are not made easy in instruments likes this particularly with lack of historical data.
However, it seems at least in this bearish cycle a pull back could be anticipated for the following reasons:
1. RSI at potential support.
2. ADX suggesting that the move is very stretched and corresponding pull back in price might be already in progress.
The Fib Extensions could often help but most of these are failing due to lack of proper pivot points and the fact that it has declined so much. Nevertheless I have adjusted the counts for wave (iv) & (v) suggesting that wave (v) is well advanced and could complete soon but caution should be exercised.
Conclusion is that once we get a pull back we still have 1 more drive to compete wave iv of (v) that could form a bottom near 8 or probably 5.
RSI noted above is also showing larger divergence in formation which if it holds could support the idea that final low could develop around 8 -5 zone.
LTC/BTC ratio chart has also broken down and is shown below with counts adjusted accordingly.
Similarly, the BTC daily chart we have been following as our roadmap also has some way to go yet, hence further weakness is expected and may be both will bottom together.
So unfortunately the light of day will shine through but appears to be postponed for now.
As always, do you own analysis and be quick to adjust you views according to progression of price data with time.
