GBPUSD Daily MACD divergenceThe GBPUSD daily chart is in a bearish channel but MACD is in a bullish channel. If price action breaks the 1.5274 resistance level we may see the bulls head towards the upper channel trend line or maybe even break through the channel for a nice bull run.
Search in ideas for "macd"

EURUSD Daily chart MACD divergenceThe EURUSD daily chart has a MACD divergence as price action may take a turn back upward.

Trendlines, Supply & Demand, MACD Resistance and SupportPrice Action, channel, supply & demand and MACD resistance. Example of using different techniques once one has finished. Price action is a fantastic tool.

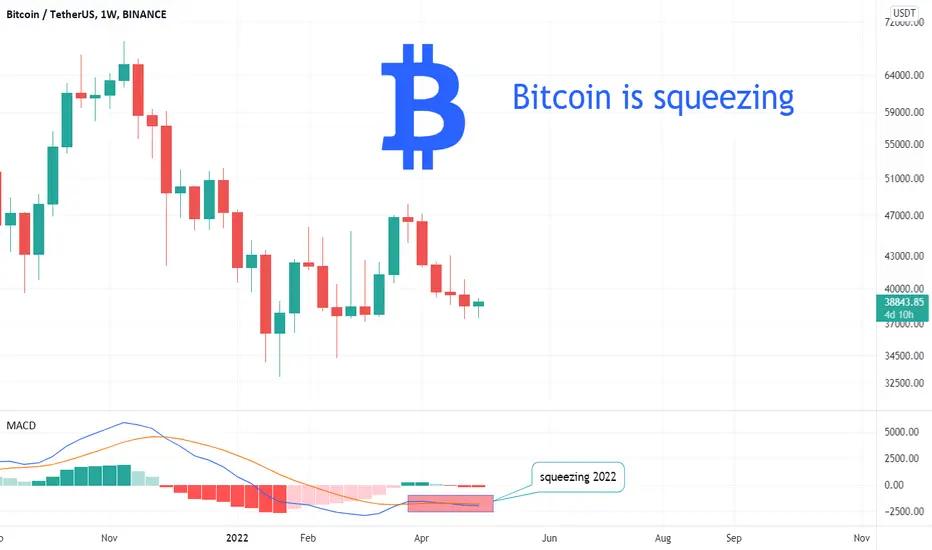
MACD: Bitcoin is squeezingMACD is a good tool for detecting squeezing. When squeezing happens, two MACD lines stick together and move horizontally. The charts below show this
over the years.
MACD now represents bitcoin squeezing. We should wait for a rapid jump in bitcoin (up or down) in the near future

EURJPY MACD Buy pattern vs Order Book on H1Interesting situation has rise: an almost formed macd Buy pattern (if reverse from 61-78 Fibo) and profit seller until 127.3.
In which direction price will prefere to run first?
I would set a Sell Limit at 128.000 where some SL clusters are, just in case. Also, it may be interesting to Sell until 127.235, where al profitable buyers were lost already nut also, big SL accumulation is.
If the price go down first, no problem for MACD. The Fibo has to be stretched.
I would encourage to Sell now with TP at 127.27, SL 127.83, then wait the price to reach 128.000 for another Sell, TP 127.385, SL 128.54.

NVDA broke above a triangle with rising MACDNVDA broke above an 8-month long triangle with rising momentum in MACD.

Divergence MACD- OILWe have clear divergence at MACD. In addition RSI is overselled. Good price to search a rebound to moving average.

GBP/USD Short (MACD, ADX signal)The GBP/USD has been fairly bullish recently. With the USD weak last week it gave the neutral GBP some power (as shown) With the USD going back neutral the pair should drop. This is shown both by the ANN strategy and MACD. The ADX is also low indicating a big movement. The resisitance line would be a good time to enter the trade and T1 shows some more resistance. Take out 1/3 of your contracts then so you can afford to lose some if it bounces back up. If T1 is broken there is not much resistance and it should drop quite a bit. Also look for the EMA's to cross. If they do it is more signal to short

Mastering the MACD - How to use it in trading?The MACD, or Moving Average Convergence Divergence, is one of the most widely used technical indicators in trading. It was developed by Gerald Appel in the late 1970s and is designed to reveal changes in the strength, direction, momentum, and duration of a trend in a stock's price. At its core, the MACD is a momentum oscillator, though it is commonly plotted as a line chart rather than the traditional bounded oscillators like the RSI. Despite being unbounded, traders use the MACD primarily to identify potential buy and sell signals.
What will be discussed?
- How does the MACD work?
- How to use the MACD in trading?
- Divergences
- Conclusion
How does the MACD work?
The MACD is calculated by subtracting the 26-period Exponential Moving Average (EMA) from the 12-period EMA. The result of this calculation is the MACD line. A nine-period EMA of the MACD line, known as the signal line, is then plotted on top of the MACD line. The third component is the MACD histogram, which represents the difference between the MACD line and the signal line. The histogram gives traders a visual cue about momentum: when the histogram bars are growing in height, momentum is increasing in the direction of the MACD line; when they shrink, momentum is slowing down.
How to use the MACD in trading?
Understanding how to use the MACD in trading requires some interpretation of the relationships between these components. One of the primary signals traders look for is a crossover between the MACD line and the signal line. When the MACD line crosses above the signal line, it is considered a bullish signal, suggesting that it might be a good time to buy. Conversely, when the MACD line crosses below the signal line, it indicates a bearish signal and potentially a good time to sell. These crossovers tend to be more significant when they occur below or above the zero line, which is where the MACD and signal line are equal. A crossover below the zero line followed by a move above it could signal the beginning of an uptrend, while a crossover above the zero line followed by a move below it might signal a downtrend.
Divergences
Another important application of the MACD is identifying divergence between the MACD and the price action of the asset. Divergence occurs when the price is moving in one direction and the MACD is moving in the opposite. For instance, if the price makes a new high but the MACD forms a lower high, it can be a warning sign that the upward momentum is weakening and that a reversal could be on the horizon. Similarly, if the price hits a new low but the MACD makes a higher low, it might suggest a potential bullish reversal.
Conclusion
In summary, the MACD is a versatile and powerful indicator that helps traders analyze the momentum and direction of a market trend. Its ability to provide both trend-following and momentum signals makes it a valuable tool in a trader’s toolkit. While it is not a standalone solution, when used properly and in conjunction with other strategies, the MACD can greatly enhance the accuracy and confidence of trading decisions.
Thanks for your support.
- Make sure to follow me so you don't miss out on the next analysis!
- Drop a like and leave a comment!

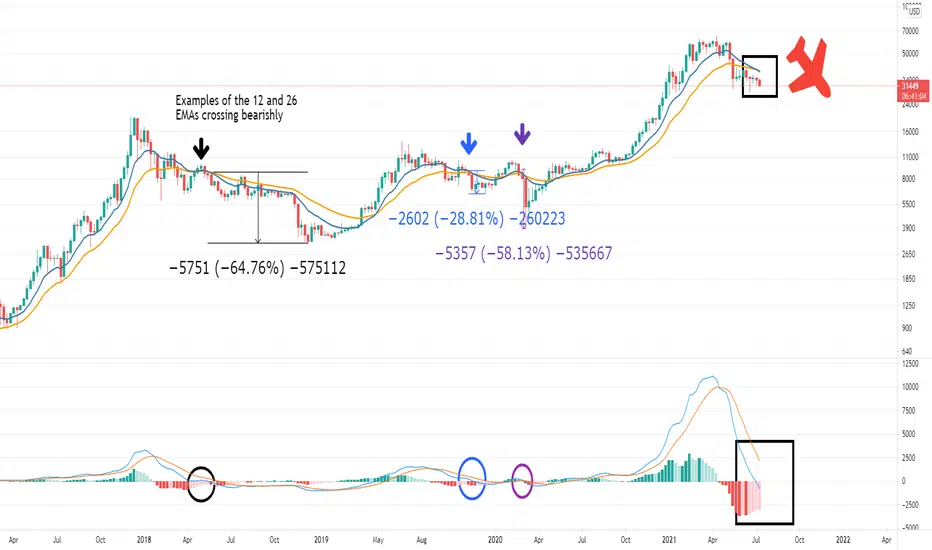
Visualizing the MACD EMAs on Bitcoin for tradesThe MACD is one of the most robust indicators that you can use due to the variety of signals you can use with hidden and traditional divergence on both the MACD itseft, as well as the histogram. Many people may tinker with the settings of the fast and slow EMA and they may look for crosses of the MACD and its own moving average, the signal line. Lots of attention is taken with looking at the MACD crossing the signal line for a change of trend but it seems fewer than would make sense look at the EMAs themselves, no matter which settings you use.
And even when people see the MACD cross the signal they don't pay it enough attention. We had a massive uptrend in 2017 and again this year and it ends with a MACD-Signal Cross. I posted on the MACD-Signal signal cross and lots of people pushed back. Lots of people doing TA on Trading View or YouTube commented on it, but still thought we would continue upward at $60K and did not have a proper appreciation for the cross given bitcoins history.
People saw a massive descending triangle in 2018 underneath a MACD-Signal cross and refused to accept it. The 12 and 26 EMAs crossed bearish, so the MACD and Signal line both went below zero, and people were still bullish. And really the charting come first. We get a chart pattern and then we should look to volume to confirm, and then we look for indicators to confirm.
Lets do a rundown on our current situation:
MACD-Signal Cross
Development of a bearish head and shoulders
The MACD EMAs, the 12 and the 26, are crossed bearish
What is missing is the Signal line crossing the zero along with the MACD, and I see that happening soon, very high probability, like over 90%.
Just take a look at this chart below. The 12-26 cross bearishly at the peak in 2011, 2014, and again in 2018. There was no bearish 12-26 EMA cross in 2013. Very simple TA has taken that off the table. But many people are still on that hopium. The 12-26 crossed in 2014 and there was some chop and a bear market. In 2017 it chopped to form a W pattern with the C19 dump but when we BTC cleared the bridge of the W we ran.
What do we do? We see a bearish structure and the easiest thing to do is look for historic support, be it chart structure or moving averages or do targeting based on the chart structure (fibs). Here is a quick look at targeting. Most likely the 200 will be support. If we have a NASDAQ dotcom bubble pop or a 2008 type recession we could go lower. The linked ideas have a variety of long term (years) and intermediate (months) for if we go into a bear market or the dotcom type bust.
Once again the charting isn't hard. It isn't hard to see the MACD-Signal cross and it isn't hard to see the 12-26 EMA cross bearish. It isn't hard to see the descending triangle and head and shoulders in 2017 and right now. But what is hard is accepting the facts in the charts against your hopes and bias.
The chances that this resolves to the downside are extraordinarily high. The chances that this formation breaks to the upside is very low. We could have a conversation on if this will lead to a V-shaped recovery or a prolonged downtrend. Will we get over-performance or under-performance to the downside? All these conversations will very likely end up happing more in the future than conversations trying to target $100k or $300k or any other upside target before we talk to the downside.
Thoughts?
NOTES: MACD- MOMENTUM INDICATORMoving Average Convergence Divergence
Type of Indicator: Lagging Indicator
-Data used in MACD is based on the historical price action of the stock. Since it is based on historical data, it must necessarily “lag” the price.
Consist of 3 components
1) MACD Line FORMULA: EMA 12-EMA 26
2) Signal Line FORMULA: 9-day EMA of MACD Line
3) MACD Histogram: FORMULA: MACD LINE - SIGNAL LINE
Functions
1) Momentum indicator for Bullish or Bearish
2) Helps in determining long or short position
3) Entry ideas
TIPS (Must not be used as stand-alone Indicator)
-BUY: When MACD Line Cross over the Signal Line + Reversal Candle/ Pattern
-SELL: When Signal Line Cross over MACD Line + Reversal Candle/ Pattern
-READY: When the MACD Histogram does not show big changes, ready for incoming big momentum either bullish or bearish
Idea sourced from:
-Investopedia
-YouTube Rayner Teo: MACD Indicator Secrets: 3 Powerful Strategies to Profit in Bull & Bear Markets

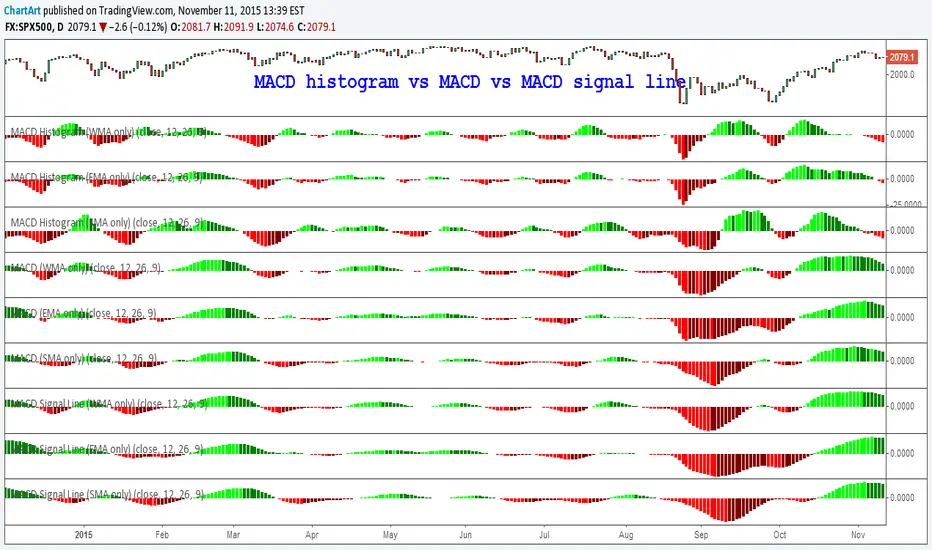
[STUDY] MACD Dashboard: Comparison of all three MACD time seriesThis is the final overview of my research into the MACD (Moving Average Convergence/Divergence) indicator, which is showing part 1, part 2 to part 3 all together in just one chart.
Overall there are nine MACD indicator variations on this chart, because each of the three parts is a comparisons of three different calculation methods (simple moving average vs exponential moving average vs weighted moving average) of each the three different MACD time series components:
Part 1: MACD histogram (difference between MACD and signal line)
Part 2: MACD (difference between fast and slow moving average)
Part 3: MACD signal line (moving average of the difference between the fast and slow moving averages)
P.S. Here is the mathematical interpretation of the MACD indicator:
First derivative: fast moving average (12) and slow moving average (26)
Second derivative: MACD (fast moving average (12) less the slow moving average (26))
Third derivative: MACD signal line (moving average (9) of MACD)
Fourth derivative: MACD-Histogram (MACD less MACD signal line)
Source: stockcharts.com
According to Wikipedia "for the standard MACD filter time constants of 12 and 26 periods, the MACD derivative estimate is filtered approximately by the equivalent of a low-pass moving average filter of 38 data periods. The time derivative estimate (per period) is the MACD value divided by 14."
Source: en.wikipedia.org
Optimized MACD Study with AlertsThis Pine Script study enhances the classic MACD indicator with additional functionality, making it a powerful tool for traders who want actionable and visually intuitive signals on their charts. It is designed to help traders identify BUY and SELL opportunities with customizable alerts, along with visual labels for better chart interpretation.
Key Features:
Customizable MACD Settings:
Users can adjust the Fast EMA, Slow EMA, and Signal Smoothing parameters to fit their specific trading strategies and preferences.
Take Profit Logic:
The script includes a take profit mechanism that tracks price movement after a BUY signal and highlights when the target is achieved.
Visual labels ("Take Profit Hit") make it easier to track price performance directly on the chart.
Visual Signals:
BUY signals are labeled clearly on the chart when the MACD line crosses above the Signal line.
SELL signals appear either when the take profit is hit or when the MACD line crosses below the Signal line, making it easy to interpret market conditions at a glance.
Dynamic Alerts:
Selectable alerts are included for both BUY and SELL signals, allowing traders to stay informed in real-time without constant monitoring.
Alerts dynamically display the symbol, time, price, and reason for the alert (e.g., BUY Signal or SELL Signal due to Take Profit or MACD Exit).
User-Friendly and Flexible:
This study is versatile and suitable for different asset classes and timeframes, from cryptocurrencies to stocks or forex.
Clear visual annotations and dynamic alert messages make it beginner-friendly yet powerful enough for experienced traders.
How to Use:
Attach the script to your preferred chart and timeframe, adjust the MACD settings as needed, and set up alerts using the "BUY Alert" and "SELL Alert" conditions in the TradingView alert system. The custom alert messages provide key details, such as the symbol, time, and current price, helping traders respond quickly to opportunities.
This script is ideal for those looking to enhance their trading strategy with actionable insights and automated notifications. Whether you're day trading or swing trading, the Optimized MACD Study provides a robust framework for informed decision-making.

History Repeating on MACDIt seems history is repeating.
Weekly MACD histogram and daily MACD and histogram crossing negative preceded the crash in May. Daily MACD finding support, followed by the histogram crossing positive marked the start of the rally in August.
The same sequence of events has just completed in the last few days. Time for a bull run?

Defined Entry & Exit Points Using MACD, W%R and 3EMA's
Easily define entry and exit points by using a simple crossover strategy using the indicators above. This
strategy is based on trend and momentum price movements. This strategy is described below.
Strategy: Defining Entry Points
Timeframe: 5 / 15 / 30 minutes
MACD - When the MACD line crosses above the Signal line, a upward trend may be occurring.
W%R - When the W%R line moves upward toward 0 and crosses the -50 line, an upward trend may be occurring.
3EMA - When the 20 MA cross above the 60 MA line, and both are above the 100 MA, an upward trend may be occurring.
When all three of these happen simultaneously, there is a 99% change that an upward trend is occurring. Your entry point should
be at a price point three to six cents ABOVE the 3EMA, MACD & W$R cross over line. Entering your position a few cents above the crossover line
reinforces that your entry is being done in an upward price movement instead of getting stuck in a sideways or downward price movement.
To Exit, simply use the reverse strategy of the Entry.
MACD - When the MACD line crosses below the Signal line, a downward trend may be occurring
W%R - When the W%R line moves downward toward - 100 and cross the -50 line, a downward trend may be occurring
3EMA - When the 20 MA crosses below the 60 MA line, and both are below the 100 MA line, a downward trend may be occurring.

Potential snipe on 4hr MACDLooking for MACD and signal to cross on 4 hr chart as it is resting in a nice oversold zone before entering buy. MACD and signals have crossed on 1 and 2 hr heading up towards MACD signal line.

MACD and SMA strategy has confirmed MACD and SMA strategy (Source is Close, MACD Fast Moving Average 20, MACD Slow Moving Average 16, MACD Signal Line Moving Average 31 and a Very Slow Moving Average. This strategy goes long if the MACD histogram and the MACD momentum are both above zero and the fast MACD moving average Is above the slow MACD moving average . Optional as additional long filter the recent price has to be above the SMA 35. If the inverse logic is true, the strategy goes short.

Need Help Eliminating MACD False SignalsHey guys, curious if there are ways to adjust the MACD indicator inputs to avoid some false signals. This mainly is happening during MACD line and MACD signal line crossovers, which I circled in yellow.
If these are unavoidable, what other indicators are you using in tandem with MACD to avoid these loss situations?

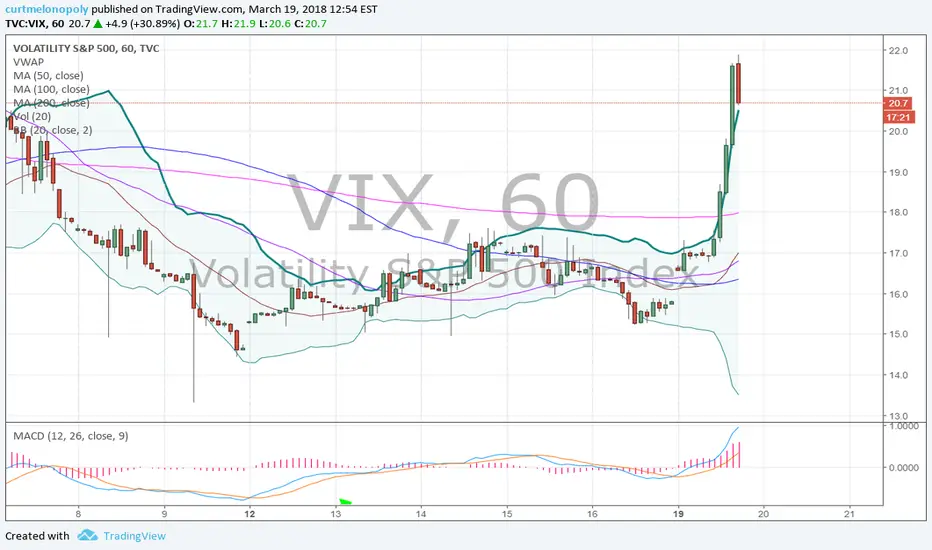
$VIX MACD 60 min & Bollinger Daily Short Set-Up. See chart notes$VIX When MACD turns down on 60 min & price outside upper Bollinger Band on Daily is short side signal. $TVIX $UVXY
The ideal scenario is to get both signals in play at the same time. Having the price upside of the upper Bollinger Band on the Daily Chart and the MACD to turn down on the 60 min chart presents a significantly high risk reward scenario.
However, simply either is also a high probability short side trade. $VIX above upper Bollinger on daily is always a good short - however, there is no telling how much pain for how long the short side has to endure, this is why having also the MACD on the 60 minute turn down provides a more predictable scenario short term (avoiding unnecessary pain / probability).
Register to free email list for trade set-ups, webinars, special events: compoundtrading.com
Website: compoundtrading.com
Free chat room: discord.gg
Subscribe: compoundtrading.com
Twitter: twitter.com
Lead Trader: twitter.com
Tradingview: www.tradingview.com
Facebook: www.facebook.com
StockTwits: stocktwits.com
Email: info@compoundtrading.com
Our services include: Algorithm model charting for $SPY, $VIX, #OIL, #GOLD, #SILVER, Crypto $BTC Bitcoin 1.12% 4.04% 3.93% $ETH $LTC $XRP etc, $DXY -0.38% -0.29% -0.22% US Dollar -0.38% -0.29% -0.22% and Swing Trading Newsletter Service. Live trading rooms for daytrading and oil -0.39% -0.27% -1.09% traders. Private coaching and live alerts.
$SPY MACD pinch - on watch here as MACD daily predictable direct$SPY MACD pinch - on watch here as MACD daily predictable directional swing trade indicator.. Mar 4 1046 PM $SPXL $SPXS

Gold MACD remains good buy sell trigger. MACD up. $GLD #XAUUSDGold MACD remains good buy sell trigger. MACD up. $XAUUSD $GLD $GC_F #GOLD

20 MA did not hold, MACD on sell. Wait for MACD to signal buy.20 MA did not hold and MACD on a sell. Wait for MACD to signal buy and review then.
