Global Commodity Price Index versus SPXCommodities are basic good used in commerce of primary origin, produced on a large scale and used as raw materials by various economic agents.
Examples are soy, corn, cotton, meat, oil, natural gas, wood and water.
They are classified, according to their origin, into agricultural, livestock, mineral and environmental.
Its main function is the supply of raw materials for the production of industrialized goods.
Its commercialization works, according to the international market, through negotiations carried out on stock exchanges.
They are of paramount importance for the supply of primary goods for the functioning of society.
(Mundo Educação - UOL)
This index represents the benchmark prices which are representative of the global market.
They are determined by the largest exporter of a given commodity.
Prices are period averages in nominal U.S. dollars.
(fred.stlouisfed.org)
This index is at an all-time high, due to the high cost of energy and the world apocalyptic scenario.
The Stochastic RSI on the monthly chart is about to cross downwards.
Allied to this, the correlation with SPX is decreasing, which could indicate an important moment.
Historically, when these two technical events happened (stochastic crossing down and correlation falling), there was a sharp drop in SPX.
This can be seen in the red circles.
Search in ideas for "stochastic"

Dow Jones: either up or downThe index is at the 21.4% Fibo retracement (March 23, 2020 retracement to the last top).
In the inverse retracement from January 3, 2022 to June 13, 2022, the price seems to have corrected in the region of 38.2%.
And it is in a bullish channel which in this context can be called a bearish flag.
The Stochastic RSI is retesting a resistance for the third time.
What to expect
In a bullish scenario, it is necessary for the price to fall at most to halfway through the channel, and remain above the 21.4% major retracement.
If it breaks the 38.2% inverse retracement, it will at least test the next 50% retracement.
Now, if it stays in the lower half of the channel, there is a higher probability of going all the way to the 38.2% retracement.

Bitcoin macro analysis (BTC/USD Index)Hello how are you?
On the long-term chart BTC follows a bullish channel.
It looks like he is testing the 38% Fibonacci retracement.
I placed the retracement considering the bottom of March 9, 2020 and the top of March 08, 2021.
Why did I consider these dates?
Explanation below.
BTC/USD indexed on Nasdaq
As Nasdaq is strongly correlated with BTC lately,
I analyzed in a separate chart the price of BTC indexed on the NDX.
Also on the same bull channel:
As we can see, we have the last bottom on March 9, 2020 and the last top on March 08, 2021.
Then, tracing the Fibonacci retracement by joining these dates, we saw that the price corrected until the 50% correction
Maybe test again? I don't know.
Fibonacci Channel
Reached -50% retraction.
Stochastic RSI, RSI and 100-month smoothed exponential moving average
On the monthly chart the price is in a theoretically cheap region, rarely seen.
On the RSI, the indicator broke the historic low.
And the stochastic RSI is still pointing down. When it starts to turn upwards it will be a good sign.
Another interesting sign is the 100-month regularized exponential moving average, as circled.
On-chain data
The volume of BTC on the network indicates important points.
In the yellow circles, where we had high volume on the Bitcoin network, this foreshadowed a strong swing in price, both up and down.
The percent of circulating supply that has not moved in at least 1 year
This indicator appears to be reversing downwards, which indicates that the circulating supply that has been idle for at least 1 year is starting to move.
We can see an inverse relationship as shown by the arrows.
Drawdown
In the past there was a drop of 87%, 80% and 82% approximately.
Now we're down 70%.
Have already fixed everything, or will you test that red diagonal channel, correcting 74% or more?
Stable coins dominance (dollar strength in the crypto market)
The dominance of the three main stable coins (USDT, USDC and DAI) has an inverse correlation to BTC.
When it goes up, the price of BTC goes down, and vice versa.
We have a bullish channel on the stable coin dominance chart, and when dominance reaches the top channel, it is usually a great buy signal, as shown in green circles.
Dollar dominance in the traditional market
Tested 50% Fibo retracement.
Hope this helps.

DAL 46.64 ShortFundamental Analysis
With Airlines getting business back up and running in a slow fashion, the Airline industry as a whole has to return back to profitability. However it looks like investor confidence is still not bullish, and DAL isn't an exception to this case. For the short-run, there is still a bearish outlook for the industry considering the consistent Covid variants causing havoc.
Technical Analysis
Price volatility since last year month-to-month.
Price is in a downtrend at resistance level of 46.64.
Widening channel with no breakout creating lower lows in the price without higher highs. This is a bearish trend in the near term.
MACD is flat near the zero line.
RSI level at 51.80. A breakout here can signal a potential upward momentum, however confirmation with a breakout at 46.46 is also needed.
Stochastics showing mixed readings so it's not valid.
Fibonacci retracements showing lows have retraced to 23.6 while resistance at 61.8 level has remained steady.
Candlesticks showing that every time there has been a push to the upside, a doji star has confirmed a reversal on several occassions.

ZILUSDT Daily S/R| Swing High| Declining Volume| Price Action Evening Traders,
Today’s analysis – ZILUSDT- trading above Daily S/R where a respect is bullish,
Points to consider,
- Price Action Descending Channel
- Daily S/R Support
(Bullish OB)
- Swing High Objective
- Declining Volume
- Stochastics Buy Cross
- RSI Dynamic S/R
ZILUSDT’s immediate Price Action is bullish, trading in a Descending Channel above daily S/R that is in confluence with the Bullish Order Block, this allows us to have a bullish bias on the market.
The Swing High is immediate objective; Price Action exceeding this level increases the probability of trend continuation.
Current volume is declining which is indicative of an expansion occurring, this is highly probable as Price Action is trading at a key trade location.
The Stochastics has a buy cross coming to fruition that will coincide with a respect of the RSI Dynamic S/R, this will increase the bullish probability.
Overall, in my opinion, ZILUSDT is a valid long with defined risk, Price Action is to be used upon discretion/ management.
Hope this analysis helps!
Thank you for following my work
And remember,
“Confidence is not "I will profit on this trade." Confidence is "I will be fine if I don't profit from this trade.” ― Yvan Byeajee,

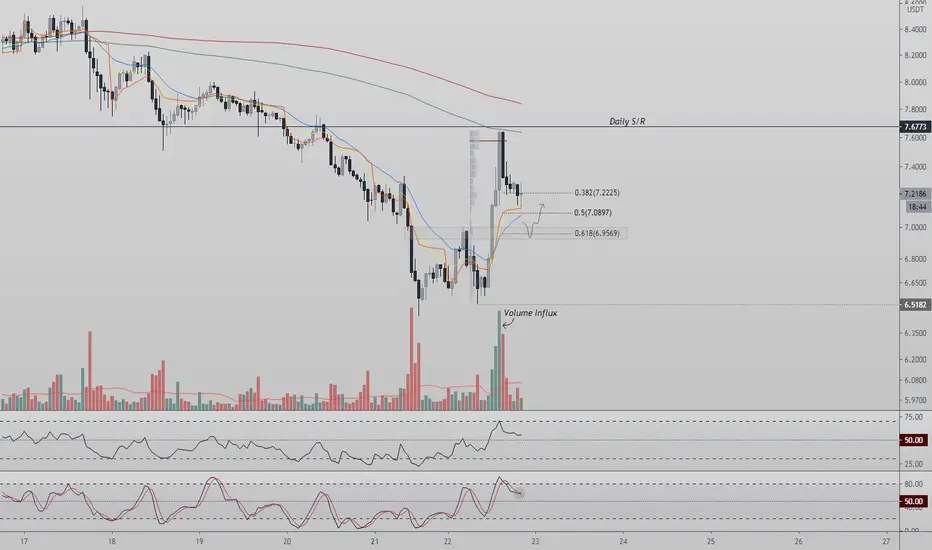
WAVESUSDT Volume Influx| Daily S/R| .618 Fibonacci| Price ActionEvening Traders,
Today’s analysis – WAVESUSDT- strong influx of volume with further upside probable,
Points to consider,
- Price Action Impulsive
- .618 Fibonacci S/R
- Daily S/R Resistance
- RSI Bullish Control Zone
- Stochastics Buy Cross
- Volume Influx
WAVESUSDT’s immediate price action is impulsive with a strong volume influx; a trend trade is probable if the Daily S/R is breached.
The .618 Fibonacci Zone is of demand, price has a probability of wicking here before a trend continuation.
The Current RSI and Stochastics are both trading in their bullish control zones, remaining in these regions is indicative of strength in the market.
Overall, in my opinion, WAVESUSDT is a valid long with defined risk; price action is to be used upon discretion/ management.
Hope this analysis helps!
Thank you for following my work
And remember,
“The obvious rarely happens, the unexpected constantly occurs.” – Jesse Livermore
DOTBTC Local S/R| Declining Volume| Swing High| Price ActionEvening Traders,
Today’s analysis – DOTBTC – trading above Local S/R forming a potential higher low,
Points to consider,
- Price Action Impulsive
- Local S/R Support
- POC Resistance
- Declining Volume
- Double Bullish Divergence (RSI & Stochastics)
- Swing High Objective
DOTBTC’s immediate price action is showing strength at Local S/R, respecting this level allows us to have a bullish bias.
The current resistance is the local POC, breaking this level with conviction will increase the probability of a structural higher low.
Volume is on a decline which is indicative of an influx at a key trade location, currently being at one.
There is a valid double bullish divergence, the RSI and Stochastics are showing a higher low in respect to price action making a lower low, again signalling strength.
Overall, in my opinion, DOTBTC is a valid long with swing higher being the objective. Price Action is to be used upon discretion/ management.
Hope this analysis helps!
Thank you for following my work
And remember,
Trading is mostly a waiting game. if you want action that happens on your own terms, you’re in the wrong field.

NZDUSD Daily S/R| .618 Fib| Swing Low| 200 MA| Price ActionEvening Traders,
Today’s Second analysis – NZDUSD – breaking above Local S/R, an S/R Flip Retest will solidify an impulse into Daily S/R.
Points to consider,
- Price Action Impulse
- Local S/R Support (200 MA Confluence)
- Daily S/R Resistance (.618 Fib Confluence)
- RSI above 50
- Stochastics Sell Cross
NZDUSD’s immediate price action is has been impulsive from swing low, confirming local S/R with a close above the 200 MA will signify strength.
The Daily S/R in confluence with the .618 Fibonacci is immediate resistance. A respect of this level is likely upon first test as price is getting over extended.
RSI is at resistance whilst the stochastics has a valid sell cross coming to fruition. This is indicative of momentum shifting in the immediate short term.
Overall, in my opinion, NZDUSD is a valid short at Daily S/R; price action is to be used upon discretion/ management of trade.
Hope this analysis helps!
Thank you for following my work
And remember!
“When you learn to let go of the need to be right, being wrong gradually lose its power to disturb you.”
― Yvan Byeajee

ADABTC Daily S/R| Bull Flag| Stoch Equilibrium| 200 EMA Evening Traders,
Second analysis – ADABTC –breaking above Structural S/R, price acceptance at this level will be bullish.
Points to consider,
- Bullish Price Action
- Daily S/R Support
- 200 EMA Resistance
- Stochastics Equilibrium
- Declining Volume
ADABTC’s current price action is bullish, trading in a probable bull flag, This allows us to have a bullish bias on the market.
The Daily S/R is immediate support that is in confluence with the .618 Fibonacci. Price holding and respecting this level is a bullish bias.
Resistance is poised by the 200 EMA, breaking this will coincide with price hitting technical and validating the bull flag.
The stochastics is in a valid equilibrium, a break in either direction will coincide with price movement.
The volume profile is declining, this is indicative of an influx when testing key levels such as the Flag and Daily S/R resistance.
Overall, in my opinion, ADABTC is a valid long with defined risk, price action is to be used upon discretion/ management of trade
Hope this analysis helps
Thank you for following my work!
And r Timing, perseverance, and ten years of trying will eventually make you look like an overnight success. – Biz Stone
emember,

USDJPY Dynamic Resistance|Structural S/R|200 DMA|Bullish Div| PAEvening Traders,
Today’s second analysis – USDJPY- trading at a key Dynamic Resistance where a confirmed break will make the immediate target, Structural S/R.
Points to consider,
- Price Action Lower Highs
- Local S/R Support
- Structural S/R Resistance (200 DMA Confluence)
- RSI divergence
- Stochastics Extended
USDJPY’s immediate price action is projecting lower highs; our bias will change once the Dynamic Resistance is breached with confirmed Higher Highs.
The Local S/R is immediate support that is likely to hold on first attempt that is if Price Action retraces here. There is a current Bullish Divergence at play showing immediate strength in USDJPY.
Current resistance is Structural S/R which is in confluence with the 200 DMA, Price Action is likely to respect this region upon first attempt, and a rejection will confirm a bearish retest.
The stochastics is currently over extended, a reversion to its mean in probable if price starts to correct here.
Overall in my opinion, USDJPY is a valid long with defined risk; price action is to be used upon discretion/ management of trade.
Hope this analysis helps
Thank you for following my work!
And remember,
“If you can learn to create a state of mind that is not affected by the market’s behaviour, the struggle will cease to exist.” – Mark Douglas

XTZUSDT Rising Wedge|Daily S/R|.618 Fib|200MA|Stoch Bearish DivEvening Traders,
Today’s Analysis – XTZUSDT- trading in a valid rising wedge, approaching key resistance where a rejection will be plausible,
Points to consider,
- Rising wedge pattern (Bearish)
- 21 MA immediate support
- Daily S/R Resistance (.618 Fibonacci Confluence)
- RSI Respecting Trend
- Stochastics Bearish Divergence
- Volume Below Average
XTZUSDT’s immediate Price Action is trading in a bearish Rising Wedge pattern. This allows us to have a bearish bias on the market.
The 21 MA is acting as dynamic support, as long as price respects this average, XTZUSDT will continue grinding up.
Daily S/R is strong resistance as it is in technical confluence with the .618 Fibonacci. The 200 MA is also lurking from above, an initial rejection here is expected; this may lead to a break of the Rising Wedge.
The RSI is currently testing its trend line; a break will coincide with Price Action rejecting. The Stochastics has a valid bearish divergence and a sell cross, this is indicative of further downside.
Furthermore the current volume is below average, an influx is highly probable when a break up or break down comes to fruition.
Overall, in my opinion, XTZUSDT is a valid short with defined risk; Price Action is to be used upon discretion/ management of trade.
Hope this analysis helps
Thank you for following my work!
And remember,
“The market can stay irrational longer than you can stay solvent.” – John Maynard Keynes

GBPUSD Weekly S/R| 200DMA| .50 Fibonacci| Local S/R Evening Traders,
Second Analysis – GBPUSD- testing Weekly S/R that has technical confluence, a bounce here is probable.
Points to consider,
- Impulsive Price Action
- Weekly S/R (Support)
- .50 Fibonacci (Resistance)
- Stochastics Buy Cross
- Evident volume Climax
GBPUSD’s immediate Price Action has been impulsive to the downside, currently testing a key Weekly S/R, a strong support that has confluence with the 200 DMA and the .618 Fibonacci. This added confluence increases the probability of a bounce.
The .50 Fibonacci is immediate resistance; price is likely to test this level with a reaction.
The Stochastics has a valid buy cross in over-extended conditions along with the RSI. A reversion to their mean is probable; this will coincide with a bounce in Price.
A volume climax node is evident; this usually indicates a temporary bottom as price finds its equilibrium.
Overall, in my opinion, GBPUSD is a valid long with defined risk; price action is to be used upon discretion/ management of trade.
Hope this analysis helps
Thank you for following my work!
And remember,
“Trade What’s Happening…Not What You Think Is Gonna Happen.” – Doug Gregory

TSLA Swing High| Range Low| .618 Fibonacci| Bearish RetestEvening Traders,
Today’s analysis – TSLA- swing high back into range, price action is currently bearish under range high.
Points to consider
- Bearish impulse break
- Range low support
- Range high resistance (bearish retest)
- Stochastics sell cross
- .618 Fibonacci
TSLA’s bearish impulse back into range allows us to have a bearish bias on the market.
The Range low support has been respected, leading into a sizeable bounce. Price action respecting range high will establish a bearish retest.
The stochastics has a valid sell cross coming to fruition, this is indicative of momentum shifting.
Immediate target is the .618 Fibonacci, holding this area will be crucial for the bulls.
Overall, in my opinion, TSLA is a valid short with defined risk; price action is to be used upon discretion/ management of trade.
Hope this analysis helps
Thank you for following my work!
And remember,
“Hope is bogus emotion that only costs you money.” – Jim Cramer

SPY Daily S/R| 21 MA| Bearish PA|Low Volume|.618 Fibonacci Evening Traders,
Today’s analysis – SPY- confirming support on Daily S/R, short term bounces are likely to respect .618 Fibonacci.
Points to consider,
- Bearish price action
- Daily S/R (Support)
- .618 Fib Resistance (21 MA Confluence)
- RSI below 50
- Stochastics buy cross
- Volume below average
SPY’s immediate price action is bearish from swing high; this allows us to have a bearish bias.
The Daily S/R has held as support, price action respected the 200 EMA in confluence.
An immediate rejection is plausible at the .618 Fibonacci in confluence with the 21 MA. Price action is likely to range between local S/R and Daily S/R.
The RSI is currently below 50, indicative of short term weakness. Current stochastics is showing a buy cross which has coincided with the immediate bounce.
Volume profile is currently below average, price action rising on low volume is typically bearish, thus an influx is probable.
Overall, in my opinion, this short term bounce is likely to respect the 21 MA on first attempt. Price is likely to range between Daily S/R and Local S/R.
Hope this analysis helps
Thank you for following my work!
And remember,
Timing, perseverance, and ten years of trying will eventually make you look like an overnight success. – Biz Stone

GBPAUD Weekly S/R| Oversold Bounce| Oscillators Extended| PARepost**
Evening Traders,
Second Analysis – GBPAUD – Strong impulse sells likely to lead to an oversold bounce play, following technical points to consider,
- Trend aggressive sells
- Weekly S/R HTF Support
- .618 Fibonacci (lower high)
- RSI oversold
- Stochastics flat
- No volume climax
GBPAUD is respecting its weekly S/R in the immediate term. This is a high time frame support that the market has respected historically, thus a bounce here is probable.
The .618 Fibonacci is a probable lower high projection as the immediate trend is bearish .
The RSI and Stochastics are both approaching oversold conditions, this is indicative of an oversold bounce coming to fruition.
On the volume profile there is however no volume climax node signalling a temporary bottom. Cautious approach is to be taken when trading the oversold bounce.
Hope this analysis helps!
Thank you for following my work!
And remember,
“Sheer will and determination is no substitute for something that actually works.” – Jason Klatt

EURJPY Structural S/R|Hidden Divergence|.50 Fibonacci|Low VolumeEvening Traders,
Today’s analysis – EURJPY- respecting structural S/R, price action is likely to retrace for a swing low failure.
Points to consider,
- Bearish Retest (Structural S/R)
- Hidden bearish divergence ( RSI)
- Stochastics valid sell cross
- Volume below average
- .50 Fibonacci target
EURJPY respecting structural S/R will validate a bearish retest allowing for a short term bearish bias.
The Structural S/R level coincides with a hidden bearish divergence; the RSI has made a local high whilst price action established a technical lower high.
The Stochastics has a valid sell cross, this is indicative of momentum shifting as buyers become exhausted.
Volume profile is currently below average, an influx is probable as price accelerates towards key levels.
Overall, in my opinion, EURJPY is likely to test the .50 Fibonacci for a swing low failure. This will allow for a short with defined risk at current level. Price action must be used upon discretion/ management of trade.
What are your thoughts?
Thank you for following my work!
And remember,
“Don't ever make the mistake of believing that market success has to come to you fast. Trade small, stay in the game, persist, and eventually, you'll reach a satisfying level of proficiency.” ― Yvan Byeajee

VET Dynamic Resistance|.618 Fib| Swing high|Structural supportEvening Traders,
Today’s analysis – VETUSDT- breaching dynamic resistance with an impulse move, swing high being the immediate target.
Points to consider,
- Local downtrend broken
- Retest confluence (.618 Fibonacci)
- Key dynamic resistance breached (swing high target)
- Stochastics flat
- Volume below average
VETUSDT’s down trend has been breached by taking out its dynamic resistance. This gives us a bullish bias on the immediate trend.
A structural support retest is probable; price is likely to respect this level due to high demand, currently holding the .618 Fibonacci.
The RSI is declining, remaining above 50 will allow for a bullish bias on the market. The stochastics is currently flat; this is an indication of momentum being stored to the upside. Price action must remain bullish for upside target (swing high).
The volume profile is currently below average, an influx will coincide with an impulsive move. Volume needs to be backed up by price action for follow through.
Overall, in my opinion, VETUSDT reaming above structural support will allow for a valid long with defined risk. Price action is to be used upon discretion / management of the trade.
What are your thoughts?
Thank you for following my work!
And remember,
“Trading effectively is about assessing probabilities, not certainties.”
― Yvan Byeajee

RLCBTC Daily S/R| .618 Fibonacci|Technical Confluence|Swing highEvening Traders,
Today’s Analysis – RLCBTC- in strong uptrend breaking daily S/R. A retest of the level will allow for a long.
Points to consider,
- Immediate trend bullish
- Daily support confluence (.618 Fibonacci & 200MA)
- Swing high (immediate target)
- RSI above 50
- Stochastics flat
- Volume declining
RLCBTC’s trend has been establishing consecutive HH’s and HL’s giving us a bullish bias on the market.
The daily support is a key trade location with multiple technical confluences. The .618 Fibonacci and the 200 MA is likely to be respected upon a back test.
RLCBTC’s swing high is the immediate target; price action breaking this level will increase the probability of trend continuation.
The RSI is currently above 50, likely to dip with the correction, maintaining above 50- midpoint will keep the bullish bias intact.
Stochastics is currently in the lower regions, there is stored momentum to the upside that will coincide with price movement.
Volume is currently declining; this is an indication of an influx being probable at daily S/R as it is the next trade location.
Overall, in my opinion, RLCBTC is a valid long at daily S/R, risk being defined below previous low. Price action is to be used upon discretion/ management of the trade.
What are your thoughts?
Thank you for following my work!
And remember,
“All statistics have outliers. Money management, therefore, is key to the process of good trading.”
― Yvan Byeajee

CADJPY S/R Flip|Oversold Bounce|.618 Fibonacci|Volume InfluxEvening Traders,
Today’s Analysis- CADJPY – price impulse through key structure, an S/R flip retest will validate it as support.
Points to consider,
- Trend oversold bounce (RSI)
- .618 Fibonacci (Resistance)
- Structural support (S/R Flip)
- Stochastics sell cross
- Volume influx
CADJPY trend impulse was due to oversold conditions indicated by the RSI. A swing lower failure will indicate continuation.
The bearish .618 Fibonacci has been respected, price is likely to retrace for an S/R Flip retest. This will solidify structural support holding true.
The stochastics has a valid sell cross which is indicative of momentum shifting in the market. A volume influx is also present, these influxes usually mark temporary tops.
Overall, in my opinion, CADJPY is likely to retrace and hold structural support. This will validate a long trade with defined risk. Discretion is to be used upon management.
What are your thoughts?
Thank you for following my work!
And remember,
“If you can’t take a small loss, sooner or later you will take the mother of all losses.” – Ed Seykota

EURAUD S/R Flip| .618 Fibonacci|Range Midpoint|Oversold BounceEvening Traders,
Today’s Analysis – EURAUD- impulse break through daily support, reclaiming the level. A retest of structure must hold for continuation.
Points to consider,
- Oversold bounce follow through
- Daily support (S/R Flip retest)
- Range Midpoint (Immediate target)
- RSI neutral
- Stochastics overextended
- Volume follow through
EURAUD’s oversold bounce had valid volume follow through; breaking back into key daily support, a retest needs to solidify the level.
The .618 Fibonacci as overthrow is in confluence with daily support, giving the level more significance upon a probable S/R Flip retest.
Immediate target for EURAUD is the range midpoint; taking out this level establishes a technical higher high.
The RSI is neutral whilst the stochastics has a valid sell cross. This signals a probable momentum shift aligning with the price action S/R Flip playing out.
In context, volume had follow through from oversold conditions, this shows immediate strength in price action, market is likely to trade higher.
Overall, in my opinion, the immediate trend is bullish as long as key levels hold. A long trade is valid upon the probable S/R Flip, risk needs to be defined. Price action must be backed with volume for continuation.
What are your thoughts?
Thank you for following my work!
And remember,
“He who knows when he can fight and when he cannot will be victorious.” – Sun Tzu

GBPJPY Short Trade|Daily Resistance| RSI Trend| Range Midpoint Evening Traders,
Today’s Analysis – GBPJPY- back tested daily resistance after impulse sell, breaking dynamic support will make the immediate target range midpoint and below.
Points to consider,
- Macro trend bearish
- Daily Resistance (back tested)
- Dynamic Support (objective)
- RSI uptrend
- Stochastics bear cross
- Volume below average
GBPJPY’s macro trend is bearish with consecutive lower highs; this projection gives us a bearish bias on the market.
Price put in a liquidity grab above daily resistance, trapping in long buyers; this is evident due to the impulse sell back into the range.
The Dynamic support is the next objective, breaking this will increase the probability of testing lower structural levels.
The RSI is in a clear uptrend, breaking its support line will coincide with a breakdown in price.
Stochastics has a valid sell cross, indicating momentum is shifting in the market.
Volume is clearly below average, an influx is highly probable as price is at a key technical trade location.
Overall, in my opinion, GBPJPY is likely to test range midpoint if this indeed is a liquidity grab. A short trade is valid with defined risk. Breaking key levels need to be backed with increasing volume to avoid false breaks.
What are your thoughts?
Thank you for following my work!
And remember,
“The expectation that you bring with you in trading is often the greatest obstacle you will encounter.”― Yvan Byeajee

BATBTC Trade Setup | Trend Reversal | Hidden Bullish Divergence Today's chart - BATBTC – Consolidating at key support; a successful re-test validates technical targets above.
Points to consider:
- Trend Reversal
- 21 EMA visual guide
- Hidden bullish divergence
- Stochastics oversold
- Low Volume
BATBTC testing trend support after a strong bull move into daily resistance, price respecting support level will form a higher low on the chart, indicating a trend reversal and will allow for trend continuation.
The 21 EMA will assist as a visual guide, price breaking and trading above the EMA is a confirmation of strong trend continuation.
Although trading below 50, the RSI confirms a hidden bullish divergence: price has made a higher low whilst the RSI has made a lower low, indicating a strong market accumulation. This also allows for ample space before the oscillator reaches overbought conditions as price breaks bullish.
Stochastics are also overextended, although they may remain there for some time, momentum has been stored to the upside.
Volume has been tapering off, indicative of an influx being imminent, likely to coincide with a break in either direction.
Overall, in my opinion, BATBTC needs to hold trend support and break above the 21 EMA to validate a conservative entry for a long trade to technical targets above.
What are your thoughts?
If you’ve read this far - thank you for following my work!
And as always,
Focus on you, and the money will too!

BTC Short Trade|Rising Wedge|Resistance Confluence|Price ActionEvening Traders,
Today’s Analysis – BTCUSD – a short trade is valid at major resistance confluence
Points to consider,
- Dynamic resistances converging
- .618 Fibonacci objective ( bearish resistance of dynamic resistance)
- Price Action in a Rising Wedge pattern
- Stochastics divergence
- Bull impulses (No follow through)
The .618 Fibonacci is the objective for this trade; price is likely to wick there for a liquidity grab as this is a clear trade location on the chart with key dynamic resistance confluence.
Price Action is currently trading in a rising wedge which has a greater probability of breaking down.
The stochastics has a valid bearish divergence, which has technically played out; this shows weakness in the market.
Furthermore all bull impulses have been sold into, another impulse above local resistance is likely to be a wick into the .618 Fibonacci area.
Overall, in my opinion, a short trade is valid at the .618 Fibonacci. The immediate trend is bearish; any rallies are to be sold into until the recent high is taken out at around $9796.5
What are your thoughts?
Thank you for following my work!
And remember,
“If you don’t respect risk, eventually they’ll carry you out.” – Larry Hite
