Arch Coal needs some mojo into next weekArch coal will need some momentum into to next week or it's more of the same old bucket of coal we've seen in the last year. MET coal has been moving up but not thermal coal for some reason. Below is an example of how an indicator showing an overbought Stochastic but not a RSI can crush price. I do feel coal although not loved its very needed. It will be many years until we see where coal is kicked to the trash pile. If you have any feedback let me know.. GL
Search in ideas for "stochastic"

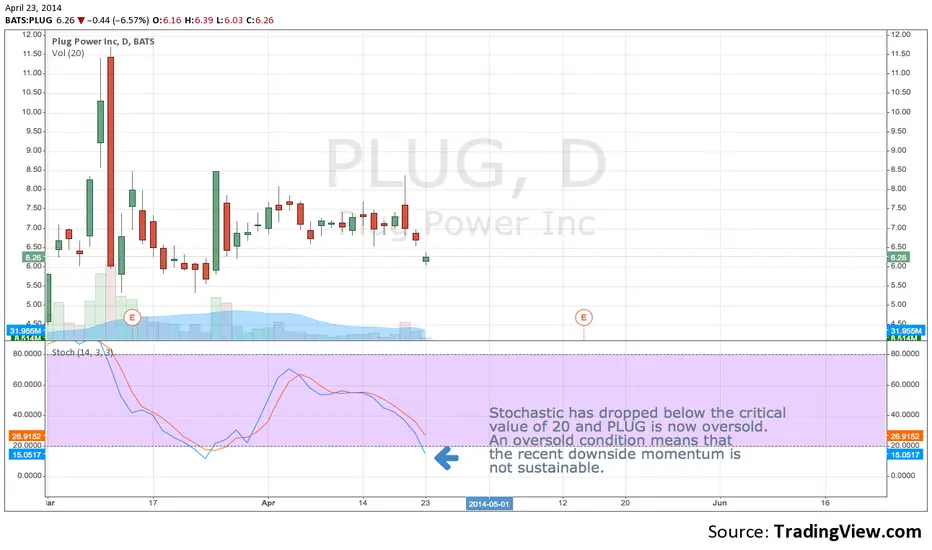
Confluence. Stochastic also confirming oversold condition.Stochastic has dropped below the critical value of 20 and PLUG is now oversold. An oversold condition means that the recent downside momentum is not sustainable.
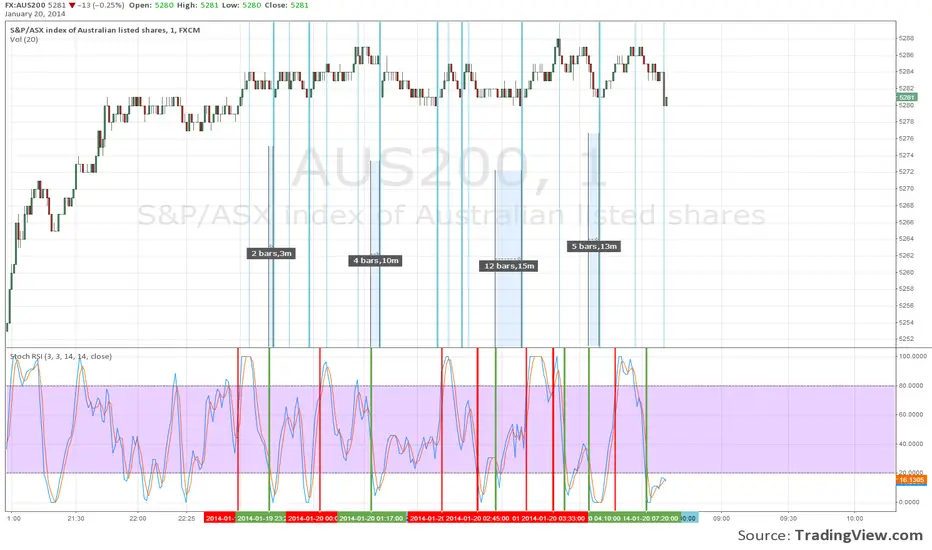
Stochastic RSI and AUS200 Index(This is my first chart and I am a novice trader - so I welcome lots of feedback.)
This is a simple line up of Stochastic RSI indicator with the recent behavior of the AUS200 index. It seems that the oversold margin is a very accurate indicator of lowest drop before a rise.
It is just striking to me, to see how well the indicator shows the trend.
This seems to suggest that when the market opens later today we will see a rise in price.
LINKUSDT Establishing a New High with Further Upside Probable Points to consider,
• Weekly Bullish Order Block holding true
• Increasing volume profile suggestive of a climatic node
• RSI and Stochastics Bullish Control Zones intact
Chainlink’s recent expansion has breached swing high posting a new all-time high as the macro bull trend continues to be intact. Consecutive higher highs and higher low are still integral thus higher prices are probable until proven otherwise.
LINK/USDT Weekly Chart
Observing the chart we can clearly see price action breaking the weekly S/R Zone with a strong impulsive break that led to an initial Bullish Volatility Expansion. This breakout established a weekly inside bar that contracted volatility for a total of three weeks. Evidently a consecutive expansion occurred where price action established a clear swing high.
The swing high led to a short term bearish volatility expansion as price action made its way down. A rounded retest was confirmed at the Bullish Order Block where price action wicked down and immediately got bought up. This is technically indicative of strength in the immediate short term which did come to fruition with an expansion.
The 21 Moving Average can be considered as a clear visual guide, price action has found clean support over the majority of the trend. As long as this holds true, higher prices are expected, breaking below will be a sign of weakness.
Now observing both oscillators, momentum is still shifted bullish with key resistance yet to be tested, especially the stochastic momentum.
LINK/USDT Weekly Stochastics:
A few conditions to be valid here for LINKUSDT as the Stochastics have a clear oscillation that marks temporary tops and bottoms. As of most recent, there has been a Bull Cross with an expansion occurring. This expansion is likely to top out at Oscillators resistance, a reversion usually occurs at these regions before a diversion back to its mean – Bullish Control Zone Median.
LINK/USDT Weekly RSI:
The RSI is also trading in the upper regions of its Bullish Conrol Zone where acceleration is likely to occur. This indicator is highly useful in measuring the speed and velocity of price action, especially on impulsive coins such as LINKUSDT. Swing high being the immediate objection suggests that further upside is probable in respect to price action. This goes well with the current volume profile as there are no immediate climatic nodes suggestive of a temporary top being set.
In conclusion, LINKUSDT remains its bullish market structure and continues to expand in a volatile manner, espically when breaking key levels. The volume profile analysis is indicative of further upside until a climatic node comes to fruition. This aligns very well with the Oscillators as they are yet to meet technical resistance, leading into a reversion.
Hope this analysis helps in making discretionary management decisions.

GBPCAD |Short D1 | Market Exec |Technical Confluences for Trade:
- Stochastics are in Overbought Conditions on D1 and H1 time-frame. H4 is also entering Overbought Conditions.
- Price action is close to last month's Resistance Trendline
- Price action is well into a Supply Zone area
- Targeting between the 50.0% - 61.8% Fibo retracement
Suggested Trade:
Entry @ Area of Interest 1.7180 - 1.7270
SL @ 0.1.7348
TP 1 @ 1.7002 (Close Half-Position & move SL to Entry level once TP1 is achieved)
TP 2 @ 1.6811
Risk-to-Reward @ Approx. 2.93 (Depending on Entry Level)
________________________________
Boosts 🚀, Follows ✌️, Shares 🙌 & Comments ✍️ are much appreciated!
If you have any ideas or charts, do share them in the 'Comments' section below and we can discuss our perspectives to improve or strengthen our strategies.
If you want something analyzed, do drop me a DM. :D
________________________________
Disclaimer: The above suggestion is an personal opinion in general and does not constitute as investment advice. Any decisions taken based on the above suggestion is purely your own risks.
Any websites / brokers / applications suggested here are also provided as informational purpose only.
________________________________

SOLUSDT | Long H4 | Buy Limit | Technical Confluences for Trade:
- Stochastics are in Overbought Conditions on D1, H4 & H1 time-frame to activate our trade idea
- Entry level will be a Demand Zone for Solana
- Price action is in a consolidation zone
- Targeting the 61.8% Fibo retracement after trade is activated
Suggested Trade:
Buy Limit @ 123.15
SL @ 110.24
TP 1 @ 143.74 (Close Half-Position & move SL to Entry level once TP1 is achieved)
TP 2 @ 169.42
Risk-to-Reward @ Approx. 3.26 (Depending on Entry Level)
________________________________
Boosts 🚀, Follows ✌️, Shares 🙌 & Comments ✍️ are much appreciated!
If you have any ideas or charts, do share them in the 'Comments' section below and we can discuss our perspectives to improve or strengthen our strategies.
If you want something analyzed, do drop me a DM. :D
________________________________
Disclaimer: The above suggestion is an personal opinion in general and does not constitute as investment advice. Any decisions taken based on the above suggestion is purely your own risks.
Any websites / brokers / applications suggested here are also provided as informational purpose only.
________________________________

NZDCAD | Short H4 | Market Exec | Pure Retracement PlayTechnical Confluences for Trade:
- Stochastics are in Overbought Conditions on H4 and H1 time-frame. D1 is also entering Overbought Conditions.
- Price action is close to last month's Resistance Trendline
- Price action is in a consolidation zone
- Targeting the 61.8% Fibo retracement
Suggested Trade:
Entry @ Area of Interest 0.8210 - 0.8230
SL @ 0.8244
TP 1 @ 0.8184 (Close Half-Position & move SL to Entry level once TP1 is achieved)
TP 2 @ 0.8151
Risk-to-Reward @ Approx. 2.04 (Depending on Entry Level)
________________________________
Boosts 🚀, Follows ✌️, Shares 🙌 & Comments ✍️ are much appreciated!
If you have any ideas or charts, do share them in the 'Comments' section below and we can discuss our perspectives to improve or strengthen our strategies.
If you want something analyzed, do drop me a DM. :D
________________________________
Disclaimer: The above suggestion is an personal opinion in general and does not constitute as investment advice. Any decisions taken based on the above suggestion is purely your own risks.
Any websites / brokers / applications suggested here are also provided as informational purpose only.
________________________________

Ground Control to moon mission: the Stochastic Eagle has landedLast week I painted two bearish forecasts and we're now sitting in the middle of both but I think the pink one won't be fulfilled. Here's why:
-Stochastic Indicator plummeted to the absolutely oversold zone, this has stirred the market and as of now it looks like we are "bullish" after the drop, but the Stochastic RSI paints bearish divergence with prices over 7250€: that's hinting another dive soon.
-MACD did a bearish crossover (although for no reason apparently), that's looking bearish as of now. One could argue it's also bearish divergent if you draw the line from the first week of march highs (lower highs on MACD), although I wouldn't consider this a divergence. I have the regular 26vs12 day EMA MACD, so it doesn't accumulate signals in a period this long (over a month and a half).
-Although regular RSI, Stochastic, and the mixed Stochastich RSI are all hinting hidden bullish divergence, there's no clear signal of buying with this prices. As I said before, dailyStoch RSI will paint bearish divergence with prices over 7250€
So with this confluence in mixed bearish/bullish signals, and the fact that the 200-day EMA and 50-day EMA were really close to crossover, I'd say in the bigger scheme this could be considered an accumulation phase. Take a look at what happened in the first days of April: MACD was hinting a bullish crossover right before 50EMA plummeted below 200EMA, which coincidentally triggered a "final accumulation phase" in a triangular shape which then slingshoted up to f* up bear stop-losses.
What's going on now? MACD went bearish just before 50EMA met the 200EMA. This means we (The Market) all agree we can use prices a lil bit lower until all regular people go "YOLO MOON MISSION FINALLY! PUT MI MORTGAGE IN CRYPTO ASAP!". This being said, the daily Stochastic depleted way too fast into the oversold zone with "only" a 15% price drop, so I don't expect prices to plummet beyond the 50% Fib, and thus why I copypasted the "orange accumulation triangle": it looks exactly the same psychological pattern. We're shaking weak-handed buyers stop-losses right before slingshoting up again. We'll bounce up and down in a triangular shape until we go below yesterday's low and paint bullish divergence in all RSI, Stochastic and Stoch RSI. I think that will inevitably happen because we almost did a technical Touchdown in Stoch RSI (~1), Stoch went to record lows (~3) beyond the oversold levels in Apri's first week and regular RSI is in the fourties.
All in all, it looks like a clear picture to me. This week will plot something like an ABC or ABCDE triangular shape similar to what I depicted, so I'll try to accumulate BTC within the 50%-61.80% percentiles to sell it when any bearish momentum shows up in the hourly charts or near the 78.60% percentile. It will be a great week for daytraders if you catch the right swing. Accumulate at 7000€ and sell around 7300€.
I think buying is safe at this levels because it's also aligned with the 38.20% white Fib in the left, which we retraced over 61.80%. With Stochastics in the absolute oversold, I wouldn't expect another 15% price drop although be cautious and safe with your own money. I'm expecting a final breakup of the triangle and a bullish outcome because there's an underlying side-effect of the rest of Cryptos lifting BTC: the most important ones finished their "bubble crash" patterns and are now heading to previous support levels.
Good luck and have a nice week ahead everyone!

QTUMUSDT Dynamic Resistance| Daily S/R| .618 Fibonacci| 200MAEvening Traders,
Second Analysis – QTUMUSDT- bearish Price Action with consecutive lower highs, a back test of Daily S/R is probable.
Points to consider,
- Bearish Price Action
- Key Dynamic Resistance (200 MA & .618 Confluence)
- Swing Low (Temporary Bottom)
- RSI Respecting Trend
- Stochastics Bearish
- Low Volume
QTUMUSDT is trading with bearish Price Action under key dynamic resistance; this allows us to have a bearish bias on the market. This area is in confluence with the .618 Fibonacci and 200 MA, adding to the probability of a resistance respect.
The swing low is a temporary bottom; price taking it out will make the Daily S/R an immediate target.
The RSI is respecting its trend line, a break will coincide with further downside on the stochastics. The stochastics are currently holding the 50 mid-point with a valid sell cross at current given time.
Volume is currently very low; an influx is probable when testing ley trade locations such as the Daily S/R.
Overall, in my opinion, QTUMUSDT is a valid short with defined risk; Price Action is to be used upon discretion/ management of trade.
Hope this analysis helps
Thank you for following my work!
And remember,
“It’s OK to be wrong; it’s unforgivable to stay wrong.” -Martin Zweig

UBER Oversold Bounce| Structural Resistance| .50 Fibonacci Evening Traders,
Today’s Technical Analysis will focus on UBER, with an insane oversold bounce, over 100% gain, currently testing a key resistance that will dictate the overall macro trend.
Points to consider,
- Oversold bounce still in fruition
- Structural resistance in confluence
- Stochastics projected up
- RSI hitting resistance
- Noticeable bull volume nodes
- Daily lower high likely
UBER is currently in an oversold bounce, testing a key structural resistance that is in confluence with the .50 Fibonacci level.
The stochastics is projected up, still has more stored momentum to the upside whilst the RSI is testing its resistance. It is likely to break in conjunction with the upside momentum of the stochastics.
There are noticeable bull volume nodes, driving the oversold bounce, this must sustain if structural resistance is to be broken.
Overall, in my opinion, UBER is testing a critical level on the macro timeframe. A rejection will be in favour of the bears, putting in lower high. A break and consolidation however, will increase the likelihood of testing upper level, thus changing the macro structure.
What are your thoughts?
Please leave a like and comment,
And remember,
“In order to succeed, you first have to be willing to experience failure.”
― Yvan Byeajee

Why I am getting very Cautious trading Long - Gold / Precious M
USDX has really fallen off a cliff this week & this lowering of the USD has been supportive of Gold & all at a time when Gold has been bided up a bit too much & making the Gold price overbought on the Stochastic's higher-time-frames.
With USDX and the Gold-price having an inverse relationship, my chart shows just how much the USD has been oversold this week on the important 4HR, Daily & Weekly Stochastics.
A strong cross-up on the 20 level could signal a rally in USDX soon, I tip it will rally next week if not before finding strength during late Thursday and Friday trading.
There is a tonne of economic news coming out today Thursday morning, will it be a mixed bag and what impact will have on the Gold price and USDX... We will know later.

Home Depot at flaglike decission point - Will we tumble or jump?Home Depot has declined slightly in the bullish trend. It is sitting in a flaglike pattern while Stochastics is coiled as well. Volumes are sinking and thus not giving much info. We have a candlestick reversal-pattern, signaling 116$+ level is potential first target if we break through channel possibly on the coiled Stochastics breaking up.
If we start to tumble however, levels we could see would be 101$ ish, 95$ or even 90$. For this to happen we would first need to take out the candlestick-signal low that we just put in. If this happens, the levels close to the gaps in the chart provides us with very strong supportlevel that could hold the price down in a strangle hold for some time.
I am not taking a position in this one. I just want to see how it all plays out. =)
Any ideas and feedback are much appreciated!

JPFA : Possible upside1 hour chart shows a possible buy setup.
Based on elliott wave principle.
Wave 2 is ended with W-X-Y structure and nicely touch the 0.786 fibonacci retracement level. The price need to break peak of X wave to validate the counting.
Plan
Buy if break 1050
stop loss at 760.
This idea is also supported with bullish divergence on RSI and stochastic.
Cheers & god bless.
Bahasa Indonesia
Chart 1 jam memberikan kesempatan untuk buy dengan alasan perhitungan wave elliott untuk wave (2) bisa jadi sudah selesai dan lanjut naik ke atas (lanjut wave (3))apabila harga tembus puncak X dan keluar dr channel sideway. Pertimbangan wave (2) mungkin sudah selesai adalah dari angka fibo 0.768 yg disentuh ujung Y lalu terpantul ke atas. Plan nya adalah buy saat break 1050 dan stop loss di 760.
Analysis diperkuat juga oleh indikator RSI dan stochastic yang menunjukkan bullish divergence. Semoga analysis ini bermanfaat, god bless.

EURCHF | Short D1 | Market Exec | Building Momentum for Risk OffTechnical Confluences for Trade:
- Stochastics are in Overbought Conditions on D1, H4 and H1 time-frames
- Stochastics are also Overbought in multiple Cross-CHF pairs and even on USDCHF pair.
- Price action is close to multiple Supply zones
- Price action is close to multiple Resistance Trendlines as well
- Targeting the 50% Fibo retracement for this trade
Fundamental Confluences for Trade:
- There seems to be some disconnect between asset classes and with everyone already so 'risk-on', the risk-off build up momentum is ripe for the taking.
Suggested Trade:
Entry @ Area of Interest 0.9830 - 0.9870
SL @ 0.9942
TP 1 @ 0.9720 (Close Half-Position & move SL to Entry level once TP1 is achieved)
TP 2 @ 0.9598
Risk-to-Reward @ Approx. 2.59 (Depending on Entry Level)
________________________________
Boosts 🚀, Follows ✌️, Shares 🙌 & Comments ✍️ are much appreciated!
If you have any ideas or charts, do share them in the 'Comments' section below and we can discuss our perspectives to improve or strengthen our strategies.
If you want something analyzed, do drop me a DM. :D
________________________________
Disclaimer: The above suggestion is an personal opinion in general and does not constitute as investment advice. Any decisions taken based on the above suggestion is purely your own risks.
Any websites / brokers / applications suggested here are also provided as informational purpose only.
________________________________

$HIMS | Allocation | Market Exec |Technical Confluences:
- Price action is near the 50% Fibo retracement area
- Price action have bounced off the 200 MA (Red) and has a valid Resistance Trendline with an Interest Zone nearby
- Stochastics is inn Oversold conditions in the Daily & Weekly timeframes
- Elliot Wave 4 seems to be completing at the 50% Fibo line and aim for the 100% Fibo Extension line @ 29.51
Fundamental Confluences:
- Telemedicine with US being a focus market is great as healthcare issues seems to be increasing; demographics start to shift right
- The main health markets that they target are issues that many in the society prefer to remain anonymous about and telemedicine solves that for them
- One negative would be the high expenses they are spending on A&P budgets, a drag but overtime, we can see the impact of what they have been pushing all these while
________________________________
Putting NYSE:HIMS as part of my medical/health category of my portfolio.
Will start my first allocation now and look at adding more into it if price moves into 50% - 61% Fibo range (Interest Zone).
Remember, DYOR.
________________________________
Boosts 🚀, Follows ✌️, Shares 🙌 & Comments ✍️ are much appreciated!
If you have any ideas or charts, do share them in the 'Comments' section below and we can discuss our perspectives to improve or strengthen our strategies.
If you want something analyzed, do drop me a DM. :D
________________________________
Disclaimer: The above suggestion is an personal opinion in general and does not constitute as investment advice. Any decisions taken based on the above suggestion is purely your own risks. DYOR.

USDCAD | Short H4 | Market Exe | Loonie to Ride the GreenbackTechnical Confluences for Trade:
- Stochastics are in Overbought Conditions on H1 & H4 time-frame
- Price action is at a Supply Zone area
- Price action may reverse towards the ascending support Trendline
- Targeting the 38.2% Fibo retracement
Suggested Trade:
Entry @ Area of Interest 1.3760 - 1.3800
SL @ 1.3854
TP 1 @ 1.3697 (Close Half-Position & move SL to Entry level once TP1 is achieved)
TP 2 @ 1.3611
Risk-to-Reward @ Approx. 2.12 (Depending on Entry Level)
________________________________
Boosts 🚀, Follows ✌️, Shares 🙌 & Comments ✍️ are much appreciated!
If you have any ideas or charts, do share them in the 'Comments' section below and we can discuss our perspectives to improve or strengthen our strategies.
If you want something analyzed, do drop me a DM. :D
________________________________
Disclaimer: The above suggestion is an personal opinion in general and does not constitute as investment advice. Any decisions taken based on the above suggestion is purely your own risks.
Any websites / brokers / applications suggested here are also provided as informational purpose only.
________________________________

USDJPY | MT Short H4 | Riding on BOJ InterventionPair: FX:USDJPY
Timeframe: H4 - Medium Term (MT)
Direction: Short
Technical Confluences for Trade:
- Stochastics are in Overbought Conditions on D1, H4 and H1 time-frames
- Price action may face some resistance from a previous support line
- Price is close to 61.8% Fib Extension Level
- Aiming for the 32.8% Fibo Retracement with 23.6% as the TP 1 level
Fundamental Confluences for Trade:
- Dividend repatriation season for Japan where MNCs bring back USD dividends and converts them to JPY
- These levels may see BOJ intervening to stop the Yen weakness
- Yield differential between USA and Japan cannot be denied and dovish BOJ doesn't help much; hence the weak JPY unless we see a firmer BOJ
- Further war escalation from the Israel-Iran tension may bring on risk-off moves and see the JPY strengthen
Suggested Trade:
Entry @ Area of Interest 154.00 - 155.15
SL @ 156.56
TP 1 @ 151.30 (Close Half-Position & move SL to Entry level once TP1 is achieved)
TP 2 @ 149.27
Risk-to-Reward @ Approx. 3.03 (Depending on Entry Level)
May the pips move in our favor! Good luck! :D
*This trade suggestion is provided on an advisory basis. Any trade decisions made based on this suggestion is a personal decision and am not responsible for any losses derived from it.

CHFJPY | MT Short H4 | The Battle of 2 Safe HavensPair: FX:CHFJPY
Timeframe: H4 - Medium Term (MT)
Direction: Short
Technical Confluences for Trade:
- Stochastics are in Overbought Conditions on D1, H4 and H1 time-frames
- Price action may face some resistance from a previous support line
- Price has retraced to 61.8% Fib Retracement Level
- Aiming for the lower Support trendline from the mid of 2023
Fundamental Confluences for Trade:
- SNB has been repeatedly concerned about a strong CHF while BOJ is concerned about a weak JPY
- These levels may see BOJ intervening to stop the Yen weakness and vice versa for SNB
- SNB is the first developed nation to start their cutting rate cycles and BOJ has just started hiking
Suggested Trade:
Entry @ Area of Interest 169.50 - 170.20
SL @ 170.84
TP 1 @ 168.68 (Close Half-Position & move SL to Entry level once TP1 is achieved)
TP 2 @ 167.18
Risk-to-Reward @ Approx. 2.31 (Depending on Entry Level)
May the pips move in our favor! Good luck! :D
*This trade suggestion is provided on an advisory basis. Any trade decisions made based on this suggestion is a personal decision and am not responsible for any losses derived from it.

AUDUSD | MT Long H4 | Middle of Parallel ChannelPair: FX:AUDUSD
Timeframe: H4 - Medium Term (MT)
Direction: Long
Technical Confluences for Trade:
- Stochastics are in Oversold Conditions on D1, H4 and H1 time-frames
- Price action is now at the middle of a parallel channel
- Price is at 61.8% Fib Extension Level
- Aiming for the 50% Fibo Retracement which the horizontal line shows a supply-demand zone.
Fundamental Confluences for Trade:
- Higher commodity prices is a positive for Australia economy
- Further war escalation from the Israel-Iran tension may bring on risk-off moves and affect this trade
Suggested Trade:
Entry @ Area of Interest 0.6390 - 0.6415
SL @ 0.6351
TP 1 @ 0.6448 (Close Half-Position & move SL to Entry level once TP1 is achieved)
TP 2 @ 0.6516
Risk-to-Reward @ Approx. 2.09 (Depending on Entry Level)
May the pips move in our favor! Good luck! :D
*This trade suggestion is provided on an advisory basis. Any trade decisions made based on this suggestion is a personal decision and am not responsible for any losses derived from it.

$NVAX starting its run?With main confluence from MACD , Stochastics, RSI and MTF EMA's, I am expecting a run to 69.28. Momentum looks to be rising on the Daily, but if you look closer on January 26th we see divergence on the MACD indicator (Orange). While price reached a low at that time, MACD has been steadily rising. Price has been driven lower through this time but MACD has been rising. This in connection with the RSI's and Stochastic's tell's me we are starting to see the run up. I committed to this trade on the 6th of June and don't plan on selling until profit target of 69.28.
Depending on momentum once we've reached there, I will close part of my position to allow a possible ride to the golden pocket of the Fibonnaci indicator of .618
Ideally, this is a very technical play, I think with momentum showing to be on the higher side we should see a nice steady run up over the coming next week.
Stay tuned
Im working on an indicator that will help visualize market volatility and momentum. The goal of the indicator is to help you understand current market strength which direction it's favoring.
Before releasing, I am going to fine tune the indicator further to make it more profitable per back testing with python.
I'll release this indicator once it's ready at free cost for a limited time only.

NZDUSD Weekly S/R|200DMA|Broadening Wedge .618 Fib|Bearish PAEvening Traders,
Today’s Analysis – NZDUSD- trading in an Ascending Broadening Wedge with bearish price action, a retest of Weekly S/R likely.
Points to consider,
- Bearish Structure (H&S Pattern)
- .618 Fibonacci Resistance
- Weekly S/R Support (200DMA Confluence)
- RSI Bullish Divergence
- Stochastics Buy Cross
- Volume Declining
The current price action for NZDUSD is bearish representing the psychology of a head and shoulders pattern. The larger formation, the Ascending Broadening Wedge has a higher probability of breaking down. This allows us to have a bearish bias on the market.
The immediate price action has a bullish divergence playing out as indicated by the RSI and the buy cross on the Stochastics. Price is likely to respect resistance from the .618 Fibonacci to complete a probable right shoulder.
Weekly S/R is current macro support with the 200 DMA in confluence; price is likely to come for a back test ad hold of this level.
The volume profile is currently declining, indicative of an influx when key trade locations are tested, especially Weekly S/R levels.
Overall, in my opinion, NZDUSD needs further development in price action before any valid short entries. Price action is to be monitored upon discretion when placing trades.
Hope this analysis helps
Thank you for following my work!
And remember,
“Dangers of watching every tick are twofold: overtrading and increased chances of prematurely liquidating good positions” – Jack Schwager

CGC Probable Higher Low| Structural Resistance to Break!Evening Traders,
Today’s update will be on CGC, clear levels to watch to dictate the trend in coming weeks/months
Points to consider,
- Trend respecting .618 Fibonacci
- Structural resistance to break
- MA’s holding as support
- RSI respecting support
- Stochastics neutral
- Volume below average
CGC has respected its Fibonacci level, .618, signalling buy pressure coming in from structural resistance. A level yet to break will negate the bearish trend in CGC if a break and close above structural resistance comes to fruition.
The Moving Averages is holding true as support, must remain when structural resistance is broken.
The RSI is respecting its support signalling that the relative strength at current time is neutral; this is same with the stochastics.
Volume is clearly below average, must increase if market structure is to be negated
Overall, in my opinion, CGC has a clear resistance to break which will negate the bearish trend by putting in a higher high.
Till then the macro bear trend is still intact
What are your thoughts?
Please leave a like and comment,
And remember,
“When you learn to let go of the need to be right, being wrong gradually lose its power to disturb you.”
― Yvan Byeajee

AUD USD AnalysisFrom the daily chart
Bearish engulfing candles followed by Pin Bar.
Rejection from 61.8 level.
Divergence is evidence on Stochastics.
From the 4 Hr & 1 Hr
Divergence evidence on both Stochastics and RSI.
Tripe top has formed and unable to break above the 61.8 level.
Risk Reward
Based on a Sell entry when price breaks out of the consolidation box and assuming a stop loss at the top of the box then;
1:3 is possible to the bottom level of structure.
1:5 is possible to the bottom of the 61.8 level leg D
