ALBERTSONS Stock Chart Fibonacci Analysis 022424Trading Idea
1) Find a FIBO slingshot
2) Check FIBO 61.80% level
3) Entry Point > 21.2/61.80%
Chart time frame : D
A) 15 min(1W-3M)
B) 1 hr(3M-6M)
C) 4 hr(6M-1year)
D) 1 day(1-3years)
Stock progress : C
A) Keep rising over 61.80% resistance
B) 61.80% resistance
C) Hit the bottom
D) Hit the top
Next report date
—
Report period
—
EPS estimate
—
Revenue estimate
—
1.94USD
1.30 BUSD
79.24 BUSD
378.28 M
About Albertsons Companies, Inc.
Sector
Industry
CEO
Vivek Sankaran
Website
Headquarters
Boise
Employees (FY)
285 K
Founded
1939
FIGI
BBG009KG1750
Albertsons Cos., Inc. engages in the operation of food and drug retail stores. It offers grocery products, general merchandise, health and beauty care products, pharmacy, fuel, and other items and services. The company was founded by Joe Albertson on July 21, 1939 and is headquartered in Boise, ID.

ACI Albertsons Companies Options Ahead of EarningsAnalyzing the options chain and the chart patterns of ACI Albertsons Companies prior to the earnings report this week,
I would consider purchasing the 23usd strike price at the money Calls with
an expiration date of 2024-2-16,
for a premium of approximately $0.92.
If these options prove to be profit

Unveiling Profit Potential - Targeting Buyside Liquidity Hello, fellow traders! Today, I am excited to present a trade idea that focuses on capturing the potential upside by targeting buyside liquidity. This opportunity offers an enticing entry point and takes advantage of sellside liquidity on the M15 timeframe, ensuring a favorable risk-reward ratio.
B

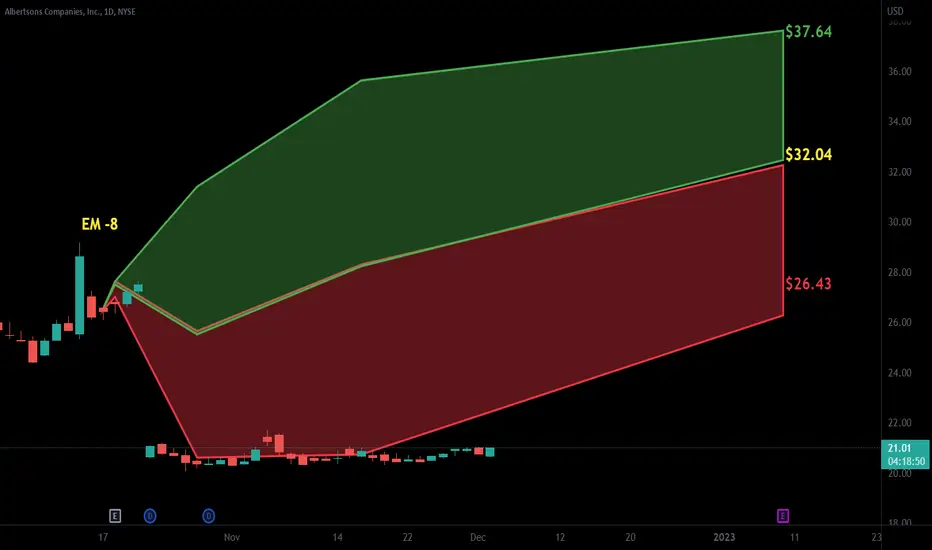
Grocery gap fillNice little ascending triangle formation after a big gap down. Locking in some profit at 24 bucks and moving up stop (price action resistance and the 200 SMA will be right in that area as well) and will take some more around $27. After that if it still looks like it has legs I'll trail a stop. 1.

Look for BuyHello,
Albertsons Companies, Inc. is an American grocery company founded and headquartered in Boise, Idaho. With 2,253 stores as of the third quarter of fiscal year 2020 and 270,000 employees as of fiscal year 2019, the company is the second-largest supermarket chain in North America after Kroger.


$ACI with a Bullish outlook following its earnings #Stocks The PEAD projected a Bullish outlook for $ACI after a Positive Under reaction following its earnings release placing the stock in drift A.
i think it fills1. daily - above prior high low
2. weekly - above
3. monthly - above
prior similar move..gap was filled

WATCH $ACIBearish
- Double tops
- Inverse head and shoulders
- Inverse cup and handle
- Bear flag
- Broke down neckline
- Broke down trend line
Everything bearish appeared here.
“A quitter never wins and a winner never quits.”

ACIPotential long setup in case today was a fluke. Not betting on it, but always open to possibilities. Below $28 & you can scrap this idea imo. Bearish RSI divergence noted.

See all ideas
An aggregate view of professional's ratings.
Trade directly on the supercharts through our supported, fully-verified and user-reviewed brokers.


Curated watchlists where ACI is featured.

Frequently Asked Questions
The current price of ACI is 20.45 USD — it has increased by 0.34% in the past 24 hours. Watch Albertsons Companies, Inc. stock price performance more closely on the chart.
Depending on the exchange, the stock ticker may vary. For instance, on NYSE exchange Albertsons Companies, Inc. stocks are traded under the ticker ACI.
ACI stock has risen by 3.02% compared to the previous week, the month change is a 3.49% rise, over the last year Albertsons Companies, Inc. has showed a 5.54% decrease.
We've gathered analysts' opinions on Albertsons Companies, Inc. future price: according to them, ACI price has a max estimate of 27.25 USD and a min estimate of 21.00 USD. Watch ACI chart and read a more detailed Albertsons Companies, Inc. stock forecast: see what analysts think of Albertsons Companies, Inc. and suggest that you do with its stocks.
ACI stock is 2.34% volatile and has beta coefficient of −0.03. Track Albertsons Companies, Inc. stock price on the chart and check out the list of the most volatile stocks — is Albertsons Companies, Inc. there?
Today Albertsons Companies, Inc. has the market capitalization of 11.80 B, it has increased by 0.80% over the last week.
Yes, you can track Albertsons Companies, Inc. financials in yearly and quarterly reports right on TradingView.
Albertsons Companies, Inc. is going to release the next earnings report on Oct 15, 2024. Keep track of upcoming events with our Earnings Calendar.
ACI earnings for the last quarter are 0.54 USD per share, whereas the estimation was 0.52 USD resulting in a 3.03% surprise. The estimated earnings for the next quarter are 0.49 USD per share. See more details about Albertsons Companies, Inc. earnings.
Albertsons Companies, Inc. revenue for the last quarter amounts to 18.34 B USD, despite the estimated figure of 18.45 B USD. In the next quarter, revenue is expected to reach 18.47 B USD.
ACI net income for the last quarter is 240.70 M USD, while the quarter before that showed 250.50 M USD of net income which accounts for −3.91% change. Track more Albertsons Companies, Inc. financial stats to get the full picture.
Yes, ACI dividends are paid quarterly. The last dividend per share was 0.12 USD. As of today, Dividend Yield (TTM)% is 2.36%. Tracking Albertsons Companies, Inc. dividends might help you take more informed decisions.
Albertsons Companies, Inc. dividend yield was 2.24% in 2023, and payout ratio reached 21.54%. The year before the numbers were 2.34% and 21.18% correspondingly. See high-dividend stocks and find more opportunities for your portfolio.
As of Jul 27, 2024, the company has 285.00 K employees. See our rating of the largest employees — is Albertsons Companies, Inc. on this list?
EBITDA measures a company's operating performance, its growth signifies an improvement in the efficiency of a company. Albertsons Companies, Inc. EBITDA is 4.66 B USD, and current EBITDA margin is 6.02%. See more stats in Albertsons Companies, Inc. financial statements.
Like other stocks, ACI shares are traded on stock exchanges, e.g. Nasdaq, Nyse, Euronext, and the easiest way to buy them is through an online stock broker. To do this, you need to open an account and follow a broker's procedures, then start trading. You can trade Albertsons Companies, Inc. stock right from TradingView charts — choose your broker and connect to your account.
Investing in stocks requires a comprehensive research: you should carefully study all the available data, e.g. company's financials, related news, and its technical analysis. So Albertsons Companies, Inc. technincal analysis shows the buy rating today, and its 1 week rating is neutral. Since market conditions are prone to changes, it's worth looking a bit further into the future — according to the 1 month rating Albertsons Companies, Inc. stock shows the sell signal. See more of Albertsons Companies, Inc. technicals for a more comprehensive analysis.
If you're still not sure, try looking for inspiration in our curated watchlists.
If you're still not sure, try looking for inspiration in our curated watchlists.