TRON Large Falling WedgeLarge falling wedge formation on TRON, price action can be seen to be mirroring the 1.618 fib ring upon re-entry, price may continue up to the downward trendline before a pullback occurs.
Search in ideas for "tronix"

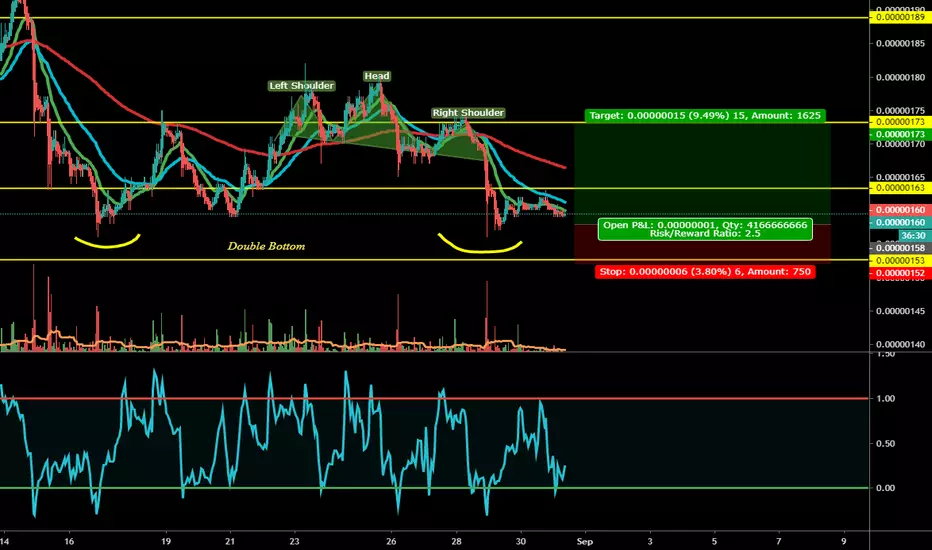
TRXUSD: Climbing higherTRXUSD looks pretty decent.
Flip S / R and now preparing to assault 0.016 BTC resistance zone.
I'm long here using a wide stop ('coz I'm always caution with alts and their dreadful swings), R:R ratio is 1:2, not bad.
At resistance, shorts looks more rewardable, invalidation - close above $3 at 4h / 1d timeframe.
Information is just for educational purposes, never financial advice. Always do your own research.

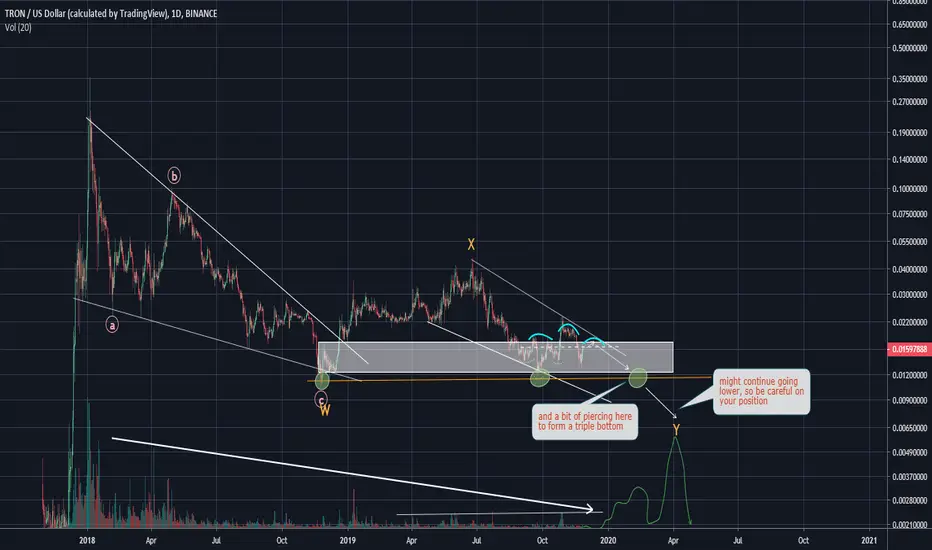
TRX (Daily)Same as EOS, a credible case for a bottom can now be done on the macro chart.
We might still go slightly lower

TRX looks ugly as usual I think i ofrgot to post this red level here on trading view. Was posted on twitter before the dump though
#TRX looking as #ugly as ever

TRX +80 % Cup and handleWe already had 3 cases of Cup and handle before but only two that worked very well.
You can see on the graph the conditions for it to work.
At this price I sell all TRX after buying for 0.013. It made me a gain of 70%. Now I'm going to buy at 0.0185 a little closer for a gain of over 80%.
Risk 8% for target 80%
Ratio: 10

Trials for a bull runHello everyone, this is our view on trxbnb, enjoy!
Analysis:
we're trying out our bot (90%+ winrate) which set long so we're approaching this coin analysis. Same indicators as usual, no need for explanation I believe.
Strategy:
Entry: 918-894-878-854 (less likely)
Target: 975 (if strong resistance is found, then sell all at this level)
Sell: 1085-1257-1527
Stoploss: below 789
Risk: 6.1
High risk for big gains!
Trade safe. Anlvis


TRON SET TO SOAR TO NEW ATH'sCall me crazy but I like trading fractals. I believe Tron is poised for a major run to new ATH. We are making a nerve-wrecking third higher low trying to claw our way out of this grizzly bear market. On this weekly chart we see the 4 candles which brought us to our cyclical low and subsequent bounce in Nov-Dec '18 looking awfully similar to what has been going on over the last 3 weeks. The nice part about this is the fact that we are still respecting the ever-so-slight uptrend started at the end of last year. The RSI also looks very similar, making what will inevitably (if I am right) be a "W" shape. The sentiment zone oscillator is looking ready for a move as well. I believe within the next two weeks we will see a test of the downwards trending ceiling at about 2.5 cents. If that ceiling is taken out, we are off to the races. If we fail to break it over the course of a couple weeks we will test back down trying to respect the uptrend and continuing to wedge in between the white lines. Given where I think this market currently is, I believe we are in for a big move and I am biased to the upside.
Let me know what you think, even if you are one of the Trading View slime-balls who lurk in the shadows talking trash and trying to leach ideas while having none of your own.
* I am trying to gain a following to spread some ideas. A follow, like, and comment would be very much appreciated
G*D BLESS

"Good Alts" VS "Dead Alts" Hey guys. I know I said I wouldn't post any more written analysis until the next broader move for the crypto market becomes more apparent. While we patiently wait for the reaction from the 50w/100w bullish MA cross for Bitcoin, I thought I'd take a look at what makes an alt "dead" versus one of the ones that seems likely to survive through the rest of this bottoming period.
Above, you can see I've put two coins side by side. In fact, VET and WTC were once considered to be competitors, and perhaps equals by some investors. They are both "supply chain" coins, though VeChain differentiates itself as a platform in a number of ways. Waltonchain (right) has clearly underperformed. This is something I forecasted myself, when I sold my entire WTC position much earlier this year. The reason I sold was NOT due to price action. You can see that even selling based on the chart hasn't always been a foolproof method, since VET briefly made a lower low recently, but bounced impressively afterwards. I sold my WTC position because I thought their marketing blunders would be very difficult to overcome, and I didn't think they were professional enough to compete. And this was AFTER averaging down on it, choosing to ignore the glaring red flags. I eventually made a decision to sell at a loss, expecting that they'd probably get buried. Since I sold, WTC has continued its freefall as other cryptos have held horizontal supports, even though it was already 98% down from its all-time high. It is now 99% down. Yes, it could pump 100% in the near future, but it doesn't seem likely to ever achieve its former glory, price wise.
When you look at the VET chart, you can see that VET has actually held the same horizontal support zone for an entire year. It is also back above the lows from August, 2018. Many alts (including big caps like ETH, XRP, and XLM) aren't even above those August 2018 lows. Waltonchain would have to go roughly 400% from current prices to get back comfortably to that zone.
This is basically an observational post. It's also to see whether or not specific altcoin performance over the last year will influence future price appreciation. Below, I will make some more comparisons, so you can see how drastic the differences in performance are across the altcoin market:
The LINK/USD chart versus the GVT/USD chart almost looks like the complete inverse! ChainLink is up 1000% in the same timeframe that Genesis Vision is down 66-70%! This is an extreme example. GVT is the second altcoin position I dumped over the last year. I sold it in favor of ONT. My ONT position is a little above break even, while GVT is down over 60% since I sold.
Perhaps more subtle, you can see that even investing in NANO at the bottom in August 2018 would have saved you losses, compared with Ethereum in the same timeframe. NANO has continuously tested the same horizontal support since then, while Ethereum continues to find resistance at the support from the August, 2018 altcoin capitulation. It should be noted that ETH is at a 90% overall loss since the peak, compared with NANO over 97%.
XTZ (Tezos) outperforming NEO:
BAT vastly outperforming XLM, which hasn't even been able to retest the August 2018 support since it broke down last November:
And lastly, McDaddy Bitcoin outperforming XRP, but not by that wide of a margin. XRP only recently broke down from that support, and Bitcoin came close to testing it recently.
Anyway, I find this interesting, particularly since most of what I do is observe and analyze the crypto market. I will continue to post when I can, but things have slowed down considerably. However, altcoins are still behaving very similar to the 2015 crypto bear market bottom. The oscillator divergence is a little bit less extreme this time, which could indicate weakness here, but it's still there. We also have arguably NOT broken this trendline. It really depends on how you draw it. With growth slowing down, I expect this trendline to eventually form a curve, so it's not necessary that it's held perfectly. I do think these trendlines are important when figuring out where price may bounce or get rejected, as evidenced by my perfect top call in June.
If we are seeing a long term bottoming period for this market, based on this analysis it is clear that not all alts are created equally. There's also a whole class of alts that pump and dump from the same supports and resistances in each altcoin cycle. Maybe I'll do a separate post on those.
Here I will also list my coin positions from biggest to smallest, as well as my lowest and highest buy-in points. I also list my break even point if at a loss.
VeChain (VET) - Lowest purchase: $0.0034, current price $0.0069. Up over 100% from bottom. Highest purchase around $5/$0.05 in 2017. Overall break even point around $0.01. Due to its performance over the last month, VET is my largest position right now.
Ethereum (ETH) - Lowest purchase: $107, current price $148. Up roughly 30%, including a buy at $130. Position in overall profit.
XRP - Only purchase - $0.32. Current price, $0.227. Down 30%. Break even at $0.32
NEO - Average (lowest) buy: $6.00, current price $8.90. Up about 50%. Position in overall profit.
NANO - Lowest purchase: $0.80, current price $0.83. Highest purchase $20 in 2017 (ouch!). Break even point around $2.00.
Ontology (ONT) - Lowest buy (only purchase) - $0.60. Current price $0.62. Up about 4%. Position in overall profit.
Stellar Lumens (XLM) - Lowest buy $0.059. Current price $0.055. Down about 10%. Highest purchase $0.40 in 2017. Break even point around $0.16. Overall loss about 75%. Has held my portfolio down the most.
Smartlands (SLT) - Lowest buy $0.30. Current price $0.31. Original purchase at $1 in 2018. Break even point around $0.75. Overall 50% loss.
Former positions: :
Tronix (TRX) - bought at 240 sats in 2018, sold at 600 sats for NEO, hence my low average buy-in for NEO. I sold TRX because their ecosystem is not user-friendly when compared with NEO/ONT.
Waltonchain (WTC) - lowest buy $2. Highest purchase - $25 in 2018. Overall loss, probably close to 80%.
Genesis Vision (GVT) - lowest purchase $6. Highest purchase - $27. Overall loss, probably around 50%, even though I sold it for ONT.
This crypto thing has been an experiment for me in a number of ways. Above is my personal record. I will emphasize that I am still roughly 50% down on my principle investment. This is with ONLY investing in altcoins since the beginning of 2018. Not terrible (the overall altcoin market is still down 87%), but also really not ideal. I could have easily avoided some losses by selling at least half of all my crypto when I called the top in June. But alas, most of my analysis is for my own education. I do plan on trading more eventually, but when my life situation gets a little more stable (I'm in a big transition period).
This is not financial advice. I will continue to use this platform as my investing/crypto journal. Aside from personal use, this is meant for education, speculation, and entertainment only.
-Victor Cobra

TRXUSDQuite a looking bearish trade. Despite of all the major coins showing bullish strength, yet TRXBTC shows a different story.
Also the volume here is still recovering and in a consolidation period.
TRXZ19 TRON bullish breakout ?TRX bounce from 181 sats strong support. TRX was farmed HL formation at 183 sats. Finished ABC correction.
Price action above EMA 21,50,100,200 periods, Uptrend. Potential retest double bottom at 210 sats.
Volume: confirm bullish price action.
Pattern: ABC correction , Symetrical Triangle.
Indicators: MACD bullish crossover above zero line. RSI above 50 points. Bullish sign.
S/R: support 180, major support at 166 sats. Resistance at 200 psychology, Major Resistance 210 double top.
Disclaimer: THIS IS NOT FINANCIAL ADVICE. All the information shared here is for learning and entertainment purposes only.

TRX - Range ConsolidationI will build a strategy already from the exit from the range indicated on the chat
According to cluster analysis, sales have prevailed over the past three days. Was it profit taking or a short set?
Think for yourself? and share your opinion


TRON (Sept 17) #TRX $TRX #BTC $BTC #USDT $USDTBuy : 150-155 / 0.0155$
Sell : 165-180 / 0.0165-0.018$
Mid-Hold : 200-220 / 0.02-0.023$
Stop : 140 / 0.135$

TRX - Showing Signs Of SupportLooking like a sign of a small bounce on TRX. Although any FUD from that region of the world could make it interesting. Be careful though. Dominance not low enough but TRX has suffered the most losses.

Tron Double Bottom In ??Double Bottom Pattern is detected in PUMP and DUMP coin Tron!!
Will it show a positive impact ??
For Risk Takers only
Buy @ 158-160
Sell @ 172 or lower as per your risk
Stoploss @ 152 or lower
TRX - Reputation Damaged By Founder & China Issues?TRX has always had life in it even when Bitcoin would pump but every since the issues in China with Justin Sun, it appear it has only been a one way downwards with the bears.
There used to always be some marketing trick up the sleeve of the founder. But has that fizzled out.
Worrying times

Tron/Bitcoin (Aug 21) #TRX $TRX #BTC $BTCTRX will dump so deep and we will consider buying it in the range of 135-140
I say "Consider", not "Buy"

Is TRX about to go on a bull run?I'm not sure if I drew this right but the correction for TRXBTC seems to be almost done. The next bull run will bring TRXBTC to around 3000 sats.

Nightly Review Of BCH BTC LTC TRX XRP Nightly review of Cryptocurrencies ill be looking to play out in the next couple days.

TRON LOOKING OVER SOLD ON THE RSI!!! Tron is looking way over sold on the daily RSI everytime it went this low went looked at large upswings in the bulls favor.

TRXUSD Daily 7/8/2019 followDaily to go with hourly analysis. Please refer to 4H frame related idea!
Thank you for follow! As always trade with risk manage and I hope you enjoy this idea! Please like and comment any thoughts :) !

TRX is Very BULLISH!!!Hey guys!
This daily Rsi Divergence will make TRX pump a lot!
Like and Follow for more awesome Calls that I spot on! :))
Good Luck!
