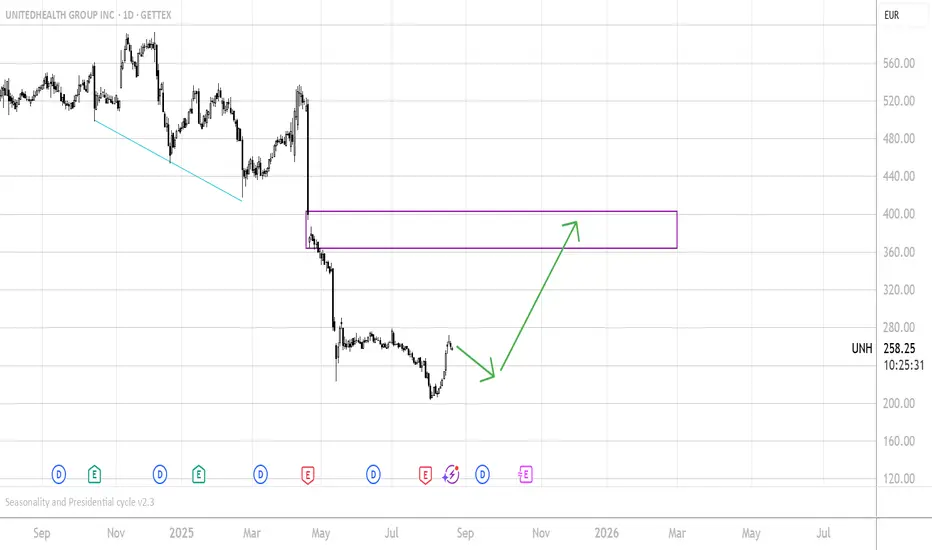
UNITEDHEALTH UNH Long Scenario based on Seasonality and FractalsFrom a fractals Perspective I expect a chance for around 30% gain from an upcoming upmove.
From a Seasonal Perspective I expect a retracement mode until End of Mid/September and then upside until early December.
I hope we make the bigger upmove in this time and complete that move otherwise this fractals target could take some time/moths/years.
Feel free to like / support the Idea, leave a comment or contact me in the chat.
Good luck to all
*this is not a trade call*
Cheers!
Sector
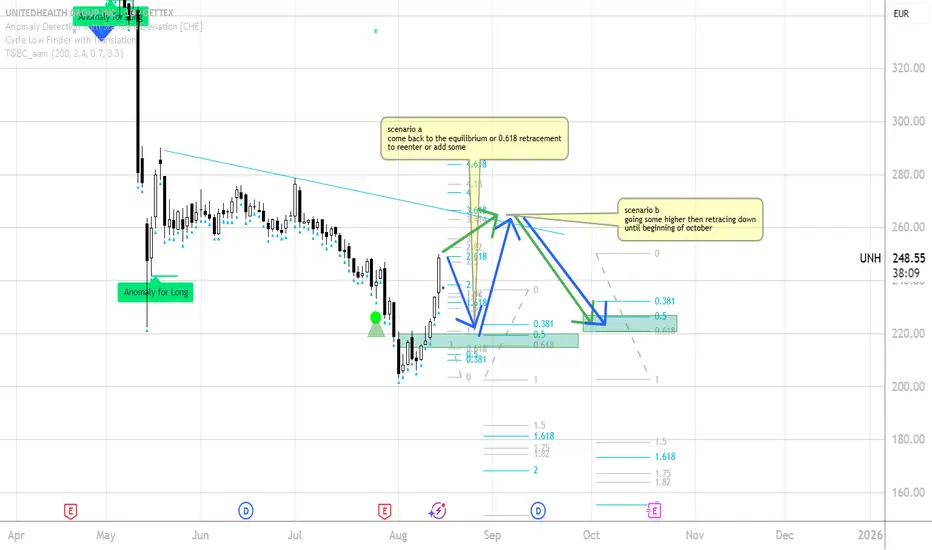
UNITED HEALTH UNH - Two scenarios based on my understanding a sescenario a:
coming back to the 50% or 0.618 retracement then up, then in a typical seasonal bearish period down until beginning of october
scenario b:
First target could be at the descrending trendline then retracement until beginning of october
to the 50% or 0.618
this is of course not a trade call or advide. for educational purpose only...
please comment or chat with me about it!
cheers!
Sector Rotation Analysis: A Practical Tutorial Using TradingViewSector Rotation Analysis: A Practical Tutorial Using TradingView
Overview
Sector rotation is an investment strategy that involves reallocating capital among different sectors of the economy to align with their performance during various phases of the economic cycle. While academic studies have shown that sector rotation does not consistently outperform the market after accounting for transaction costs, it remains a popular framework for portfolio management.
This tutorial provides a step-by-step guide to analyzing sector rotation and identifying leading and lagging sectors using TradingView .
Understanding Sector Rotation and Economic Cycles
The economy moves through distinct phases, and each phase tends to favor specific sectors:
1. Expansion : Rapid economic growth with rising consumer confidence.
- Leading Sectors: Technology AMEX:XLK , Consumer Discretionary AMEX:XLY , Industrials AMEX:XLI
2. Peak : Growth slows, and inflation may rise.
- Leading Sectors: Energy AMEX:XLE , Materials AMEX:XLB
3. Contraction : Economic activity declines, and unemployment rises.
- Leading Sectors: Utilities AMEX:XLU , Healthcare AMEX:XLV , Consumer Staples AMEX:XLP
4. Trough : The economy begins recovering from a recession.
- Leading Sectors: Financials AMEX:XLF , Real Estate AMEX:XLRE
Step 1: Use TradingView to Monitor Economic Indicators
Economic indicators provide context for sector performance:
GDP Growth : Signals expansion or contraction.
Interest Rates : Rising rates favor Financials; falling rates benefit Real Estate.
Inflation : High inflation supports Energy and Materials.
Step 2: Analyze Sector Performance Using Relative Strength
Relative Strength RS compares a sector's performance against a benchmark index like the
SP:SPX This helps identify whether a sector is leading or lagging.
How to Calculate RS in TradingView
Open a chart for a sector TSXV:ETF , such as AMEX:XLK Technology.
Add SP:SPX as a comparison symbol by clicking the Compare ➕ button.
Analyze the RS line:
- If RS trends upward, the sector is outperforming.
- If RS trends downward, the sector is underperforming.
Using Indicators
e.g.: You may add the Sector Relative Strength indicator from TradingView’s public library. This tool ranks multiple sectors by their relative strength against SP:SPX
Additionally, you can use the RS Rating indicator by @Fred6724, which calculates the Relative Strength Rating (1 to 99) of a stock or sector based on its 12-month performance compared to others in a selected index.
Example
In early 2021, during economic recovery, AMEX:XLK 's RS rose above SP:SPX , signaling Technology was leading.
Step 3: Validate Sector Trends with Technical Indicators
Technical indicators can confirm sector momentum and provide entry/exit signals:
Moving Averages
Use 50-day and 200-day Simple Moving Averages SMA.
If a sector TSXV:ETF trades above both SMAs, it indicates bullish momentum.
Relative Strength Index RSI
RSI > 70 suggests overbought conditions; <30 indicates oversold conditions.
MACD Moving Average Convergence Divergence
Look for bullish crossovers where the MACD line crosses above the signal line.
Example
During the inflation surge in 2022, AMEX:XLE Energy traded above its 200-day SMA while RSI hovered near 70, confirming strong momentum in the Energy sector.
Step 4: Compare Multiple Sectors Simultaneously
TradingView allows you to overlay multiple ETFs on one chart for direct comparison:
Open AMEX:SPY as your benchmark chart.
Add ETFs like AMEX:XLK , AMEX:XLY , AMEX:XLU , etc., using the Compare tool.
Observe which sectors are trending higher or lower relative to AMEX:SPY
Example
If AMEX:XLK and AMEX:XLY show upward trends while AMEX:XLU remains flat, this indicates cyclical sectors like Technology and Consumer Discretionary are outperforming during an expansion phase.
Step 5: Implement Sector Rotation in Your Portfolio
Once you’ve identified leading sectors:
Allocate more capital to sectors with strong RS and bullish technical indicators.
Reduce exposure to lagging sectors with weak RS or bearish momentum signals.
Example
During post-pandemic recovery in early 2021:
Leading Sectors: Technology AMEX:XLK and Industrials AMEX:XLI
Lagging Sectors: Utilities AMEX:XLU
Investors who rotated into AMEX:XLK and AMEX:XLI outperformed those who remained in defensive sectors like AMEX:XLU
Real-Life Case Studies of Sector Rotation
Case Study 1: Post-Pandemic Recovery
In early 2021, as economies reopened after COVID-19 lockdowns:
Cyclical sectors like Industrials AMEX:XLI and Financials AMEX:XLF outperformed due to increased economic activity.
Defensive sectors like Utilities AMEX:XLU lagged as investors shifted away from safe havens.
Using TradingView’s heatmap feature , investors could have identified strong gains in AMEX:XLI and AMEX:XLF relative to AMEX:SPY
Case Study 2: Inflation Surge in Late 2022
As inflation surged in late 2022:
Energy AMEX:XLE and Materials AMEX:XLB outperformed due to rising commodity prices.
Technology AMEX:XLK underperformed as higher interest rates hurt growth stocks.
By monitoring RS lines for AMEX:XLE and AMEX:XLB on TradingView charts, investors could have rotated into these sectors ahead of broader market gains.
Limitations of Sector Rotation Strategies
Transaction Costs : Frequent rebalancing can erode returns over time.
Market Timing Challenges : Predicting economic cycles accurately is difficult and prone to errors.
False Signal s: Technical indicators like MACD or RSI can produce false positives during volatile markets.
Historical Bias : Backtested strategies often fail when applied to future market conditions.
Conclusion
Sector rotation is a useful framework for aligning investments with macroeconomic trends but should be approached with caution due to its inherent limitations. By leveraging TradingView ’s tools, such as relative strength analysis, heatmaps, and technical indicators, investors can systematically analyze sector performance and make informed decisions about portfolio allocation.
While academic research shows that sector rotation strategies do not consistently outperform simpler approaches like market timing or buy-and-hold strategies, they remain valuable for diversification and risk management when used judiciously.

Nifty and Sectoral Analysis till 31 Dec 2024 - View January 2025Sectoral Analysis
Time Frames
Yearly
Monthly
Weekly
Daily

Healthcare Sector Poised For A 7% to 15% Rally Into Early 2025My continued research to help traders shows the US Healthcare and Biotech sectors are poised for a very large rally phase into early 2025.
Particularly, XLV and XBI seem uniquely setup to rally more than 9-10% over the next 60 to 90+ days.
This video explains how I use my Adaptive Dynamic Learning Predictive Modeling system to find opportunities other people miss.
Using technology, predictive modeling, and inference engines like this is one advantage I have because I can build any type of technology or system I like - and use it on any symbol or interval I like.
Now is the time to prepare for the big moves headed into 2025. Follow my research if you want to target the biggest price swings in the markets.
Get some.
#trading #research #investing #tradingalgos #tradingsignals #cycles #fibonacci #elliotwave #modelingsystems #stocks #bitcoin #btcusd #cryptos #spy #es #nq #gold

SPDR Select Sector Fund - Energy Select SectorIf you like my Idea, Don't forget to Boost and comment on my Analysis.. The recommendations are purely for educational purpose only, consult you financial advisor before trading.
if you have any questions do not hesitate to contact me.

Special Analysis on DQ - it is about time!Some time ago, a good friend tol me about buying DQ. That's when I started tracking for this friend's benefit, and offering my own perspective. Real as it was, previous calls were pretty on the spot and DQ dropped significantly since I started looking at it on occasion.
I am looking at it again now... and I see nice things for a bullish run to commence soon.
1. A double bottom formed
2. on the back of Bullish Divergences of both MACD adn VolDiv indicators. (See green arrows below)
3. XLE and friends like BTU (just posted) and ENPH are showing their own bottoming out.
4. Projected to about 29ish and then possibly to above 40 in the longer run. For this, we need the bottoming pattern to complete and start a proper bull rally, which is then likely to be clearer to double-triple the current price of today.
Time to really look and maybe accumulate if you ask me.

Big Swing Trade Opportunity in ASHOK LELANDAshok Leyland is around the medium support
With the support EMA is also working and we are getting support around the same level
Support levels are 155-160
We can see jump upto 210 level in coming weeks
Thank You !!
Disclaimer : We are not SEBI registered analyst. Do your own research before taking any investment decision.

XLK Support?Tech sector bounced off lower trend channel. Looks like it could get squeezed and a breakout setup could be near... Which way though? A downside break could mean lower lows for the summer.

EICHER Motors is around Long term support Eicher Motors is around the medium term support !!
Stock has never broken support working from 2020
Log Chart support is working beautifully and has support around 3500-3600
On a Linear Chart stock has made 2 support and recently short term support working
Linear chart support is around 3480-3520 !!
Stock is Goof until support is intact !!
Thanks !!
Disclaimer : We are not SEBI registered analyst. Do your own research before taking any investment decision.

LWL.N0000LWL will be bullish in upcoming days. LWL needs to close daily candles above 50+ (above 50, 200 MA lines)
Disclaimer: The information and analysis provided in this publication are for educational purposes only and should not be construed as financial advice or recommendations to buy, sell, or hold any securities. The author and TradingView are not responsible for any investment decisions made based on the content presented herein. Always consult a financial professional before making any investment decisions.

STUPID OR WHAT? 1333Made a buy position in bdl with a target of 1333.
20% I guess is a good target although my strategy is to attain 2% a week but why loose an oppurtunity.

2023 ETFs as of 7/11/2023This is just a simple comparison of sector ETFs after 6 months. Do with it as you wish. There is no skin of my nose. Really, go ahead. I'm just adding filler. For some reason my initial description was too short.

Nifty auto cnxauto aka nifty auto given an all time breakout of a long term upper trendline sector and all the components of the mentioned stocks is also following the same trend of the index one can add auto stocks on dips this sector can be leading sector soon

XLY WCA - Inv H&SSector: Consumer Discretionary Select Sector SPDR Fund
Ticker: XLY
Exchange: NYSE Arca
Industry: Exchange-Traded Fund
Introduction:
Welcome to our weekly technical analysis. Today, we're looking at the Consumer Discretionary Select Sector SPDR Fund (XLY), listed on the NYSE Arca exchange. The weekly chart is currently exhibiting an inverted Head and Shoulders pattern, suggesting a potential bullish reversal.
Inverted Head and Shoulders Pattern:
An inverted Head and Shoulders pattern is typically seen during periods of market consolidation following a downtrend. It signals a potential reversal, characterized by three troughs, with the central one (the head) being the deepest, and the two on the sides (the shoulders) being shallower and roughly equal in depth.
Analysis:
Previously, the XLY sector was in a clear downward trend, as represented by the blue diagonal resistance. However, the emergence of an inverted Head and Shoulders pattern during the consolidation phase suggests a potential bullish reversal. Impressively, the right shoulder is higher than the left shoulder, adding to the bullish sentiment.
Furthermore, the price has broken above the 200 EMA and the horizontal resistance at 153.40, reinforcing the bullish environment. The current consolidation at this previous resistance level, indicated by a dragonfly doji, may solidify the breakout. However, confirmation will only come with the closure of the current candle.
Should the breakout hold, the price target is set at $177, indicating a potential upside of approximately 16.7%.
Conclusion:
The weekly chart of the XLY sector reveals an intriguing setup in the form of an inverted Head and Shoulders pattern, suggesting a potential bullish reversal. This may signal profitable trading opportunities in stocks within this sector over the coming weeks.
As always, this analysis should be used as part of your overall market research and risk management strategy, and not as direct trading advice. Remember, trading carries risk, and past performance is not indicative of future results.
If you found this analysis helpful, please consider liking, sharing, and following for more insights. Wishing you profitable trading!
Best regards,
Karim Subhieh

XLC Sector WCA - Inv HS Sector: Communication Services (XLC)
Introduction:
Hello everyone! Today, we're analyzing the weekly chart of the Communication Services Sector (XLC). After a clear downward trend, we observe a potentially bullish reversal marked by a variation of an inverted head and shoulders pattern.
Inverted Head and Shoulders Pattern:
Typically, an inverted head and shoulders pattern serves as a bullish reversal signal, suggesting a shift from a downtrend to an uptrend.
Analysis:
The XLC's price action has been forming a variation of an inverted head and shoulders pattern over the past 342 days. With a recent breakout above the horizontal neckline at $60, the price is decisively above the 200 EMA, supporting a bullish market environment.
The projected price target based on this pattern is $75, which equates to a potential increase of around 25%. From this analysis, we infer that the Communication Services Sector may outperform in the coming weeks or even months. Therefore, it might be worthwhile to pay closer attention to the individual stocks within this sector.
Conclusion:
The weekly chart of the XLC sector has shown a confirmed bullish reversal signaled by an inverted head and shoulders pattern. With a successful breakout above the neckline already in place, this could indicate a continuing bullish trend, suggesting that it may be an opportune time for long positions in this sector.
As we expect the Communication Services Sector to potentially outperform in the coming weeks or months, investors might consider focus on individual stocks within this sector for investment opportunities.
As always, your own research and risk management strategies should guide your investment decisions.
Thank you for tuning into this analysis. Don't forget to like, share, and follow for more insights into the market. Happy trading!
Best regards,
Karim Subhieh

PPG Industries WCA - Rectangle Reversal PatternCompany: PPG Industries
Ticker: PPG
Exchange: NYSE
Sector: Materials
Introduction:
Hello and thank you for taking the time to read my post. Today, we analyze PPG Industries' chart on the weekly scale, focusing on a classic price pattern called the "Rectangle Pattern." PPG Industries is a global supplier of paints, coatings, and specialty materials, traded on the NYSE under the ticker PPG.
Classic Rectangle Pattern:
The classic rectangle pattern is a chart pattern formed when the price of an asset moves between two parallel horizontal lines, representing support and resistance levels, over a period of time. It reflects a consolidation phase where the market is undecided about the direction of the trend and can serve as a reversal or continuation pattern depending on the context.
Analysis:
PPG Industries offers an excellent example of a rectangle pattern serving as a reversal pattern. The overall trend has been bearish since 07/06/2021, with the rectangle emerging as a consolidation pattern during this period. This 399-day-old pattern demonstrates clear touchpoints on both the lower and upper boundaries, which are situated at 107 and 138, respectively. Recently, the price broke out of the rectangle and is now retesting the multi-month resistance-turned-support, suggesting a potential trend reversal. All of that happens above the 200 EMA.
Price Targets and Resistance Levels:
The price target for this pattern is set at 168.55, which translates to a 22.13% increase from the current level. On the way to the target, we may encounter resistance at a supply zone near 168, which should be monitored closely.
Conclusion:
The PPG Industries weekly chart showcases a textbook example of the rectangle reversal pattern, indicating a potential trend change from bearish to bullish. As the price has broken out of the rectangle and is currently retesting the former resistance as support, traders should keep a close eye on the development of this pattern. Remember to consider risk management and proper position sizing when trading based on chart patterns.
Please note that this analysis is not financial advice. Always do your own due diligence when investing or trading.
If you found this analysis helpful, please like, share, and follow for more updates. Happy trading!
Best regards,
Karim Subhieh

Has XLF caught support after todays drop?To be honest i don't know where XLF will go from here. With my current skill level and studies, I think we can go a little more lower. What do you guys think? Comment Below

what would continuation toward contango look like?spot is having a time catching up with price, and this is one of my favorite derivatives. if the turnaround is going to continue to break out, and we pull back to a comfortable level keeping the uptrend daily i would follow the uptrend with leverage. im excited about the current daily pattern being a sign that a snap back to the bulls could happen tuesday, and im also excited about a lot of potential shorts of equity in the index. im just as excited about going long around emas and trendlines holding bull in the overall index. using fib im aiming for bear weekly highs as well as the 1 and the 1.618 as long as we are beating the regressive bottom and accute trend angle.

maybe uranium becomes an epic short againthe bull market turn around in uranium has made the news, and outlasted a broader energy sector comeback. technicals are threatening a reversal bac to bears, and the monthly-quarterly view is making a breakdown. if we maintain these resistances then i am betting on a massive short play in uranium in a 5 year daterange. short urnm and long ery on breakouts on down days in broader market.

NVIDIA and AMD Are Breaking Important Bullish LevelsAMD and Nvidia stocks are breaking higher this week, possibly ready for more gains as the recent corrective pullback to 140 and 60 USD appears completed. More upside here can be positive for cryptos about I talked in our webinar this Monday, here on tradingview.
Grega
I put link below if anyone is interested in recording.
www.tradingview.com

Daily Sector Watch : Will Eutelsat Communications recover?Our 2 leading sectors are Crypto and Space at the moment. While Weed stocks have not shown any sign of recovery yet.
Todays stock pick is ETCMY , a space stock that has been underperforming the rest of the sector for a while and is stuck at a support area.
Let's compare the index to the stock:
Index:
Stock:
Below a closer look at the 5 sectors. Bright color means bullish activity on a stock.
🟢WEED STOCKS TOP 10
Teradyne
Curaleaf Holdings
Green Thumb Industries
Trulieve Cannabis Corp
Canopy Growth Corp
Verano Holdings Corp
Cronos Group Inc
Tilray Brands Inc
Cresco Labs Inc
SNDL Inc
🔴CRYPTO COINS TOP 10
Bitcoin
Ethereum
Binance Coin
XRP
Dogecoin
ADA
Matic
Tron
Dot
Solana
🟣INDEXES
US30
S&P 500
FRA40
GER30
NTH25
ASX200
EUSTX50
JPN225
HK50
Banknifty
🔵SPACE STOCKS TOP 10
Iridium Communications Inc
Ses
Rocket Lab USA Inc
Aerojet Rocketdyne Holdings Inc
Viasat
Maxar Technologies
Eutelsat Communications
Astra Space Inc
Sats
Planet Labs
🟤RETAIL FOOD STOCKS TOP 10
Kroger Company
Albertsons Company
Sendas Distribiduira S A
Sprouts Farmers Market
Grocery Outlet Holdings
Weis Market Inc
Ingles Markets Inc
Arko Corp
Companhia Brasileira De Distribuidao American
Beyond Meat

defensive sectors acting bullish dailyim not aurprised to see a bullish daily move from a defensive sectir in a bear market ending bull rebound. i think utilities are particularly good at catching this movement. this is a good etf to do that with.
