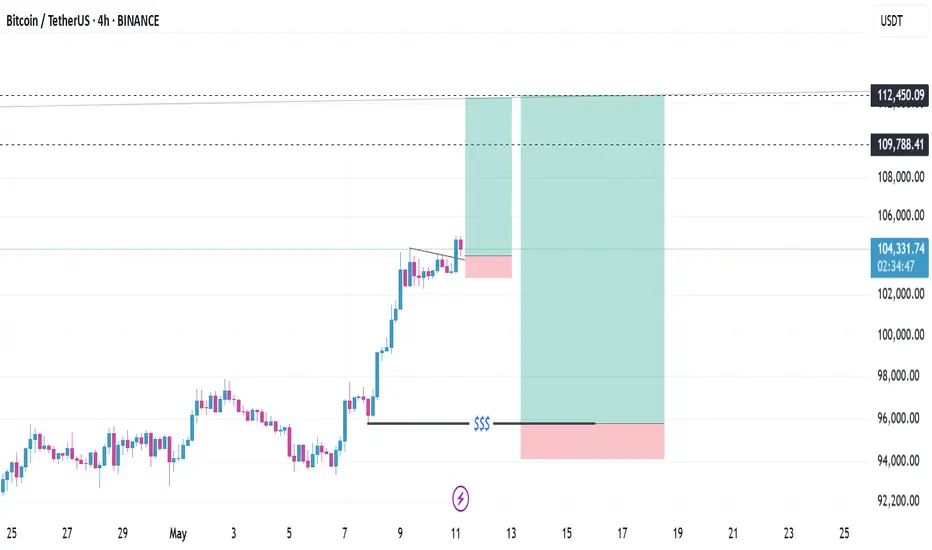
BTC is heading towards 109-112With this idea we can buy the smallest possible volume to probe, because the current price is at the 2.618 profit level. If the price goes up, we will also make profit with a small volume of buying. I still prefer the price to return to where it started to increase, take all the liquidity and then increase strongly, however this is unlikely but not impossible.
Shark
A potential "shark dive" in silver price.A potential "shark dive" in silver prices, referring to a sudden and sharp price decline, is being speculated, with projections indicating a possible drop from $33 to $32 per ounce. This scenario suggests a rapid and possibly unexpected sell-off, leading to downward pressure on the price of silver.

USOIL Bullish Shark PatternBased on harmonic Shark pattern analysis, the potential future trajectory of oil prices suggests an upward trend, initiated by a "Shark Dive" reversal pattern from the $54 level.
This indicates a likely bullish continuation contingent upon confirmation of the pattern's validity through subsequent price action.

Bearish Shark Pattern with a Massive Profit FactorThis is how trading should be done . I've just spotted a Bearish Shark Pattern on the Weekly Chart and while it's not perfect, it's still a great trade worth keeping on the radar. The market has been hovering around the entry price for weeks, which tells me something is brewing.
The Smart Approach:
Now, I’m not entering based on the Weekly Chart alone , that would require a stop-loss that’s way too wide. Instead, I look for an execution timeframe within three levels down. That means the lowest timeframe I’d engage from this setup is the 4-hourly chart .
But here’s the twist...
The Trade Setup:
I spotted another Bearish Shark Pattern on the 15-minute chart.
What did I do?
> I traded what I saw. Simple as that.
It’s not always about having the "perfect" timeframe. It’s about:
Seeing a valid setup
Knowing your structure
And having a clear trade management plan.
Key Rule:
Once the market reaches a certain level, I’ll shift my stop to entry, securing a risk-free trade. That’s always the goal.
Golden Rule in Trading: “Don’t lose your capital.”
The Reward:
If this trade hits my final target, I’ll walk away with a Profit Factor of 27.45 .
That means for every dollar I risk, the projected return is $27.45. Let that sink in.
So now the question is - how much of your equity would you be risking on a trade like this? Would you go big, or stick to your usual risk percentage?
Let me know in the comments, how would you manage this kind of high-reward setup?
Stay sharp and happy trading, everyone! 🚀

Visit the Harmonic Museum in the Warren Diamond BuildingThe Diamond Glass Building, home to the Warren Buffett Harmonic Museum, is truly a sight to behold! As you enter, you'll find a fascinating display of creatures.
On the left, there's a charming exhibit featuring a crab vendor that catches the eye.
In the center of the hall, you can marvel at the wild bat, a remarkable fossil that tells a story of the past.
To the right, however, is where things get exciting—a live bloodthirsty shark!
While the crab and bat have been fossilized, the shark is very alive, so be sure to keep your distance and enjoy the view and trade safely.

Tata Motors - Short term target - 850 to 900Tata Motors has formed Shark pattern confirmation.
Based on Fib targets it will have resistance at 850 to 900.
In short term it will have potential to reach 900 with following targets,
700 / 750 / 780 / 820 / 860 & 900.
2 Weekly candle close above 900 will have further potential upside.

Are We Witnessing A WHALE Diving Expedition?Get ready to buckle up and prepare for an exhilarating ride, because the Bitcoin seas are getting choppy!
Whispers are circulating,
theories are bubbling, and everyone's glued to their screens as we potentially witness something HUGE:
Bitcoin whales might be prepping for a deep-sea dive, potentially pulling the price down from a hypothetical high of 96,000 to the depths of 66,000 and even $55,000...
and Whales might be taking their sweet, strategic time about it!

BTC Elliott wave analysis 5/3/2025For me , I think the Wave B of the Big 4 is already finished as you can see the clear divergence in 4 hours timeflame and the small wave count is also confirm that the end of wave be should be finish and Wave C is ready to coming down. Since the wave B retraced in the range of 0.618 - 0.8 (weak B) we expect the target for the end of wave C is around 1.272 - 1.382 of wave A (B-Failure flat) or around 68000- 65000.Surpisingly , the price target that we get is the same level as the huge suppot zone in 2024 making the 68000- 65000 target price more likely to be the end of C wave. But we should also think of the alternate scenario that the Big wave 4 is already end in WXYXZ (in the wave A) and the upcoming wave 5 (wave B)is already coming up and hit the resistance and waiting to go higher.

Fear @ Greed Index In Nasdaq.The potential future decline of the Nasdaq index is attributed to concerns surrounding the Fibonacci level of 1.138, as indicated by the harmonic shark pattern .
At the 0.88 level, the fear index has surpassed the greed index, and it currently stands at 1.138. This apprehension is also affecting those who are typically driven by greed.

Cattle Shark leaps to 192 before diving deep.Hi everyone!
Here's a more concise version of the cattle price history:
1. 1960s and Earlier:
Before the introduction of live cattle futures in 1964 by the Chicago Mercantile Exchange (CME), prices were influenced by local supply-demand conditions and seasonal factors.
2. 1970s:
Prices rose due to inflation and higher feed costs, reaching around $50 per cwt (hundredweight).
3. 1980s:
During the farm crisis, prices fluctuated between $60-$70 per cwt, impacted by high-interest rates and falling demand.
4. 1990s:
Prices ranged between $65-$80 per cwt, with cyclical booms and busts, including concerns over Mad Cow Disease.
5. 2000s:
After a 2003 Mad Cow Disease outbreak, prices dropped temporarily but recovered, reaching over $90 per cwt by the mid-2000s.
6. 2010s:
Due to droughts reducing cattle herds, prices hit record highs, exceeding $170 per cwt in 2014, before dropping as herds were rebuilt.
7. 2020s:
The COVID-19 pandemic initially caused disruptions, but prices recovered to $120-$140 per cwt in 2021. By 2023, prices were consistently above $160-$170 per cwt, driven by strong demand and rising input costs.
In 2024 ,Cattle prices have been cyclical, responding to changes in supply, weather conditions, global trade, and consumer demand . cattle prices are expected to rise further, potentially reaching $192 per cwt, driven by continuing strong demand and supply constraints and his chart shows technical analysis for Live Cattle Futures and focus on a bearish shark pattern, which is a type of harmonic pattern used to predict potential market reversals.
Fibonacci retracement levels are visible, showing common retracement ratios such as 0.382, 0.5, 0.886, and 1.13 (which is the upper boundary of this pattern).
The points X, A, B, C, and D are the important pivot points for the shark pattern.
Point D, at around 1.92, represents the potential completion of the pattern where a reversal could occur. It lies near the Fibonacci extension levels of 0.886 and 1.13, which are important levels for the bearish shark pattern.
The candlestick patterns forming in the coming weeks will influence the price trend anticipated for 2025.
I'm eager to read your insights in the comments, friends.
SEYED.

BTC Elliott wave Analysis 23/4/2025I think we have close to the End of the big B wave that is the part of the the wave 4 (Start from Nov 2022 crash).We Should see a clear Divergence soon in big time frame like 2 , 4 Hours to confirm that the pivot has come.For me I think the target price that is the pivot point is around 96000-97000 since bearish shark pattern harmonic and Gann fan suggest us.

Market Insight: VIX Index WatchHold onto your life jackets, folks! The volatility index (a.k.a. the Shark VIX) has emerged from the depths at a slippery 0.88 and is now eyeing the ominous 1.138! 📈💔
Why does that matter? Well, if it's anything like a shark spotting in the ocean, it usually means it’s about to get choppy! 🦈💥 Expect some serious splashes ahead as we ride these market waves!
So, if you prefer calm seas over shark-infested waters, it might be time to brace yourself for a fun (read: bumpy) ride! 🎢 Don’t worry; we’ll keep the floaties handy!
Swim smart, invest wisely! 🌊💸**

Bitcoin (BTC/USD) Reversal? Rising Wedge Breakdown Signals Sell! The chart suggests a potential bearish move after a rising wedge pattern breakdown.
Key Observations:
Rising Wedge Breakdown:
BTC formed a rising wedge, which is a bearish reversal pattern.
The price has broken down from this wedge, indicating a potential downtrend.
Support and Resistance Levels:
Resistance Zone: Around $88,188 – $88,792, marked as a key level where selling pressure may increase.
Support Zone: Around $85,368 – $84,226, where buyers may step in.
Target: $81,429 – $81,258, a strong support level where price could drop.
Bearish Setup:
The chart suggests a sell opportunity near resistance, expecting a downward move toward the target zone.
Trading Idea:
Entry: Sell near $88,000 after confirmation.
Target: $81,429 – $81,258 (support zone).
Stop-Loss: Above $89,991 (resistance zone).
This setup suggests Bitcoin could decline further, making it a potential short trade opportunity. However, traders should watch for confirmation and overall market sentiment before executing trades.

GOLD: What to do if you Hold a Short position?Gold is rebounding. Pay attention to the resistance above 3020. At present, we can see obvious selling pressure on the 2H chart. MACD has formed a divergence. 2H is a larger period. Its form is short, which means that tomorrow or the day after tomorrow, the market will fall sharply.
In addition, the divergence of MACD is sometimes repaired by shock market. This situation is not uncommon, so when trading, we need to focus on the support.
Judging from the current candlestick chart arrangement, there is support near 3100, followed by the 3096-3088 range. If a larger divergence pattern is to be formed, the price may reach the 3036-3048 range. At that time, there is no need to hesitate too much, just sell it.

GBP/USD Breakdown – Bearish Momentum Ahead?This 4-hour chart of GBP/USD shows a clear bearish setup:
🔹 Rising Wedge Breakdown – The pair has broken below a rising wedge pattern, signaling potential downside pressure.
🔹 Support and Resistance Levels –
Resistance at 1.29206 - 1.30275
Support at 1.28000 - 1.28437
Strong support at 1.27539
🔹 Sell Confirmation – A sell signal is indicated, suggesting further downside movement towards the target zone.
📉 Trading Plan:
✅ Possible short entries below the 1.28956 level.
✅ Target price: 1.27539
✅ Stop-loss above 1.29206 for risk management.
⚠️ Risk Note: Always manage risk properly and watch for any trend reversals before entering trades.
What are your thoughts? Are you bearish or bullish on GBP/USD? 🤔💬

USD/JPY 4H Analysis – Potential Bearish RetestThe USD/JPY pair has been in a clear downtrend, trading within a descending channel for an extended period. Recently, price action has broken above the channel, but it is now facing resistance around the 150.35 level.
Retest Zone: The pair is currently retesting the broken trendline, and if it fails to sustain above this level, a rejection could lead to further downside.
Bearish Expectation: If the price fails to reclaim 150.35, a move towards the 147.00 support zone is likely.
Confirmation: A strong bearish candle from this level could indicate a reversal, confirming the downward move.
Traders should watch for price action signals at the retest level before making decisions.

Ethereum (ETH/USD) Bullish Breakout – Eyes on $2,500+ Target 📈 Chart Overview:
Timeframe: 4H (Ethereum/USDT)
Trend Reversal: Ethereum has broken out of a falling wedge pattern, indicating a shift from bearish to bullish momentum.
Support Level: Around $1,800 - $1,900, where price previously found strong buying interest.
Retest Confirmation: ETH successfully retested the breakout level (~$2,020), confirming a potential bullish continuation.
Resistance Zone: The next key resistance area is around $2,250, followed by a potential move towards the $2,530 - $2,550 target zone.
📊 Trade Setup:
Bullish Bias: Price action suggests an upward move towards $2,250 and potentially $2,530.
Risk Management: A stop-loss can be set below $2,020 to minimize downside risk.
🔥 Conclusion: If Ethereum maintains momentum above the retest zone, it could see a strong rally in the coming days! 🚀

This is a 4-hour chart of Bitcoin (BTC/USD)This is a 4-hour chart of Bitcoin (BTC/USD) showing a key resistance level around $86,527 and a potential bearish move towards lower support zones.
Analysis:
Price is currently trading near the resistance zone, struggling to break above it.
A sell setup is suggested, expecting rejection from resistance.
The first target is around $78,500, with an extended downside target at $75,869 and possibly $71,580 if momentum continues.
A stop-loss level is placed above resistance at $86,527, indicating a risk management strategy.
The overall structure suggests bearish sentiment unless price breaks above resistance.
Potential Trading Plan:
📉 Bearish Scenario:
Short below resistance confirmation.
Targets at $78,500, $75,869, and $71,580.
Stop-loss above $86,527.
📈 Bullish Scenario:
A break and close above $86,527 could invalidate the bearish setup.

Pepe - Internal Bullish & External Bearish Gartley - 11/03/2025Fistly, the only harmonis I can find that extends so far on C or D is shark harmonic. Not sure if these are actually valid however, I'm finding them useful to guage on fib retracements at very least!
Internal Gartley in Red - Target A - Mediumm term
External Gartley in Blue - Target D (Best case) at 1.618. Taking us to those evil 3 peaks!
Given these analysis on BTC and Futures, I'm pro bullish.
Just an idea. Happy trading. :)

GBP/USD 15-Minute Chart: Bearish Reversal at Harmonic CompletionThe chart showcases a well-defined harmonic pattern, the Shark, with the price reaching the terminal zone at 1.2670 , marked by a red downward triangle. This suggests a potential reversal zone where selling pressure may emerge.
Key observations:
The price has reacted strongly at the completion point, aligning with Fibonacci extensions.
Overbought conditions are evident in the RSI and other momentum indicators, indicating potential exhaustion of the bullish trend.
Target levels:
T1: 1.26241
T2: 1.25741
Suggests a possible downside move if the reversal confirms.
Traders should watch for bearish confirmation before entering short positions, while bulls may seek a break above 1.2670 for further upside.

Reliance next levels to followReliance in the direction to form Cypher or shark pattern.
Next levels to watch 1217 / 1210 / 1160

IRCTC - Forming Cypher / Shark IRCTC - Forming Cypher / Shark it has potential to to go to below levels.
765 / 740 / 693 / 660

MCX possible to reach up to 4500 - To form Cypher / SharkMCX is on the verge to form Cypher / Shark with following targets possible
5400 - 5200 (200 EMA) - 4800 - 4700
In worst case it can go up to 4500 / 4200
Consider 5800 or 20 EMA is resistance / SL.
