US30 Will Move Lower! Sell!
Here is our detailed technical review for US30.
Time Frame: 9h
Current Trend: Bearish
Sentiment: Overbought (based on 7-period RSI)
Forecast: Bearish
The market is trading around a solid horizontal structure 47,967.2.
The above observations make me that the market will inevitably achieve 46,950.2 level.
P.S
We determine oversold/overbought condition with RSI indicator.
When it drops below 30 - the market is considered to be oversold.
When it bounces above 70 - the market is considered to be overbought.
Like and subscribe and comment my ideas if you enjoy them!
Short!!!!

NZDUSD Is Bearish! Short!
Take a look at our analysis for NZDUSD.
Time Frame: 7h
Current Trend: Bearish
Sentiment: Overbought (based on 7-period RSI)
Forecast: Bearish
The market is testing a major horizontal structure 0.577.
Taking into consideration the structure & trend analysis, I believe that the market will reach 0.569 level soon.
P.S
Overbought describes a period of time where there has been a significant and consistent upward move in price over a period of time without much pullback.
Like and subscribe and comment my ideas if you enjoy them!

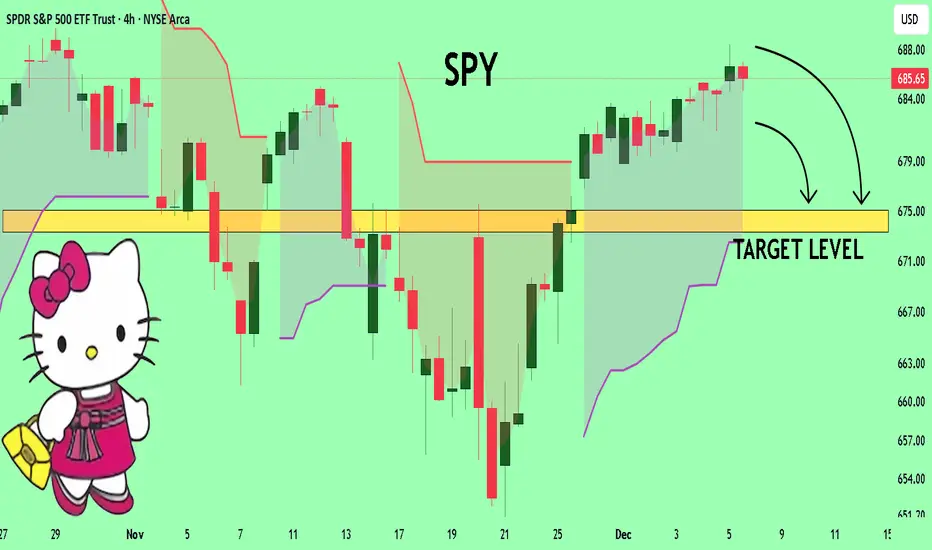
SPY SELLERS WILL DOMINATE THE MARKET|SHORT
SPY SIGNAL
Trade Direction: short
Entry Level: 685.68
Target Level: 671.00
Stop Loss: 695.40
RISK PROFILE
Risk level: medium
Suggested risk: 1%
Timeframe: 9h
Disclosure: I am part of Trade Nation's Influencer program and receive a monthly fee for using their TradingView charts in my analysis.
✅LIKE AND COMMENT MY IDEAS✅

GBP/USD BEARISH BIAS RIGHT NOW| SHORT
Hello, Friends!
GBP/USD is making a bullish rebound on the 8H TF and is nearing the resistance line above while we are generally bearish biased on the pair due to our previous 1W candle analysis, thus making a trend-following short a good option for us with the target being the 1.323 level.
Disclosure: I am part of Trade Nation's Influencer program and receive a monthly fee for using their TradingView charts in my analysis.
✅LIKE AND COMMENT MY IDEAS✅

TESLA: Weak Market & Bearish Forecast
Remember that we can not, and should not impose our will on the market but rather listen to its whims and make profit by following it. And thus shall be done today on the TESLA pair which is likely to be pushed down by the bears so we will sell!
Disclosure: I am part of Trade Nation's Influencer program and receive a monthly fee for using their TradingView charts in my analysis.
❤️ Please, support our work with like & comment! ❤️

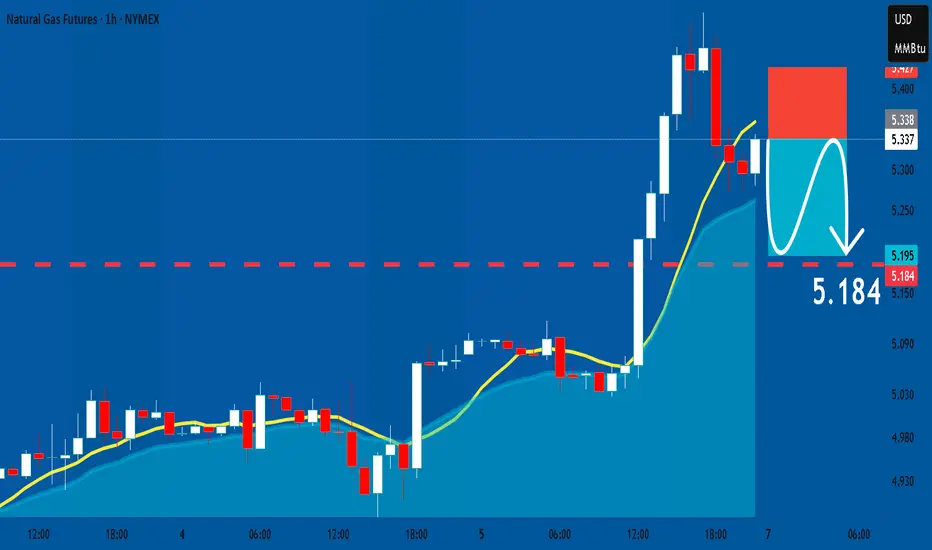
NATGAS: Short Signal with Entry/SL/TP
NATGAS
- Classic bearish formation
- Our team expects fall
SUGGESTED TRADE:
Swing Trade
Sell NATGAS
Entry Level - 5.338
Sl - 5.427
Tp - 5.184
Our Risk - 1%
Start protection of your profits from lower levels
Disclosure: I am part of Trade Nation's Influencer program and receive a monthly fee for using their TradingView charts in my analysis.
❤️ Please, support our work with like & comment! ❤️
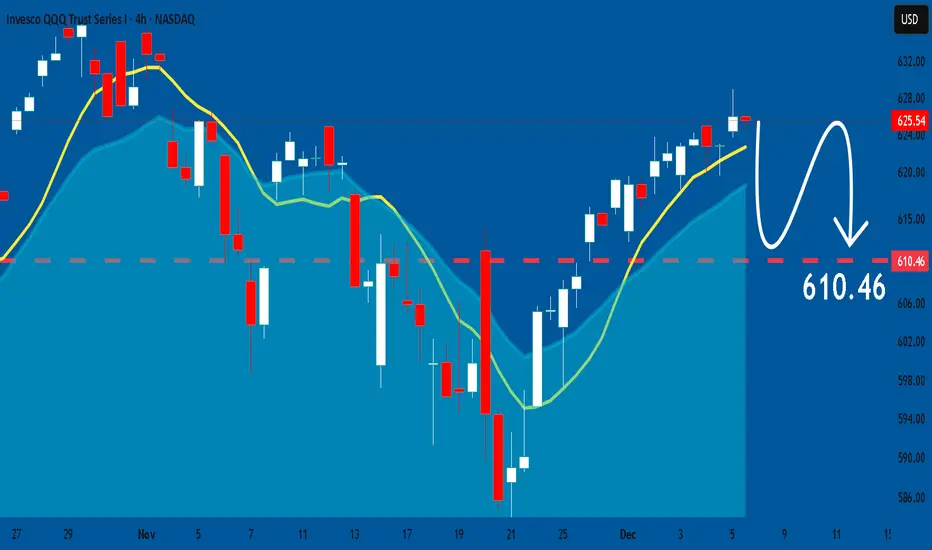
QQQ: Price Action & Swing Analysis
Balance of buyers and sellers on the QQQ pair, that is best felt when all the timeframes are analyzed properly is shifting in favor of the sellers, therefore is it only natural that we go short on the pair.
Disclosure: I am part of Trade Nation's Influencer program and receive a monthly fee for using their TradingView charts in my analysis.
❤️ Please, support our work with like & comment! ❤️
SILVER My Opinion! SELL!
My dear followers,
I analysed this chart on SILVER and concluded the following:
The market is trading on 58.349 pivot level.
Bias - Bearish
Technical Indicators: Both Super Trend & Pivot HL indicate a highly probable Bearish continuation.
Target - 57.776
Safe Stop Loss - 58.724
About Used Indicators:
A super-trend indicator is plotted on either above or below the closing price to signal a buy or sell. The indicator changes color, based on whether or not you should be buying. If the super-trend indicator moves below the closing price, the indicator turns green, and it signals an entry point or points to buy.
Disclosure: I am part of Trade Nation's Influencer program and receive a monthly fee for using their TradingView charts in my analysis.
———————————
WISH YOU ALL LUCK

SPY Set To Fall! SELL!
My dear followers,
I analysed this chart on SPY and concluded the following:
The market is trading on 685.65 pivot level.
Bias - Bearish
Technical Indicators: Both Super Trend & Pivot HL indicate a highly probable Bearish continuation.
Target - 675.10
About Used Indicators:
A super-trend indicator is plotted on either above or below the closing price to signal a buy or sell. The indicator changes color, based on whether or not you should be buying. If the super-trend indicator moves below the closing price, the indicator turns green, and it signals an entry point or points to buy.
Disclosure: I am part of Trade Nation's Influencer program and receive a monthly fee for using their TradingView charts in my analysis.
———————————
WISH YOU ALL LUCK
USOIL Will Collapse! SELL!
My dear friends,
USOIL looks like it will make a good move, and here are the details:
The market is trading on 60.13 pivot level.
Bias - Bearish
Technical Indicators: Supper Trend generates a clear short signal while Pivot Point HL is currently determining the overall Bearish trend of the market.
Goal - 59.69
Recommended Stop Loss - 60.41
About Used Indicators:
Pivot points are a great way to identify areas of support and resistance, but they work best when combined with other kinds of technical analysis
Disclosure: I am part of Trade Nation's Influencer program and receive a monthly fee for using their TradingView charts in my analysis.
———————————
WISH YOU ALL LUCK

GOLD Is Very Bearish! Sell!
Please, check our technical outlook for GOLD.
Time Frame: 9h
Current Trend: Bearish
Sentiment: Overbought (based on 7-period RSI)
Forecast: Bearish
The market is approaching a key horizontal level 4,198.77.
Considering the today's price action, probabilities will be high to see a movement to 4,117.75.
P.S
Please, note that an oversold/overbought condition can last for a long time, and therefore being oversold/overbought doesn't mean a price rally will come soon, or at all.
Like and subscribe and comment my ideas if you enjoy them!

EURUSD Is Going Down! Sell!
Here is our detailed technical review for EURUSD.
Time Frame: 8h
Current Trend: Bearish
Sentiment: Overbought (based on 7-period RSI)
Forecast: Bearish
The market is approaching a significant resistance area 1.164.
Due to the fact that we see a positive bearish reaction from the underlined area, I strongly believe that sellers will manage to push the price all the way down to 1.160 level.
P.S
The term oversold refers to a condition where an asset has traded lower in price and has the potential for a price bounce.
Overbought refers to market scenarios where the instrument is traded considerably higher than its fair value. Overvaluation is caused by market sentiments when there is positive news.
Like and subscribe and comment my ideas if you enjoy them!

USOIL BEST PLACE TO SELL FROM|SHORT
USOIL SIGNAL
Trade Direction: short
Entry Level: 60.11
Target Level: 57.09
Stop Loss: 62.12
RISK PROFILE
Risk level: medium
Suggested risk: 1%
Timeframe: 1D
Disclosure: I am part of Trade Nation's Influencer program and receive a monthly fee for using their TradingView charts in my analysis.
✅LIKE AND COMMENT MY IDEAS✅

GBP/CAD BEST PLACE TO SELL FROM|SHORT
GBP/CAD SIGNAL
Trade Direction: short
Entry Level: 1.864
Target Level: 1.855
Stop Loss: 1.871
RISK PROFILE
Risk level: medium
Suggested risk: 1%
Timeframe: 1h
Disclosure: I am part of Trade Nation's Influencer program and receive a monthly fee for using their TradingView charts in my analysis.
✅LIKE AND COMMENT MY IDEAS✅

BITCOIN BEARISH BIAS RIGHT NOW| SHORT
Hello, Friends!
BITCOIN pair is trading in a local downtrend which know by looking at the previous 1W candle which is red. On the 4H timeframe the pair is going up. The pair is overbought because the price is close to the upper band of the BB indicator. So we are looking to sell the pair with the upper BB line acting as resistance. The next target is 89,196.10 area.
Disclosure: I am part of Trade Nation's Influencer program and receive a monthly fee for using their TradingView charts in my analysis.
✅LIKE AND COMMENT MY IDEAS✅

AUDNZD: Expecting Bearish Continuation! Here is Why:
The charts are full of distraction, disturbance and are a graveyard of fear and greed which shall not cloud our judgement on the current state of affairs in the AUDNZD pair price action which suggests a high likelihood of a coming move down.
Disclosure: I am part of Trade Nation's Influencer program and receive a monthly fee for using their TradingView charts in my analysis.
❤️ Please, support our work with like & comment! ❤️

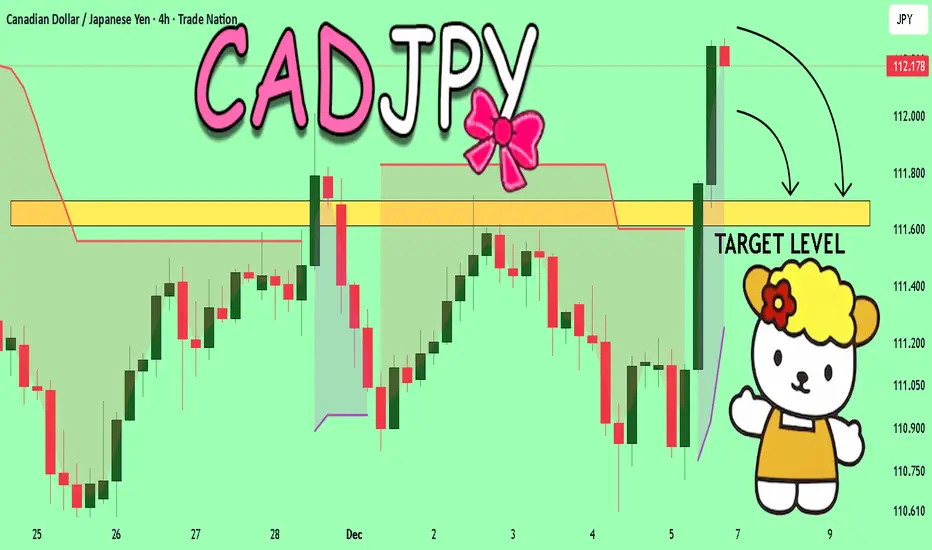
CADJPY The Target Is DOWN! SELL!
My dear friends,
CADJPY looks like it will make a good move, and here are the details:
The market is trading on 112.19 pivot level.
Bias - Bearish
Technical Indicators: Supper Trend generates a clear short signal while Pivot Point HL is currently determining the overall Bearish trend of the market.
Goal - 111.69
About Used Indicators:
Pivot points are a great way to identify areas of support and resistance, but they work best when combined with other kinds of technical analysis
Disclosure: I am part of Trade Nation's Influencer program and receive a monthly fee for using their TradingView charts in my analysis.
———————————
WISH YOU ALL LUCK
EURGBP Set To Fall! SELL!
My dear subscribers,
My technical analysis for EURGBP is below:
The price is coiling around a solid key level - 0.8786
Bias - Bearish
Technical Indicators: Pivot Points Low anticipates a potential price reversal.
Super trend shows a clear sell, giving a perfect indicators' convergence.
Goal - 0.8764
About Used Indicators:
By the very nature of the supertrend indicator, it offers firm support and resistance levels for traders to enter and exit trades. Additionally, it also provides signals for setting stop losses
Disclosure: I am part of Trade Nation's Influencer program and receive a monthly fee for using their TradingView charts in my analysis.
———————————
WISH YOU ALL LUCK

CVNA - Let's do it againA short squeeze to the upside, right up to the center line. This is exactly where I like price to be.
For one, it’s the 80% target; and secondly, price has to make a decision at this equilibrium level.
If I see any weakness below the center line, I’ll hit it on the head again. §8-)
🔱 Happy trading, folks. 🔱

GBPJPY: Bearish Forecast & Outlook
The price of GBPJPY will most likely collapse soon enough, due to the supply beginning to exceed demand which we can see by looking at the chart of the pair.
Disclosure: I am part of Trade Nation's Influencer program and receive a monthly fee for using their TradingView charts in my analysis.
❤️ Please, support our work with like & comment! ❤️

GOLD: Short Trade with Entry/SL/TP
GOLD
- Classic bearish formation
- Our team expects pullback
SUGGESTED TRADE:
Swing Trade
Short GOLD
Entry - 4234.9
Sl - 4245.4
Tp - 4216.4
Our Risk - 1%
Start protection of your profits from lower levels
Disclosure: I am part of Trade Nation's Influencer program and receive a monthly fee for using their TradingView charts in my analysis.
❤️ Please, support our work with like & comment! ❤️

NZDJPY Buyers In Panic! SELL!
My dear friends,
Please, find my technical outlook for NZDJPY below:
The instrument tests an important psychological level 89.694
Bias - Bearish
Technical Indicators: Supper Trend gives a precise Bearish signal, while Pivot Point HL predicts price changes and potential reversals in the market.
Target - 89.517
Recommended Stop Loss - 89.787
About Used Indicators:
Super-trend indicator is more useful in trending markets where there are clear uptrends and downtrends in price.
Disclosure: I am part of Trade Nation's Influencer program and receive a monthly fee for using their TradingView charts in my analysis.
———————————
WISH YOU ALL LUCK

H&S Scenario on 4H | Jobless Claims could decideFX_IDC:XAUUSD H&S SCENARIO
Until Thursday morning, trader sentiment about another rate cut was around 80%-90% in favor, but the sentiment on the Gold price since the beginning of the week has been highly undecided 🤔 due to several economic data releases which were not strong enough to give Gold a clear direction.
Data: ( Actual | Forcasted | Previous)
Monday, December 1, 2025 🗓️
S&P Global Manufacturing PMI (Nov) 52.2 | 51.9 | 52.5 ⬆️
ISM Manufacturing PMI (Nov) 48.2 | 49.0 |48.7 ⬇️
ISM Manufacturing Prices (Nov) 58.5 | 59.5 | 58.0 ⬇️
Fed Chair Powell's speech omitted any important mentions of economic conditions or the rate cut process, focusing instead on the political processes surrounding the selection of a new Chair. 🏛️
Tuesday, December 2, 2025
CPI (YoY) (Nov) 2.2% | 2.1% |2.1% ⬆️
Wednesday, December 3, 2025
ADP Nonfarm Employment Change (Nov) -32K | 5K | 47K ⬆️
S&P Global Services PMI (Nov) 54.1 | 55.0 | 54.8 ⬇️
ISM Non-Manufacturing PMI (Nov) 52.6 | 52.0 |52.4 ⬆️
ISM Non-Manufacturing Prices (Nov) 65.4 | 68.0 | 70.0 ⬇️
U.S. President Trump Spokes about drugs and car costs mostly 🗣️
If the Gold price continues to decline past $4225 and reaches the Neckline support at around $4174 - $4179, then a further drop could send the price breaking through the Neckline and Gold could drop primarily to $4110, and secondarily down to the $4070 to $4020 mark. 📉
The Initial Jobless Claims announcement at 8:30 AM ET on Thursday, December 4, is expected to determine the next step for Gold and potentially provide a clear direction. 📰
If the actual Initial Jobless Claims figure is higher than expected, this could push Gold back toward the $4250 resistance level. ⬆️ Conversely, if the figure is lower, I anticipate the price will either fall or continue to trade sideways in the $4186 - $4225 range. ⬇️ ⚖️
The Initial Jobless Claims data may be ineffective in driving Gold's price due to the significant economic data releases scheduled for Friday, December 5. ⚠️
Core PCE Price Index (MoM) (Sep)
Core PCE Price Index (YoY) (Sep)
The technical analysis regarding the Head and Shoulders (H&S) pattern is primarily a trader-driven sentiment result. While it typically acts as a reversal signal following a recent uptrend, the pattern on higher time frames (such as the 4-hour chart) does not always offer a clear direction, and the price does not consistently follow its implications. Keep this in mind and monitor economic data releases closely.
My bias remains bearish until a clear market shift occurs.
Buy for Sell: $4200 - $4215
Late entry could be $4179 when Initial Jobless Claims look good.
Stop Loss: $4230
TP 1: $4167
TP 2: $4153
TP 2: $4116
TP 3: $4070
-------------------------------------------------------------------------
This is just my personal market idea and not financial advice! 📢 Trading gold and other financial instruments carries risks – only invest what you can afford to lose. Always do your own analysis, use solid risk management, and trade responsibly.
Good luck and safe trading! 🚀📊
