EURUSD Will Fall! Short!
Take a look at our analysis for EURUSD.
Time Frame: 1D
Current Trend: Bearish
Sentiment: Overbought (based on 7-period RSI)
Forecast: Bearish
The market is approaching a key horizontal level 1.174.
Considering the today's price action, probabilities will be high to see a movement to 1.158.
P.S
Overbought describes a period of time where there has been a significant and consistent upward move in price over a period of time without much pullback.
Like and subscribe and comment my ideas if you enjoy them!
Short

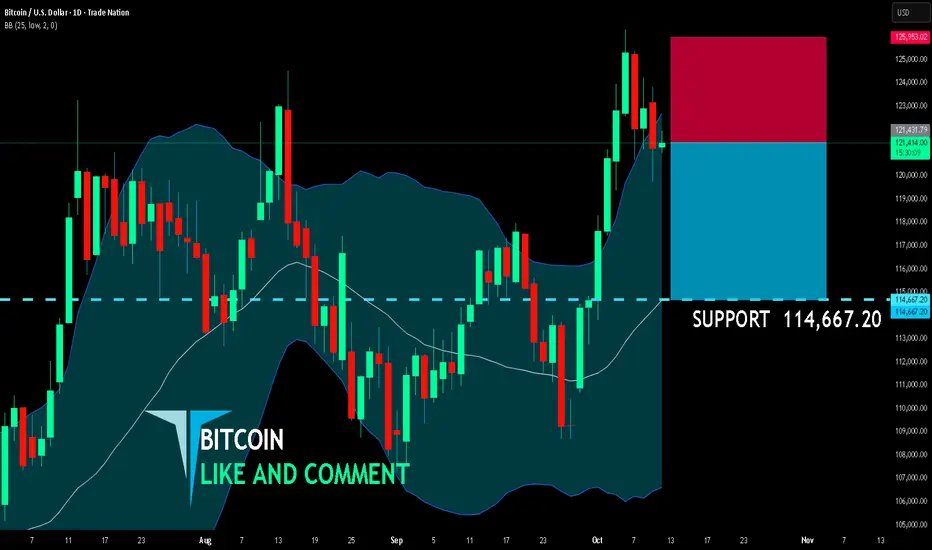
BITCOIN SENDS CLEAR BEARISH SIGNALS|SHORT
BITCOIN SIGNAL
Trade Direction: short
Entry Level: 121,431.79
Target Level: 114,667.20
Stop Loss: 125,953.02
RISK PROFILE
Risk level: medium
Suggested risk: 1%
Timeframe: 1D
Disclosure: I am part of Trade Nation's Influencer program and receive a monthly fee for using their TradingView charts in my analysis.
✅LIKE AND COMMENT MY IDEAS✅
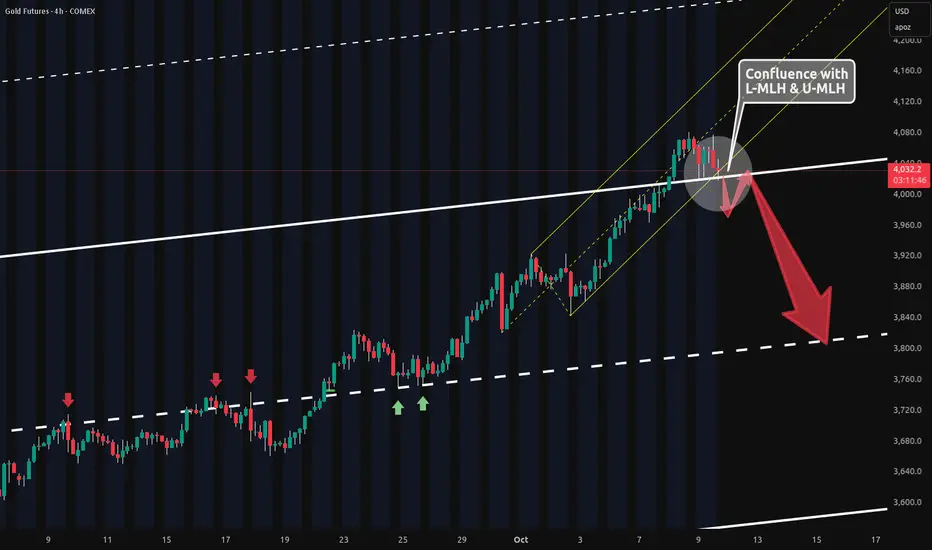
Gold 4h Potential Short Confluence🔱 Just wanted to highlight this confluence 🔱
The yellow L-MLH and white U-MLH are lining up to form a potential short setup.
Today’s selling pressure is also giving an early warning signal.
If we open and close below the white U-MLH, we’ll likely retest it before any major drop.
Shorting this move will require a decent stop, given the inherent volatility. So maybe a play with an Options Strategy would be a more secure way.
Let’s see if the party finally takes a breather.
GOLD Technical Analysis! SELL!
My dear subscribers,
GOLD looks like it will make a good move, and here are the details:
The market is trading on 4039.4 pivot level.
Bias - Bearish
My Stop Loss - 4047.6
Technical Indicators: Both Super Trend & Pivot HL indicate a highly probable Bearish continuation.
Target - 4026.3
About Used Indicators:
The average true range (ATR) plays an important role in 'Supertrend' as the indicator uses ATR to calculate its value. The ATR indicator signals the degree of price volatility.
Disclosure: I am part of Trade Nation's Influencer program and receive a monthly fee for using their TradingView charts in my analysis.
———————————
WISH YOU ALL LUCK

SILVER Will Go Lower From Resistance! Sell!
Here is our detailed technical review for SILVER.
Time Frame: 4h
Current Trend: Bearish
Sentiment: Overbought (based on 7-period RSI)
Forecast: Bearish
The market is on a crucial zone of supply 4,932.1.
The above-mentioned technicals clearly indicate the dominance of sellers on the market. I recommend shorting the instrument, aiming at 4,773.8 level.
P.S
Overbought describes a period of time where there has been a significant and consistent upward move in price over a period of time without much pullback.
Like and subscribe and comment my ideas if you enjoy them!

GOLD BEST PLACE TO SELL FROM|SHORT
GOLD SIGNAL
Trade Direction: short
Entry Level: 4,035.38
Target Level: 3,914.49
Stop Loss: 4,115.72
RISK PROFILE
Risk level: medium
Suggested risk: 1%
Timeframe: 6h
Disclosure: I am part of Trade Nation's Influencer program and receive a monthly fee for using their TradingView charts in my analysis.
✅LIKE AND COMMENT MY IDEAS✅

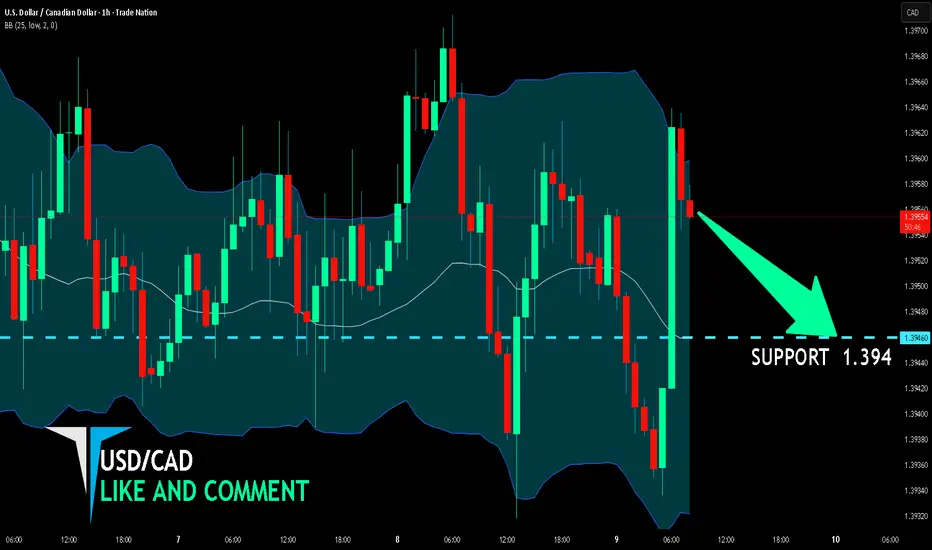
USD/CAD BEARS WILL DOMINATE THE MARKET|SHORT
Hello, Friends!
We are going short on the USD/CAD with the target of 1.394 level, because the pair is overbought and will soon hit the resistance line above. We deduced the overbought condition from the price being near to the upper BB band. However, we should use low risk here because the 1W TF is green and gives us a counter-signal.
Disclosure: I am part of Trade Nation's Influencer program and receive a monthly fee for using their TradingView charts in my analysis.
✅LIKE AND COMMENT MY IDEAS✅
GBP/AUD BEARS ARE STRONG HERE|SHORT
Hello, Friends!
We are going short on the GBP/AUD with the target of 2.029 level, because the pair is overbought and will soon hit the resistance line above. We deduced the overbought condition from the price being near to the upper BB band. However, we should use low risk here because the 1W TF is green and gives us a counter-signal.
Disclosure: I am part of Trade Nation's Influencer program and receive a monthly fee for using their TradingView charts in my analysis.
✅LIKE AND COMMENT MY IDEAS✅

GBP/CAD SELLERS WILL DOMINATE THE MARKET|SHORT
Hello, Friends!
GBP/CAD pair is in the uptrend because previous week’s candle is green, while the price is obviously rising on the 12H timeframe. And after the retest of the resistance line above I believe we will see a move down towards the target below at 1.867 because the pair overbought due to its proximity to the upper BB band and a bearish correction is likely.
Disclosure: I am part of Trade Nation's Influencer program and receive a monthly fee for using their TradingView charts in my analysis.
✅LIKE AND COMMENT MY IDEAS✅

USD/JPY - Multi timeframe Analysis🔥 USD/JPY — Bit More In-Depth, Still Punchy
🧭 Weekly (HTF Bias)
Trend up. We just tagged 153–154 weekly supply (prior rejection zone).
Two paths:
Clean break & hold above 154 → 156–157 magnet 🎯
Wick/reject here → corrective dip toward 149–150 (old highs + demand).
📆 Daily (Structure Check)
Clear BOS up; daily 50-EMA + structure stack around 149.2–150.2 = prime buy-the-dip area.
Expect a liquidity sweep under 150, then reclaim → rerun 153.5–154.
Daily close <147.8–147.5 = momentum shift ⚠️
⏰ 8H (Execution Map)
Rising liquidity trendline guiding pullbacks.
Buy Zone 1: 149.2–150.2 (trendline + demand + prior high).
Buy Zone 2 (deep discount): 144.8–145.6 if we get a full flush.
Above 151.5–152 and holding? Bulls may skip the deep dip and rocket straight back into 153–154 🚀
🧩 Trade Plan (rules-ish)
Primary idea (pro-trend):
Wait for sweep/reclaim of 150 on LTF (H1/H4 close back above).
Entry : 149.8–150.2 retest.
TPs: 152.2 → 153.5 → 154.8–155.2.
Invalidation : H4 close <149.0 (safer: <147.8).
Alt (only if strong breakout):
H4 close >154.2 + retest holds → ride to 156.0–157.0.
Counter-trend scalp (advanced): bearish wick rejection inside 153.5–154.2 → tag 151.6–150.8 “snack stop,” then look to flip long.
Summary : Bias bullish, hunting a dip to 150 for continuation. Lose 147.8 and the script changes.

AUDNZD: Bearish Forecast & Bearish Scenario
The recent price action on the AUDNZD pair was keeping me on the fence, however, my bias is slowly but surely changing into the bearish one and I think we will see the price go down.
Disclosure: I am part of Trade Nation's Influencer program and receive a monthly fee for using their TradingView charts in my analysis.
❤️ Please, support our work with like & comment! ❤️

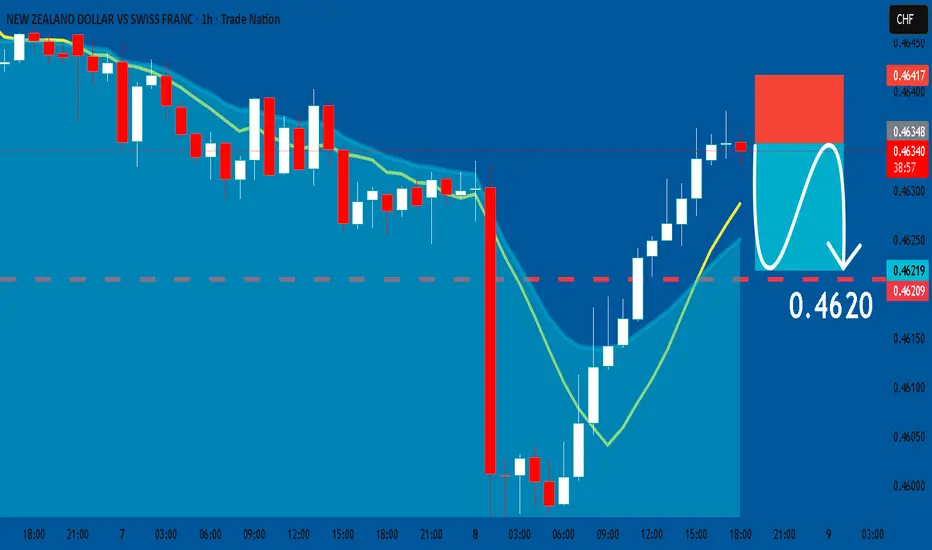
NZDCHF: Short Signal with Entry/SL/TP
NZDCHF
- Classic bearish formation
- Our team expects fall
SUGGESTED TRADE:
Swing Trade
Sell NZDCHF
Entry Level - 0.4634
Sl - 0.4641
Tp - 0.4620
Our Risk - 1%
Start protection of your profits from lower levels
Disclosure: I am part of Trade Nation's Influencer program and receive a monthly fee for using their TradingView charts in my analysis.
❤️ Please, support our work with like & comment! ❤️
AUDCHF A Fall Expected! SELL!
My dear followers,
This is my opinion on the AUDCHF next move:
The asset is approaching an important pivot point 0.5280
Bias - Bearish
Safe Stop Loss - 0.5287
Technical Indicators: Supper Trend generates a clear short signal while Pivot Point HL is currently determining the overall Bearish trend of the market.
Goal - 0.5269
About Used Indicators:
For more efficient signals, super-trend is used in combination with other indicators like Pivot Points.
Disclosure: I am part of Trade Nation's Influencer program and receive a monthly fee for using their TradingView charts in my analysis.
———————————
WISH YOU ALL LUCK
GBPCHF: Bears Will Push Lower
It is essential that we apply multitimeframe technical analysis and there is no better example of why that is the case than the current GBPCHF chart which, if analyzed properly, clearly points in the downward direction.
Disclosure: I am part of Trade Nation's Influencer program and receive a monthly fee for using their TradingView charts in my analysis.
❤️ Please, support our work with like & comment! ❤️

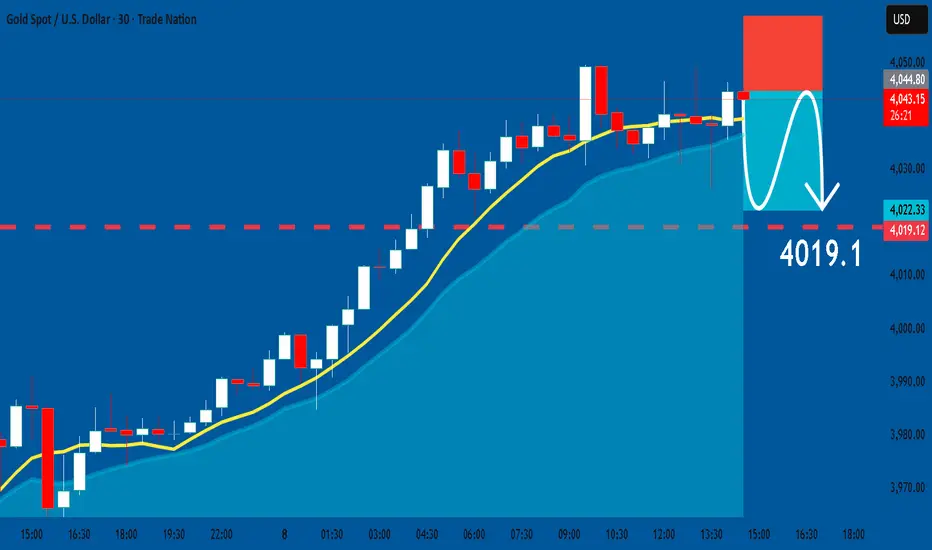
GOLD: Short Trade with Entry/SL/TP
GOLD
- Classic bearish formation
- Our team expects pullback
SUGGESTED TRADE:
Swing Trade
Short GOLD
Entry - 4045.1
Sl - 4058.9
Tp - 4019.1
Our Risk - 1%
Start protection of your profits from lower levels
Disclosure: I am part of Trade Nation's Influencer program and receive a monthly fee for using their TradingView charts in my analysis.
❤️ Please, support our work with like & comment! ❤️
NZDJPY Trading Opportunity! SELL!
My dear friends,
Please, find my technical outlook for NZDJPY below:
The instrument tests an important psychological level 88.173
Bias - Bearish
Technical Indicators: Supper Trend gives a precise Bearish signal, while Pivot Point HL predicts price changes and potential reversals in the market.
Target - 87.931
Recommended Stop Loss - 88.340
About Used Indicators:
Super-trend indicator is more useful in trending markets where there are clear uptrends and downtrends in price.
Disclosure: I am part of Trade Nation's Influencer program and receive a monthly fee for using their TradingView charts in my analysis.
———————————
WISH YOU ALL LUCK

NZDUSD Is Going Down! Sell!
Here is our detailed technical review for NZDUSD.
Time Frame: 1D
Current Trend: Bearish
Sentiment: Overbought (based on 7-period RSI)
Forecast: Bearish
The market is on a crucial zone of supply 0.577.
The above-mentioned technicals clearly indicate the dominance of sellers on the market. I recommend shorting the instrument, aiming at 0.563 level.
P.S
The term oversold refers to a condition where an asset has traded lower in price and has the potential for a price bounce.
Overbought refers to market scenarios where the instrument is traded considerably higher than its fair value. Overvaluation is caused by market sentiments when there is positive news.
Like and subscribe and comment my ideas if you enjoy them!

USOIL SENDS CLEAR BEARISH SIGNALS|SHORT
USOIL SIGNAL
Trade Direction: short
Entry Level: 62.52
Target Level: 60.15
Stop Loss: 64.10
RISK PROFILE
Risk level: medium
Suggested risk: 1%
Timeframe: 7h
Disclosure: I am part of Trade Nation's Influencer program and receive a monthly fee for using their TradingView charts in my analysis.
✅LIKE AND COMMENT MY IDEAS✅

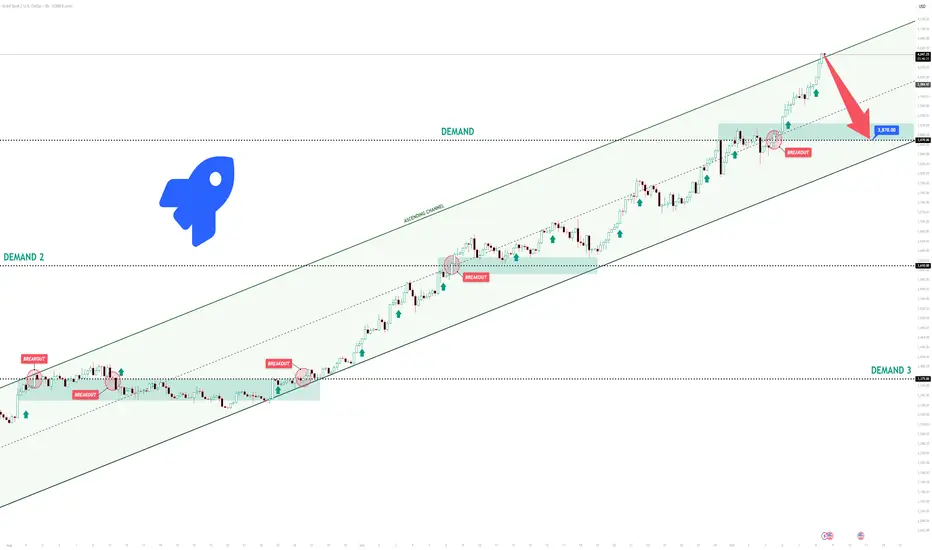
XAUUSD Short: Targeting 3870 on a Corrective MoveHello, traders! The price auction for XAUUSD has been moving within a clearly defined ascending channel, reflecting a persistent and well-structured bullish trend. This pattern has effectively guided the market upward, with buyers maintaining firm control and driving the price through several significant resistance levels, including 3375 and 3610. Such momentum highlights the continued dominance of bullish sentiment in recent sessions.
At the moment, the price is approaching a critical inflection point near the upper boundary of this channel. Following an aggressive rally, XAUUSD is now testing the channel’s ascending supply line, an area that often acts as a strong resistance zone. This is typically where selling pressure begins to surface, as traders look to capitalize on overextended bullish moves.
My short-term expectation is a corrective phase. I anticipate that the price may attempt a brief breakout above the channel’s resistance, forming a potential “fake breakout” trap for late buyers, before reversing lower. A confirmed rejection from this region would likely trigger a pullback toward the 3870 area, which aligns with prior structural support. Accordingly, I have placed my take-profit target at 3870. Manage your risk!
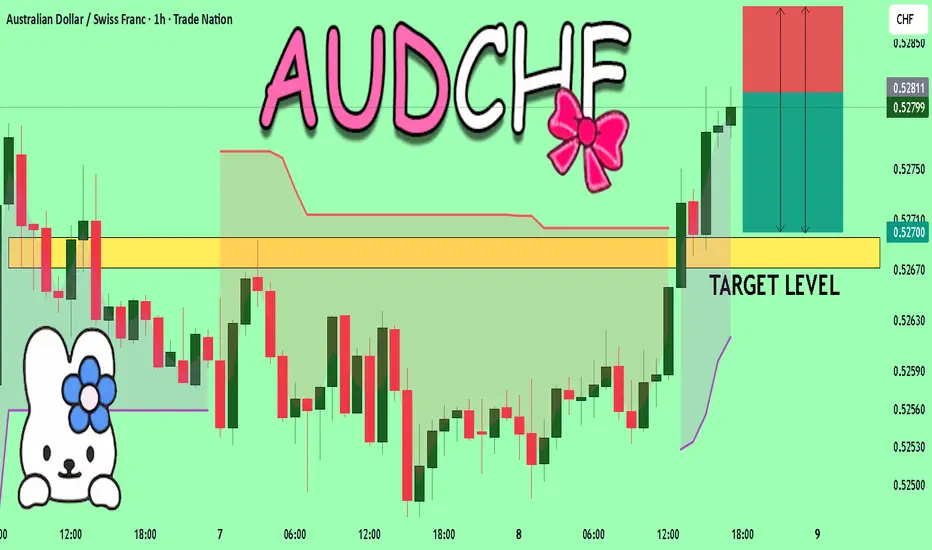
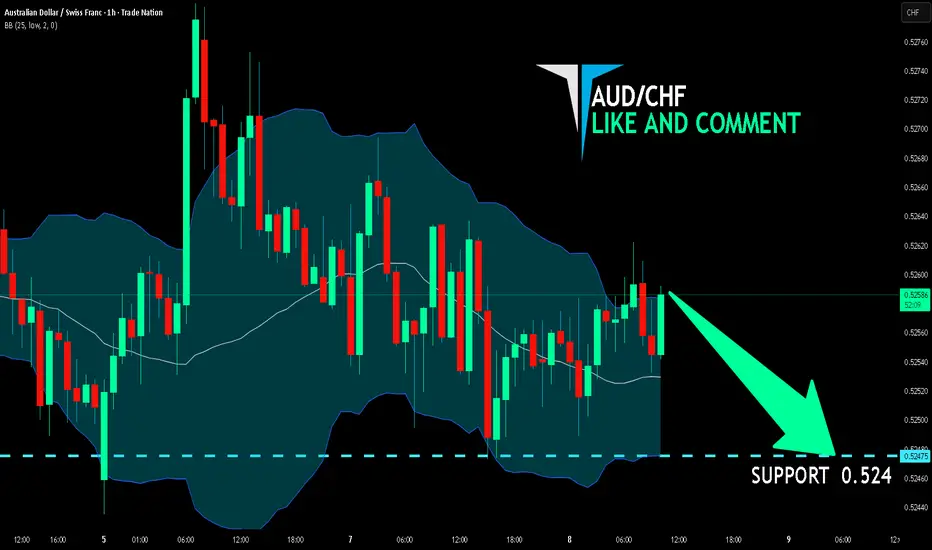
AUD/CHF BEARISH BIAS RIGHT NOW| SHORT
Hello, Friends!
It makes sense for us to go short on AUD/CHF right now from the resistance line above with the target of 0.524 because of the confluence of the two strong factors which are the general downtrend on the previous 1W candle and the overbought situation on the lower TF determined by it’s proximity to the upper BB band.
Disclosure: I am part of Trade Nation's Influencer program and receive a monthly fee for using their TradingView charts in my analysis.
✅LIKE AND COMMENT MY IDEAS✅
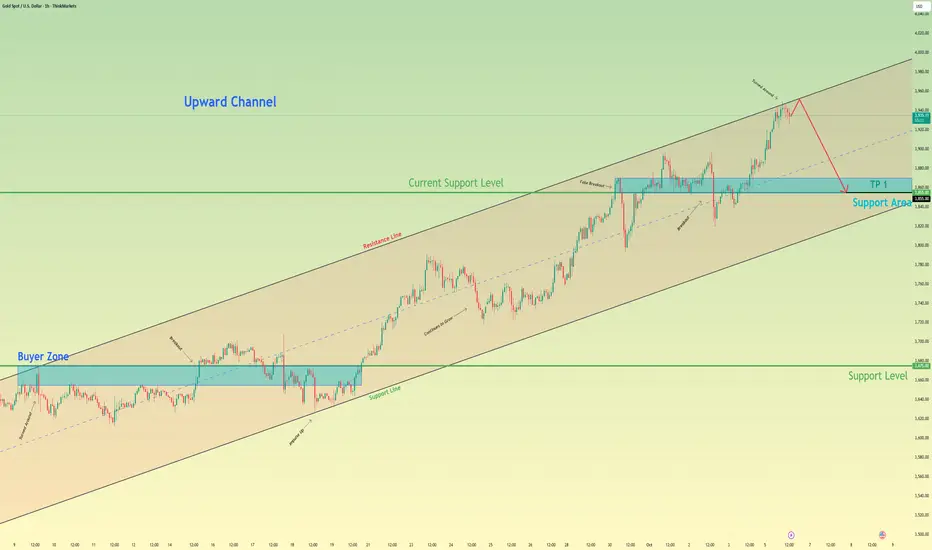
Gold can Start a Correction Towards 3855 SupportHello traders, I want share with you my opinion about Gold. The broader market context for Gold has been decidedly bullish since the price reversed and broke out from a prior descending channel. This structural shift established a new uptrend, which has since been neatly contained within a well-defined ascending channel. The price action for XAU has been creating a clear sequence of higher highs and higher lows. Currently, the asset is trading very close to the resistance line of this ascending channel, an area where sellers may re-emerge. My strategy is based on the expectation that the price will reach this line, be rejected, and then begin a corrective decline. I think after such a strong run, a pullback is a probable scenario. A confirmed reversal from this upper boundary would validate the short idea. Therefore, I have placed my TP at the 3855 current support level. Please share this idea with your friends and click Boost 🚀
Disclaimer: As part of ThinkMarkets’ Influencer Program, I am sponsored to share and publish their charts in my analysis.
Bitcoin Hodlers are happy campers - BUT🕷️ 🌕 🦇 In Switzerland it’s now 11:50 PM 🕷️ 🌕 🦇
I’m tired from a long day in the markets, but I feel I have to get this one out because it’s important for many of you holding Bitcoin.
In my last post, I said we’d run upward to reach the Hagopian Line, and here we are, even higher.
We’ve just tagged the U-MLH for the third time.
There’s an old pattern from the futures markets that farmers once noticed. It’s called the “Three Drives” pattern.
The old farmers knew that when this pattern appeared, it was time to hedge their crops, or add to their hedge.
When I was a student at MarketGeometry, Tim Morge explained this pattern, and ever since it’s served me well as a signal for a trend reversal.
I don’t know exactly how this will help each of you, but I’m sure it’s worth a heads-up. Whether you decide to hedge, close your positions, or just HODL until the sun burns out, it’s something to keep in mind.
Meanwhile, the Harvest Moon is shining into my office tonight, twinkling with a strange grin... 🌕
Time for me to rest.
Good night, everyone.
🌾 🌾 🌾 🌾 🌾 🌾 🌾

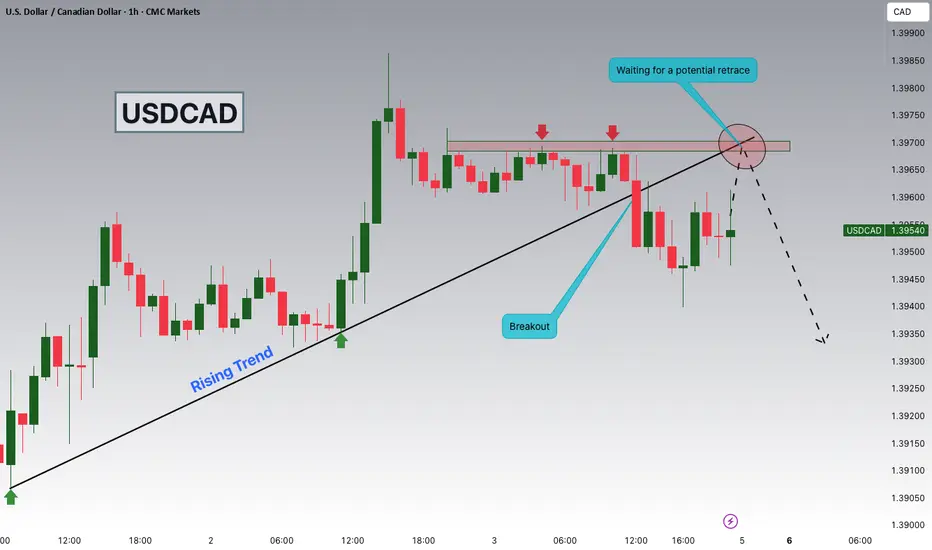
USDCAD Breakout and Potential RetraceHey Traders, in tomorrow's trading session we are monitoring USDCAD for a selling opportunity around 1.39700 zone, USDCAD was trading in an uptrend and successfully managed to break it out. Currently is in a correction phase in which it is approaching the retrace area at 1.39700 support and resistance area.
Trade safe, Joe.