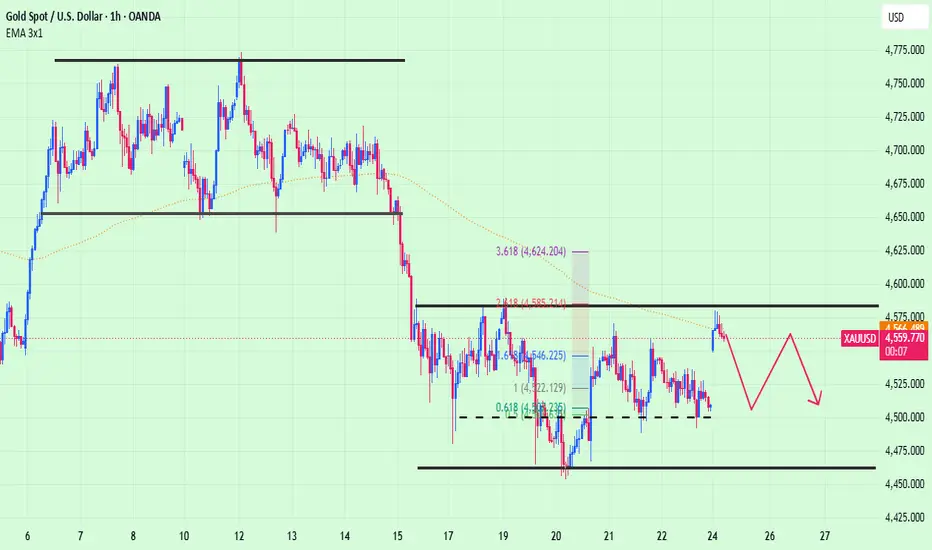
Gold Rebounds as Markets Assess Mixed US–Iran Signals1. Macro Drives
Gold opened Monday with a bullish gap before extending higher and retesting the $4,550 level during the early trading hours. Markets are still monitoring developments surrounding a potential agreement between the United States and Iran following several constructive headlines over the weekend. However, the overall flow of information remains mixed and inconsistent, with no clear confirmation of meaningful progress in negotiations so far.
The return of risk appetite has added p
Sidewaybounce
GBPUSD Analysis: Trend Trading Opportunity- Trade Strategy: Trend Trading - Sideway Bounce Setup
- Key Levels: Key Support at 1.2461, Target at 1.2502
- Profit Potential: 41 pips (410 USD/lot)
Analysis:
- Trade Strategy: Trend Trading - Sideway Bounce Setup
- Key Levels: Key Support at 1.2461, Target at 1.2502
- Profit Potential: 41 pips (410 USD/lot)
Trade Plan:
- Long Opportunity: Consider going long at 1.2461 for a trend trading opportunity
- Take Profit: Set initial target at 1.2502 for a profit potential of 41 pips
- Risk Manage
EURUSD Analysis: Short-term Buying OpportunityTrade Strategy: Short-term Buying Opportunity
- Key Levels: Buying Opportunity at 1.0679, Take Profit at 1.0722
- Profit Potential: 43 pips (430 USD/lot)
Immediate Trade Plan:
- Trade Strategy: Short-term Buying Opportunity
- Key Levels: Buying Opportunity at 1.0679, Take Profit at 1.0722
- Profit Potential: 43 pips (430 USD/lot)
Future Trade Plan:
- Buying Opportunity: Consider buying at 1.0679 for a short-term trade
- Take Profit: Set initial target at 1.0722 for a profit potential of 4
A Classic Support & Resistance TradeI'd engaged in a classic Support and resistance trade with 1 single target and observed candlestick movement on a key turning point.
Shorted AUDCAD at 0.8845 and my Initial Stop-Loss is at 0.8864(-19pips)(~190usd/lot).
Once the market hit 0.8829, I would shift stop to entry(SLE), attaining a risk-free trade.
In between I do nothing!
GBPJPY Analysis: Sideways Bounce Trading Opportunity- Trade Strategy: Support and Resistance Trading
- Key Levels: Resistance at 192.75, Support at 190.37
- Profit Potential: 238 pips (~2,380 USD/lot)
Analysis:
- Trade Strategy: Sideways Bounce Trading
- Key Levels: Identified resistance at 192.75 and support at 190.37
- Profit Potential: Significant profit potential of 238 pips (~2,380 USD/lot) between support and resistance levels
Trade Plan:
- Selling Opportunity: Consider shorting near resistance level at 192.75
- Buying O
GBPAUD Sideway Bounce Trading SetupI'm excited to share a trading setup on GBPAUD utilising the Sideway Bounce strategy. Here are the details:
- Setup: Sideway Bounce Trading
- Short Entry: 1.9324
- Long Entry: 1.9230
The Sideway Bounce strategy is a technique I've tested and traded since 2005, and I find it a comfortable and reliable approach.
In this scenario, I'm considering a short position at 1.9324 or a long position at 1.9230, aiming to capitalise on potential movements within this range.
This setup offers approximate
Levels to WatchIn the world of trading, never underestimate the power of key support and resistance levels.
These levels often become the battleground for market movements, forming a Sideway Bounce Trading setup.
On my radar for AUDCAD:
- Buying Opportunity: Watch for potential long entries at 0.8931.
- Shorting Opportunity: Keep an eye on the chance to go short at 0.8982.
This trade strategy remains active as long as the support and resistance levels hold.
Share your insights and trade plans on AUDCAD
This is the kind of Trading Setup that I go Aggressive!The Bullish Shark Pattern is yet to be confirmed, but it went lower than PRZ, which is seen as a warning sign for most. However, I see it as an opportunity that I don't want to miss out on.
Here are some key points that I wanted to highlight:
- The Terminal Bar produced a long shadow that provided Cover Support, which means that the level is not broken.
- On the 1-hourly chart, we can see RSI divergence.
- There's a sideway bounce setup on the 4-hourly chart, which can be attributed to a com
Trade Both Ways!!Our analysis suggests that there is a sideway bounce trading opportunity, with resistance at 158.49 and support at 156.79. With a difference of 170pips, this provides an incredible profit potential that can lead to close to 1,790usd/lot.
We have two sideway bounce trading strategies that we could utilize to maximize our profits. I would love to hear your thoughts on which one you prefer.
Both strategies have been carefully crafted and have the potential to yield high returns.
Let's take adva
One of my Fave!I wanted to share with you one of my favourite trading strategy, the Sideway bounce. Not only is it easy to execute, but it also delivers some of the most relaxing results.
In this particular case, the resistance is at 148.40, and the support is at 147.51, which means they're 89 pips apart. This translates to an approximate profit potential of $890 per lot, both ways.
To ensure success with this strategy, it's crucial to make sure the market doesn't violate the two levels. This way, we can m
Bullish Momentum in Focus!Trading on the Euro Yen has been on a bullish trend, with some market consolidation due to the over-extended movement. To take advantage of this trend, we recommend buying at support and selling at resistance, which can potentially produce a profit potential of 170pips on the 4-hourly chart.
On the daily chart, we have just broken the very aggressive and trending bullish trend line, but there are other trend lines that can offer a buying opportunity. However, we suggest waiting for a selling op
Rediscovering a Classic: GBPUSD TradingAh, the good old days! This GBPUSD setup takes me back to my early trading days. The strategy? Simple yet effective: buy at support, sell at resistance.
While some may view it as a scalping trade, dismissing it as low volatility, here's the kicker — there's a potential 56 pips in profit. 💰
My game plan? Patience. I'll wait for the next support retest, keeping an eye out for that magic candle confirmation before making my move to buy. Alternatively, if the market hits resistance, I'll await the
Why choose when you can have both?Listen up, traders! Are you limiting your potential profits by only engaging in one trade at a time? Don't fall into the trap of thinking that just because you're long on AUDUSD, you can't also engage in a short trade on GBPAUD.
I've been charting and trading for 18 years and let me tell you, sometimes the nicest setup doesn't always give us the best returns. That's why it's important to have the right risk management in place and be willing to follow your trade plan.
So don't miss out on pote
Aggressive Trader could considerIf you are an Aggressive Trader, you may consider shorting the AUDCAD on the 1-hour chart at a market price of 0.9044.
Conservative trader might want to wait for a 3-bar reversal or a retest at 0.9055 on the 4-hourly chart based of the retest of previous resistance and of a sideway bounce trading setup.
A 213pips of Profits PotentialOn the right is the Bullish Shark Pattern that has been identified since the week before(related idea is within this TradingView post).
On the left is one of my favourite trading setup, the Sideway Bounce trading opportunity. Trading from end to end gives 213pips(2,130usd/lot) of profits potential. The market has to touch 1.0745 to complete the Sideway Bounce trading setup, but a retest to 1.0532 would be good enough to engage it as a combo trade and ride on the Bullish Shark Pattern on the hig
Combo Trade, Buying Opportunity on EURUSDOn the right, the Bullish Shark Pattern has been completed. A retest at 1.0530 would give an opportunity for trend traders to engage in the trade.
On the left, the sideway bounce trading setup on the 1-hourly chart gives traders like me to trade it both ways, shorting and buying opportunities. However, my focus will be put on the buying opportunity at 1.0537 to form a combo trading management setup.
The easiest 100pips profits to captureAs early as 8 Feb 23, I've been shouting LONG the Shark, LONG the Shark(at this to my community). The trading analysis report was written on TradingView.
The Bullish Shark Pattern has been bouncing off the Bearish 5-0 patterns, and this combo, it produces more than 100pips of profit potential.
It has bounced up and down 5 times; that's not too bad. 5x100pips = 500pips.
I'm excited to wait for the next confirmation to get involved in this trade.
Free 21pips to grabIf you have been following me, you would know this is not the kind of Trade I'll be sharing. But there you go. Shorting on the Red Line and Turning your shorts to long once it has a pattern confirmation on the blue like is where you get to long the same pair.
It's kind like free money, until it doesn't work.
If I have to pick a side, I will focus in looking for a Shorting opportunity, and that's because a Bearish Shark Pattern 🦈 has formed up.
USDJPY - FREE MONEY!!This is the kind of trading setup that I used to shout! FREE MONEY!! It's a sideways bounce formation; as the name implies, I expect the market to bounce between the two zones, the red and blue zones. The profits are pretty good, given that it is a 15mins chart, it produces a potential of 56pips(approx 560usd/lot).
With that, risk management is essential. Don't jump into the trade without measuring your initial risk, and it is important to wait for the candlestick patterns confirmation so you c
EURUSD-Weekly Market Analysis-Nov22,Wk2Regarding the overall trading setup, I'm waiting for a Buying opportunity on the EURUSD. EURUSD is on a sideway bounce setup, so I can wait for a buying at the blue solid line(0.9739) and shorting at the red solid line at(1.0082) for a trading opportunity.
Aggressive traders can wait for buying opportunities within the Demand Zone /Blue Box at 0.9843.