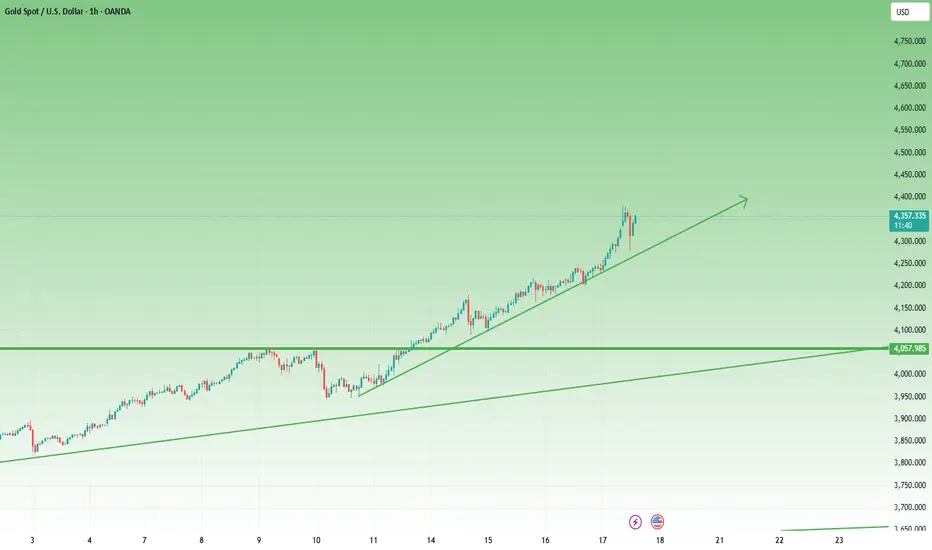
Another Volatile Day for Gold: Is the Next Leg Down Loading?Yesterday was just another volatile session for Gold...
After testing the waters above $4,000, price reversed sharply during the New York session, dropping to around $3,930.
A brief consolidation followed, and by the time of writing, Gold already rebounded toward $3,970, reclaiming the $3,960 support area.
Despite this recovery, the overall structure remains bearish — as long as price fails to stabilize above $4,000, sellers maintain control.
📉 Outlook:
I continue to expect another leg down, with $3,915 as my next focus, followed by the recent low around $3,885.
Signalprovider

GBPUSD: Bearish Structure Points to 1.3000 NextAround two weeks ago, I mentioned that GBPUSD could fall toward the 1.32 support, and indeed, the pair reached that level on Wednesday.
Since then, GBPUSD even broke below 1.32 and is now trading around 1.3140, raising the big question — will it fall further to test 1.3000?
In my view, yes, it will.
The structure remains bearish, and since mid-September, every rally has been sold into, forming a clear lower highs – lower lows pattern.
So, in conclusion, rallies above 1.32 should be sold, with a target at 1.3000, as mentioned earlier. 🚀

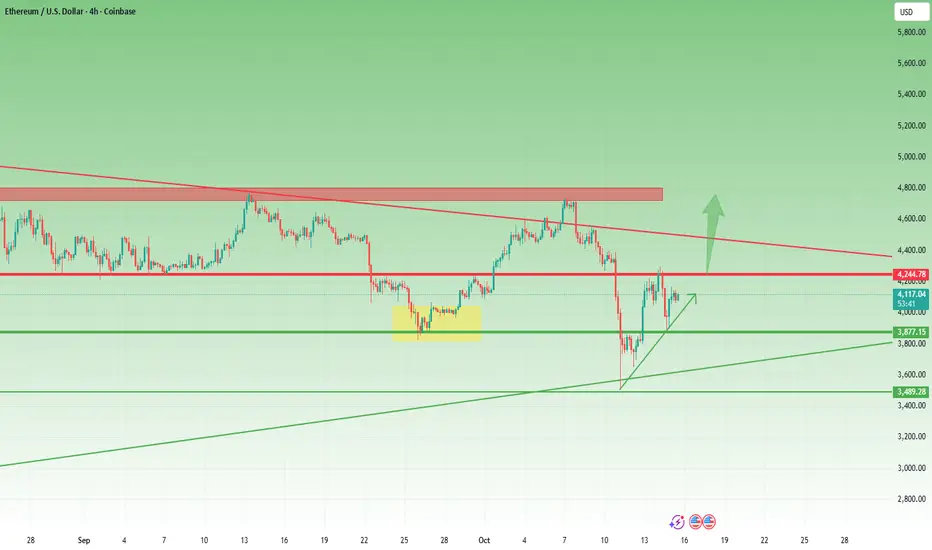
Ethereum Recovery Stalls — $3K Retest on the Horizon?After the flash crash on October 10th, ETH recovered quite well — but as mentioned at that time, for a full recovery and return to a bullish tone, the price needed to reclaim the $4,300 resistance.
That never happened...
After a second attempt on Monday, the price is now back below $4,000, testing the recent short-term support zone.
Looking at the broader structure since early August, the market has turned decisively bearish, showing two clear phases of distribution.
As previously noted, the price continues to press against the confluence support, and I expect a breakdown to occur soon.
If that happens, ETH could fall toward the $3,000 area to retest the major support level that dates back to 2024.

BTC Analysis — Support or Trap? The 106–107k Zone Under PressureIn my previous BTC analysis — right before the flash crash — I mentioned that I was struggling to maintain my bullish stance, and that only a break back above 118k would restore confidence. In fact, I leaned toward a bearish bias, and the recent price action has confirmed those concerns.
The market has repeatedly failed to reclaim the 118k zone, continuing to drift lower toward 106–107k support.
As I’ve explained multiple times, when I see this kind of movement — price coming back to the same support again and again — it’s hard to believe that the market is doing it so we can all buy and profit.
Usually, this pattern acts as a trap, luring in buyers before a final breakdown.
That’s the scenario I’m watching once again.
Technical Levels:
- Resistance: 118k (major cap)
- Support: 106–107k (key zone)
- Interim level: 100k (psychological)
- Target on breakdown: 90k
My selling zone is between 113–115k, as I expect any bounce into this area to meet renewed selling pressure.

Gold Approaches 3960 Support After Failing at 4030Yesterday, I highlighted that Gold appeared slightly bullish, forming an ascending triangle with resistance around the 4030 zone. Early in the day, Gold did indeed rise and tested this resistance again. However, after the futures market opened, momentum started to fade, and the price began fluctuating around the 4000 level.
As we entered the Asian session, the bears took control, and Gold is now testing the 3970 level, approaching the key 3960 support, which aligns with yesterday's low.
If we see a break below this support, the next key levels to watch are 3915, a zone where Gold experienced significant reactions last week, and even 3890.
On the flip side, any stabilization above the 4000 level could shift the bias back to bullish.
Key Points:
- Downside: Break below 3960 opens 3915 and potentially 3890.
- Upside: Only stabilization above 4000 would suggest a bullish shift.
🚀 Let's see if Gold can make a move today, but remember, volatility remains extremely high and 3-400 pips means nothing for Gold nowadays

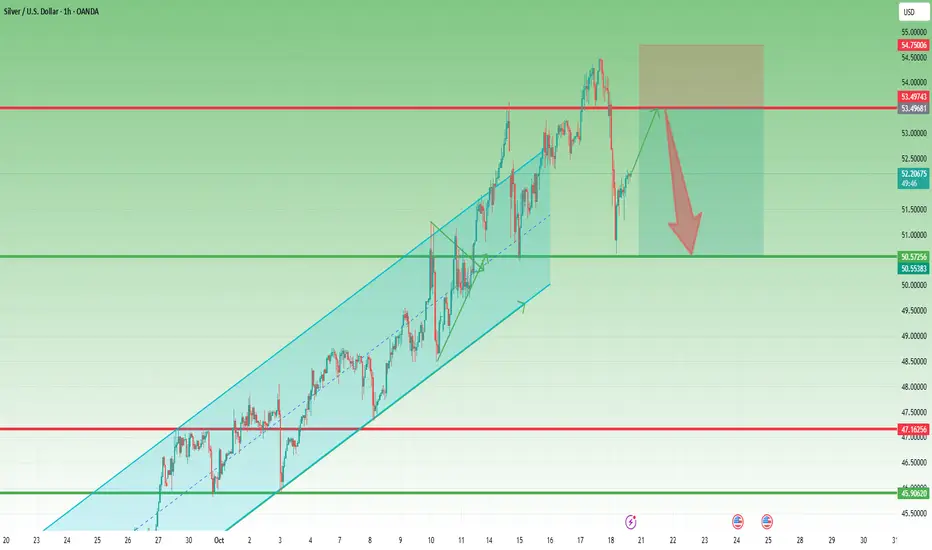
Silver Turns Bearish Again – Watch 47.50 Support CloselyPretty similar to Gold, Silver also failed to break above resistance yesterday and started to roll back down.
A few hours ago, the price touched short-term support and is now seeing a minor rebound.
However, the structure has clearly turned bearish, with lower highs confirming momentum exhaustion.
If 47.50 support breaks, a visit to 45.50 becomes highly probable — and even a test of the psychological 45.00 level shouldn’t be ruled out.
My strategy is to sell rallies, ideally near intraday resistance, following the medium-term bearish bias.

Gold Congestion: Clear Levels, Unclear DirectionAfter forming a local low at 3887 last week — a level perfectly aligned with the October ATH area — OANDA:XAUUSD started to recover from the recent 5k pips decline, retesting the 4050 resistance zone, which previously acted as strong support.
Since mid-last week, price action has entered a consolidation phase. Despite high intraday volatility, the structure is beginning to compress into a clear congestion pattern.
This range, roughly 1k pips wide, provides traders with well-defined reference points:
- Support: 3950–3960 zone – a break below this area would likely reopen the path toward the recent 3887 low.
- Resistance: 4040–4050 zone – a confirmed breakout above could trigger a continuation toward 4150.
At this stage, I am slightly bullish, given the sharp rejections from 3920 last week and the emerging ascending triangle structure, which often precedes upward continuation.
Still, confirmation is required — the market must decide whether this congestion is accumulation or distribution.

XAUUSD: Bulls vs. Resistance — 4050 Decides the Next MoveIn yesterday’s analysis, I mentioned that after the reversal from the 3920 support zone, Gold (XAUUSD) could continue higher toward the 4050 resistance area.
Indeed, that target has been reached, followed by a 600-pip leg down overnight.
At the moment, the price is resuming its upward move and is trading back above $4,000, around 4025.
Going forward, I expect volatility to remain high. If the bulls fail to sustain the price above 4050, another leg to the downside could follow.
For now, I’m out of the market, waiting to see whether we’ll get another test of 4050 — and more importantly, how the price reacts in that zone. 🚀

The Yo-Yo Market: Gold Swings Wildly but Goes NowhereRecently, Gold’s volatility has been extreme — with over 1,000+ pip swings up and down. Yet, despite all the loud noise , if we look closer, nothing truly significant has happened since the drop from the 4400 zone to below 4,000.
For most retail traders using stop losses, this type of environment has been extremely challenging — whipsaws in both directions.
However, if we step back and filter out the noise, a clearer structure begins to appear:
________________________________________
🔍 Key Observations
1. Normal Correction Behavior
The sharp drop from the all-time high actually stopped right at the previous ATH from early October — a very common technical behavior, where price retraces into prior calendar-based resistance zones.
2. Below 4K, But Not Broken
Although Gold is currently trading below 4,000, the move under that level is not yet a confirmed breakdown.
3. Strong Rebounds from 3920
Yesterday, price bounced aggressively from the 3920 zone, and this exact reaction repeated twice overnight — showing that buyers are still defending this area.
4. Correction Within the Golden Zone
Despite the dramatic fall, the current retracement sits just above the 61.8% Fibonacci level of the strong bullish leg from late August — technically, a textbook “golden zone” correction.
________________________________________
🎯 Trading Outlook
If we connect all the dots, Gold appears to be finishing a much-needed correction rather than starting a downtrend.
• Short term:
Resistance is found around 3975–3980. A clean break above could open the way to 4030.
• Medium term:
If Gold manages to stabilize above 4,000, the next upside targets are 4050, and possibly 4150 as we move into November.
________________________________________
⚖️ Final Thoughts
Yes, volatility is high — but beneath the surface, Gold is simply completing a natural corrective phase.
As long as 3900-3920 zone holds, the medium-term focus shifts back toward 4150.
🚀

The Silver Storm: 9k Pips Down, but Bulls Start Breathing AgainWhile Gold has been volatile, Silver’s drop has been even more spectacular — a breathtaking 9,000-pip decline in just 10 days, from the all-time high near 54.50 down to 45.50, a correction of roughly 20%.
But let’s not forget — the prior rally was just as extreme: from 37 to almost 55, a 50% surge.
This kind of price behavior is typical for Silver — sharp on both sides. Yet, compared to Gold, the recent structure shows a few key differences worth noting:
________________________________________
🔍 Key Observations
1. Back Above the Ascending Trendline
After the recent low two days ago, Silver managed to climb back above the ascending trendline that started in late August — a strong early sign of stabilization.
2. Perfect 50% Retracement Support
The correction stopped exactly at the 50% Fibonacci retracement, perfectly aligned with a major horizontal support zone — a classic technical confluence.
3. Higher Low Confirmed
Unlike Gold, Silver printed a clear higher low last night, strengthening the case for a bullish recovery setup.
________________________________________
🎯 Outlook
Putting it all together, Silver appears to have completed its correction and looks technically stronger than Gold at this stage.
If the current momentum continues, a new test above 50 seems increasingly likely in the coming sessions.
🚀

XAUUSD Crashes 1500 Pips — Key Supports Gone!Gold started the week poorly, dropping around 1500 pips and, more importantly, breaking three key support levels:
• the rising trendline that started back in August,
• the 4020 horizontal support zone,
• and even the psychological 4000 level.
Overnight, the price attempted to reclaim 4000, but failed — currently trading around 3965.
The next immediate support sits at 3945, and even if we see a rebound from here, bulls will need to hold the price firmly above 4000 to have any chance of a reversal.
If this level also fails, the next obvious medium-term target is the 3720–3750 zone.
I m bearish for now, but there isn’t a clean or logical entry point at the current levels — I will wait until a clearer setup forms.

XAUUSD: 800 Pips Secured, but Is the Correction Really Over?Yesterday, after revisiting the 4,000 support zone as expected and explained in my previous analysis, Gold bounced strongly and tested the area above 4,100.
That rally delivered around 800 pips profit on my long trade, and now the market is showing a mild pullback, consolidating around 4,085.
The key question now:
👉 Is the overall correction over, or is there still more to unfold?
From a technical perspective, as long as 4,000 remains intact, Gold retains its bullish potential toward the 4,200 resistance zone.
However, I prefer to stay patient at the moment — being flat at the time of writing — and will wait for a potential dip toward 4,050 or slightly below.
If the price shows a positive reaction in that area, I’ll consider re-entering long positions.
🎯 Upside targets:
• First: 4,150
• Second: 4,200
Keeping a positive risk-reward balance remains the main priority.
🚀 Let’s see if the market confirms the plan.

Gold – 24 Hours of Chaos: From 4400 to 4000The last 24 hours in Gold trading were absolutely insane. After retesting the 4400 zone all-time high last night, XAUUSD literally collapsed, dropping straight to the 4000 zone in just one day — a 10% move that’s unheard of for gold (at least I haven't seen).
1️⃣ Technical Picture
Once the price broke back below 4200, it confirmed a double top formation, and the selloff accelerated dramatically toward its measured target around 4000 — a level also supported by the ascending trendline that started in late August.
2️⃣ Current Context
At the time of writing, gold already rebounded nearly 1300 pips from the low, which means there’s no attractive level to enter long right now, even though the recovery might continue in the short term.
3️⃣ Key Levels to Watch
• Resistance: 4200 zone – now turned into a major resistance. If the price revisits this level, I’ll be looking for short setups, ideally on intraday spikes.
• Support: 4000 zone – if the price dips again before testing resistance, it could offer long opportunities from this confluence area.
4️⃣ Trading Plan
In short, we’re in a wide range between 4000 and 4200, both levels offering potential trades but in opposite directions. For now, I’ll stay patient and wait for price to get closer to one of these extremes before taking action.
⚠️ Final Note
Volatility is off the charts, so if you decide to trade XAUUSD these days, adjust your stop losses and targets accordingly. This is not the time for tight stops, is time for patience, and flexibility. 🚀

Gold Analysis – Volatility Rules the GameYesterday marked another strong bullish session for Gold, as the price completely erased Friday’s losses, confirming that buyers are far from done. Regardless of how high the market has already climbed, momentum remains firmly on the bullish side.
Technically, Gold managed to reclaim and break above the 4285–4300 resistance zone, which triggered a sharp acceleration toward the recent all-time high around 4380.
At the time of writing, the market is undergoing a normal retracement, which is a healthy technical reaction after such an aggressive move. The 4300 area has now turned into key short-term support, and as long as bulls defend this level, the probability of a new ATH remains high.
From a trading perspective, however, volatility has reached extreme levels. This type of price action often favors large players with fundamental reasons rather than discretionary traders. For that reason, I prefer to stay on the sidelines today, waiting for volatility to stabilize before engaging again.

Silver: After New All-Time Highs, a Sharp CorrectionLast week, Silver reached a new all-time high, almost touching my $55 target.
However, on Friday, the market delivered a powerful sell-off, with the price dropping by around 4,000 pips — from the $54.50 ATH down to the $50.50 support zone.
At this stage, I expect the price to stabilize and form a temporary base of consolidation.
My focus now shifts to the $53.50 resistance zone, which could act as a short-term decision point.
If I observe signs of weakness or rejection in that area, I’ll consider short positions, targeting a potential retest of the $50 support zone.
4,000 Pips Up, 2,000 Down – Gold’s Wild Ride Continues!Last week has been a wild ride for Gold traders, with the price rallying aprox 4,000 pips (around 10%), only to sell off 2,000 pips on Friday in what many expected to be a well-deserved correction.
The big question now is: was that correction enough, or is Gold preparing for another leg down before continuing higher?
In my view, this was just the first leg of the correction, and I expect another wave of selling to come this week.
Currently, Gold is recovering from Friday’s sharp drop, and this rebound could potentially push prices back above 4,300.
If that happens, I’ll be watching closely for signs of weakness to position myself short.
Overall, I believe a new test of the 4,200 area is likely before any sustainable recovery can take place.

When Everyone’s Buying, I’m Watching for the TopAs we’ve grown used to by now, Gold sets a new ATH almost every day — and by the time we, in Europe, wake up, it’s already 300–400 pips higher.
Yet despite the strong bullish momentum, speculative trading remains extremely difficult. Sudden drops of hundreds of pips can easily hit your stop loss if your entry timing isn’t perfect.
From my perspective — even though I don’t have an open position — the idea remains the same: a correction is inevitable.
Since Friday’s low, the price has rallied around 3,000 pips — a fabulous move, but like any late-stage rally, it’s becoming excessive and irrational (even more than it already was).
Of course, it can always go higher, but the more it exaggerates, the faster it tends to normalize.
As I mentioned before, my approach remains focused on identifying potential tops — and while that’s the riskiest thing a trader can do, it has worked quite well during the sharp downward spikes of the last two weeks.
Technically, the move from Friday’s low is forming a rising wedge, with resistance around 4270, which is where I’ll be looking to sell.
The target zone is roughly 1,000 pips lower.
One encouraging factor — even more so than before — is the noticeable narrowing of the spread between futures and spot, now at just 0.2–0.25%, compared to the usual ~1% (and sometimes higher) during strong bullish phases.

Gold – Madness in MotionGold rose this week — so far (and I really want to stress so far ) — by around 10%. That’s massive by any standard.
On Monday, I tried to catch a dip and missed it. Since Tuesday, I’ve been on the sell side — completely wrong on direction , yet somehow still managed to finish positive overall.
Yesterday my stop got hit, but after what happened overnight, it turned out to be just a scratch. With this kind of volatility, a recovery of 250pips can happen in ten minutes.
Looking at the chart — it’s bullish, no question. Should it be bought? Hmmmm...
Looking at the volatility… for me, it’s become untradeable.
Can it keep going higher? Of course.
How high? Nobody knows.
At this point, any prediction is just throwing numbers in the air.
Trading corrections, as I’ve tried to do, is a guessing game. I’ve had some luck so far, but after yesterday's stop loss, I’m stepping aside.
My take: stay out. Let others make money if they can.
A 1,000-pip rise and an equal reversal — all while I was asleep (and trust me, I sleep very little) — is too crazy. Stops can be wiped for bulls just as easily as for bears.
At some point, it will settle down and define its levels.
Until then — it’s not for me anymore.
Doge- Support turned resistance. What's next?Friday’s crash took DOGE below two key support zones —
first, the ascending trendline around 0.23,
and then the horizontal support near 0.21.
After the drop, DOGE attempted a recovery that only brought it back to retest the broken 0.21 level, which has now turned into resistance. The price has since started to roll back down.
At this stage, if the negative sentiment across the crypto market continues, the probability of a deeper correction remains high — with the next significant target around 0.15.
Only a sustained move above 0.21 would neutralize this bearish scenario and open the path for a potential rebound.

Bitcoin Under Pressure: 108-110k Zone Support Now CriticalI’m struggling to maintain my bullishness lately — not because of Friday’s crash, but because, regardless of what timeframe I analyze, I just can’t find a convincing bullish bias anymore.
On the weekly chart, the structure looks increasingly fragile. After breaking above the 108k zone in mid-summer, Bitcoin pushed to a new ATH around 125k, then pulled back to retest the broken resistance. That was fine — a normal retest within a healthy uptrend. But what followed wasn’t.
The price made a new, but very anemic all-time high, showing a clear lack of momentum, and then dropped again to the same support area. Even if this drop was provoked, the fact that BTC returned so quickly to that zone makes me question the strength of any potential reversal.
From a technical standpoint, if we ignore the reasons and look only at the chart, the last 3.5 months resemble more of a distribution phase rather than a solid consolidation before another leg up.
If Bitcoin breaks below the 108k support, the next logical target sits around 100k. But considering the long-term structure I’ve shown on the weekly chart, I wouldn’t be surprised to see a deeper correction toward 90k.
The bulls are still in the game, but they’re losing ground — and unless BTC shows strength soon, the market might be preparing for another leg down before any sustainable recovery

ETH: Technical Precision Amid the CrashIn spite of the crypto market crash, Ethereum actually moved very technically.
The break below the $4,300 support led to a drop toward the important $3,500 zone.
Although the price also broke below $3,850, a quick reversal followed — the rebound brought the price back above the $3,850 support and up to the $4,300 resistance.
A new wave of selling came next, but this time, the price stopped around the $3,850 support zone, confirming it as an important level.
A quick rebound followed, and now ETH is back above $4,000, trading around $4,100.
Also very important — the price of ETH is forming an ascending triangle, with resistance at $4,300.
A break above $4,300 will most likely accelerate gains toward the $4,900–$5,000 area, which is both a technical resistance and the target of the triangle.
I’m looking to buy on dips, preferably below $4,000, and considering the mentioned target, such a setup offers around a 1:3 or even 1:4 risk-reward ratio.
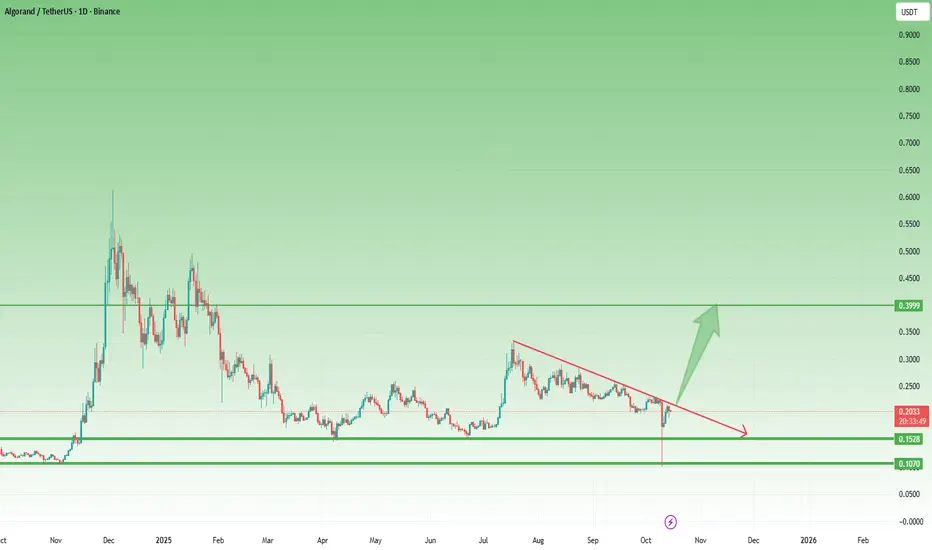
ALGO – Reversal from the Final Support ZoneLike most altcoins, Algorand also ended Friday’s crash by touching its final support zone, then strongly reversed.
After dropping to 0.10, the coin rebounded sharply and reclaimed the next key level at 0.15.
Currently trading around 0.20, ALGO is showing early signs of stabilization. If the overall crypto recovery continues, this setup could develop into a solid bullish signal.
The confirmation comes with a break above 0.2250, which would mark the end of the correction that started in December last year — opening the way toward the 0.40 zone.
Let’s see if the market confirms it. 🚀
LINK – Back Inside the Bullish FlagOn Friday night, Chainlink lost its confluence support from the 18.50 zone and dropped sharply to just under $10.
However, looking at the chart, we can clearly see the importance of this area, marked by both the 2022–2023 accumulation resistance and the 2024 lows.
From there, the coin rebounded fast, managing to reclaim the 18.50 support and re-enter the bullish flag that started forming at the end of August.
This recovery shows strong buying interest — but no clear buy signal has yet appeared.
For now, LINK remains a coin to watch closely.
A confirmed breakout above 21.50 would open the door for a new bullish leg, with 30 USD as the next technical target.
