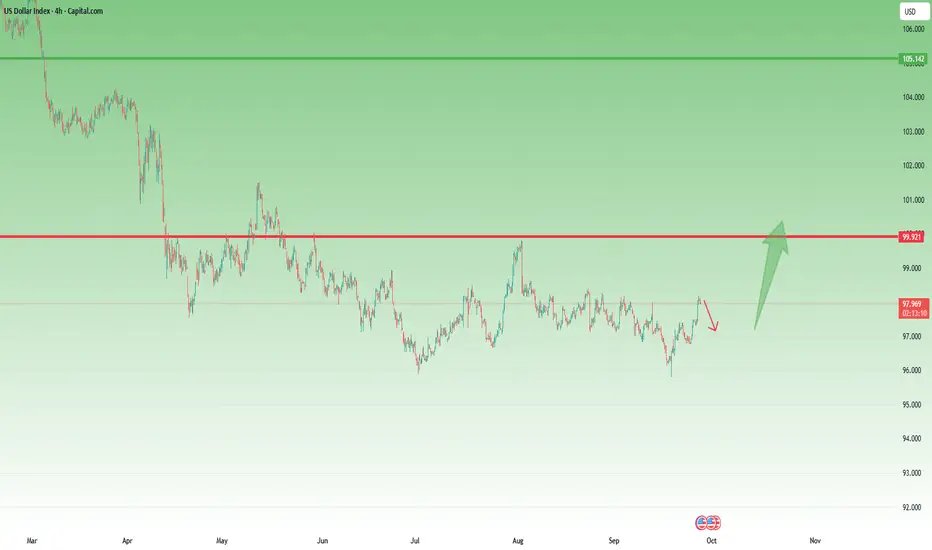
DXY – Reversal in Motion, Correction Next?In my previous DXY analysis, I highlighted that all the bad news might already be priced in for the USD, opening the door for a reversal.
That scenario is now unfolding: after making new dips, the index bounced strongly from the 95 zone and is currently trading around 98.
After such a sharp rebound, the market looks ready for a correction. This pullback phase could provide traders with attractive opportunities – especially to position short on the major USD pairs, but at better, higher prices.
Trading Plan:
• The reversal has confirmed, but I expect a correction before continuation.
• I’m looking for retracements to offer entry levels for USD shorts via majors.
• As always, flexibility is key – monitor price action closely to time entries correctly.
The market has started to shift – now it’s about waiting for the correction to align risk and reward properly. 🚀
Signalprovider
Gold – Waiting for the Perfect DipIn yesterday’s analysis, I mentioned that after reaching a new ATH just under 3800, Gold could enter a correction, and that this corrective move should be seen as a buying opportunity.
Indeed, we’ve had a pullback, but it hasn’t gone deep enough to trigger my buy limit orders – which kept me on the sidelines for now.
Still, my idea remains unchanged: I expect a liquidity dip closer to the 3700 zone, which stands out as the key support area for buyers.
Trading Plan:
• I continue to look for buying opportunities on dips, ideally around 3700.
• If price holds this zone, the bullish structure remains intact and another run toward ATH levels becomes likely.
• However, if Gold breaks below 3700, the market could enter a deeper correction phase, and I will have to re-evaluate my bias and strategy.

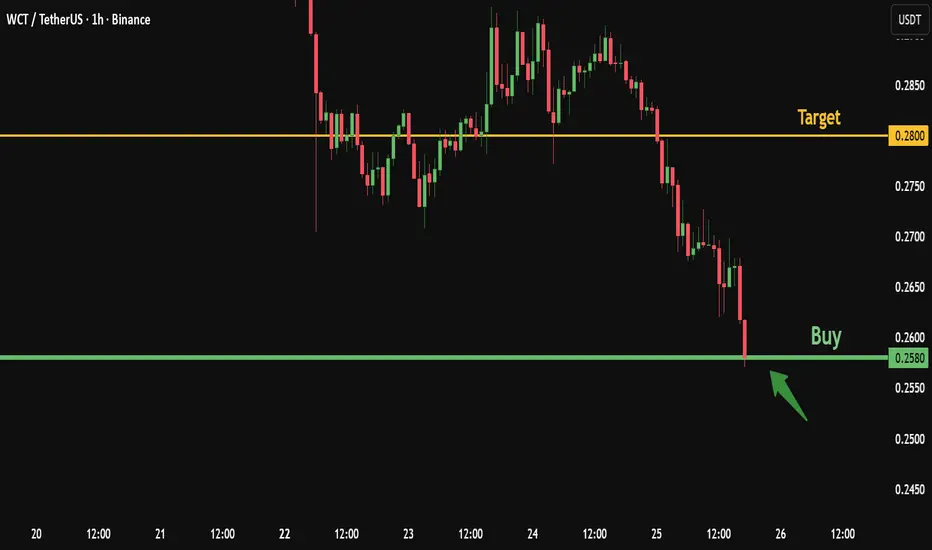
Don’t Miss WCT at Its Lowest Levels – Strong Buy SetupWCT is currently trading near its lowest levels, with the downtrend showing signs of exhaustion and price approaching its historical listing zone.
This creates an attractive risk–reward setup for potential buyers.
Here’s my personal trade plan:
✅ Entry : Buy from current price 0.2580
🎯 Target : 0.2800
The coin is at its bottom range, so if it falls further to 0.2300, I will add another buy position.
And if it reaches the historical listing price at 0.216, that would provide a great long-term buying opportunity once again
Please note:
This is not financial advice – I’m only sharing my personal trades.
Always do your own research before taking action.
👍 Don’t forget to like if you found this useful, and feel free to follow me for more analysis of this kind.
Best of luck 🌹
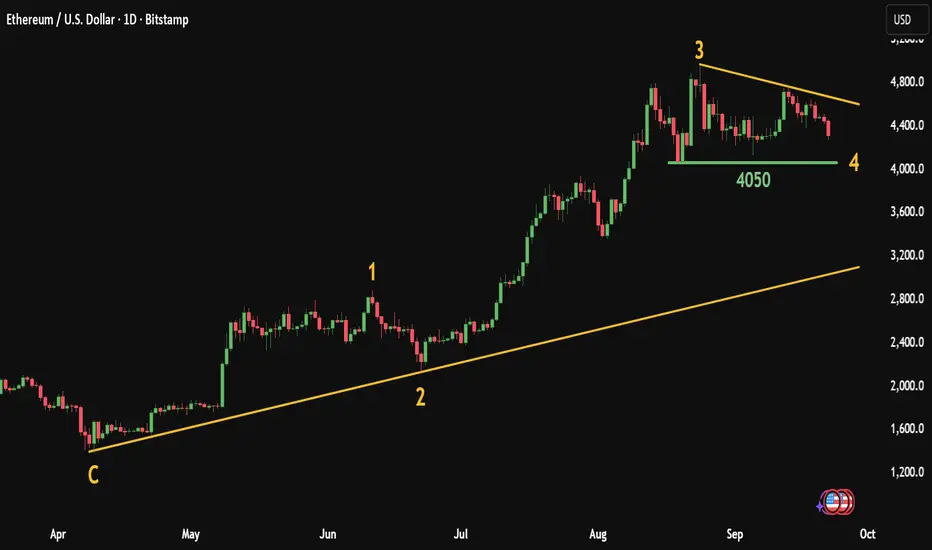
ETH Elliott Wave Analysis: Key Support at $4,050, Targets $5,200The attached chart clearly illustrates that Ethereum’s current price action is following a classic Elliott Wave structure, with three major impulsive waves completed and the market currently consolidating within the fourth corrective wave.
Ⅰ. Completed Waves
Wave C (the bottom): Marked the starting point of the new bullish cycle, around the $1,700 – $1,800 levels.
Wave 1: The initial impulsive rally, reaching $2,900 – $3,000.
Wave 2: A sideways/ corrective decline, which respected the previous bottom and maintained the overall bullish structure.
Wave 3: The strongest and most extended impulsive wave, pushing price aggressively to $4,800 – $4,900, showing the typical momentum associated with third waves.
Ⅱ. Current Phase – Wave 4
Price is consolidating within a descending contracting triangle, which is typical of a fourth-wave correction.
The key support lies at $4,050, acting as the main level to preserve the bullish Elliott structure.
Wave 4 is usually more complex and sideways than Wave 2, which fits well with the current market behavior.
Ⅲ. Outlook – Wave 5
As long as $4,050 holds without a daily close below it, the most likely scenario is the start of the fifth impulsive wave upward.
This wave is expected to break above the Wave 3 peak at $4,800 and extend into new highs.
Potential upside targets: $5,200 – $5,500, with room for higher levels if institutional momentum drives further expansion.
Conclusion:
Ethereum is unfolding within a clear Elliott Wave bullish cycle. The ongoing Wave 4 correction is consolidating around the $4,050 support level, which is the key pivot to watch. Holding this zone increases the probability of a Wave 5 rally, potentially driving ETH to fresh all-time highs in the coming weeks.
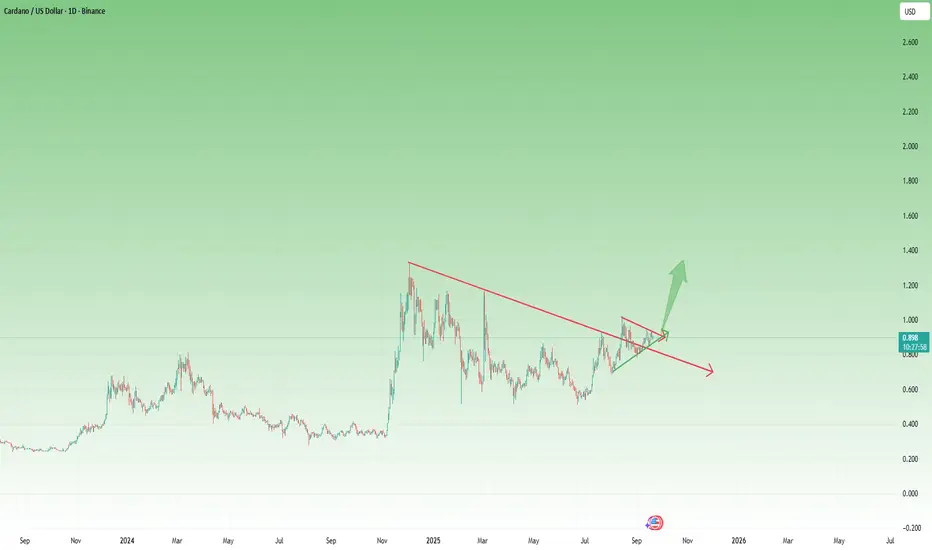
ADAUSD – Symmetrical Triangle Points to Upside BreakoutAs highlighted in my previous ADA analysis, I’ve maintained a bullish bias, recommending buys below 0.80 USD. Since then, price has indeed revisited the 0.80 support zone and rebounded strongly.
More importantly, since mid-August, ADA has been consolidating within a symmetrical triangle. Technically, this is a continuation pattern, and given that the broader trend from 0.50 (mid-June) has been constructive to the upside, probabilities favor an eventual bullish breakout.
Key Levels & Plan:
✅ Bullish bias remains intact above 0.80 USD
⚡ Breakout confirmation above 0.95 USD (recent resistance)
🎯 Upside target: 1.30 USD – a reasonable and achievable objective if momentum extends
Conclusion: Until proven otherwise, ADA’s structure suggests an upside continuation once resistance gives way. A breakout above 0.95 would serve as the clear green light for further gains. 🚀
Ethereum Elliott Wave Buy Setup: Targets 4550 and 4600Ethereum Daily Update (Elliott Wave Setup)
Based on my daily monitoring of Ethereum and according to the Elliott Wave count (which I’ll share shortly with the full analysis), I see a long opportunity forming.
Here’s my personal trade plan:
✅ Entry 1: Buy from current price 4450 / 4445
✅ Entry 2: If price dips, add another buy at 4400
🎯 Target 1: 4550
🎯 Target 2: 4600
Stop-loss: For both entries, a daily close below 4350
Please note:
This is not financial advice – I’m only sharing my personal trades.
Always do your own research before taking action.
👍 Don’t forget to like if you found this useful, and feel free to follow me for more analysis of this kind.
Best of luck 🌹

XAGUSD Holds 41.40 Strong – Bulls Ready for 43 AgainAs I’ve often highlighted in my previous Silver outlooks, OANDA:XAGUSD usually offers cleaner technical setups than Gold, with less “noise” and fewer manipulation spikes. This time is no exception.
After touching the 43.00 zone, Silver entered a corrective phase, sliding down to 41.40 – a key confluence support. Price tested this level no less than four times, and each time buyers stepped in, eventually pushing the market higher.
Much like in Gold, this drop from the highs should not be mistaken for a trend reversal. Instead, it’s a healthy correction inside a strong uptrend. Based on the price action, we can now argue that the correction is likely complete.
📊 Trading plan:
• My strategy is to buy dips, ideally around the 41.80 zone.
• First target remains the 43.00 resistance area.
• Invalidation (negation) comes only with a daily close below 41.50.
In short, Silver has shown resilience at support, and unless 41.50 breaks, I stay with the bulls. 🚀

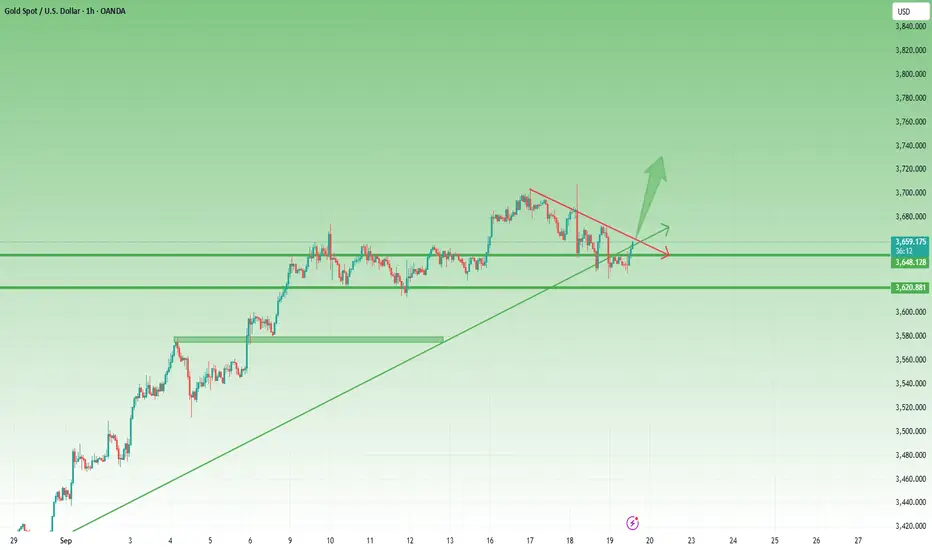
Bulls Defend 3630 zone – Is the Reversal Already Starting?In my yesterday’s analysis, I argued that Gold could extend its correction towards 3620 and even 3570 if the move deepened.
Indeed, during the day, price reached a new local low at 3628 before reversing sharply higher.
For several sessions now, I have been pointing out the risk of a correction. But the main message remained clear: this is only a correction within a much larger bullish trend.
So the key question today is: Is the correction over?
📊 Chart observations:
• The structure is corrective, with overlapping price action.
• After the Fed-triggered drop to 3635, price dipped again to 3628, and once more last night to 3632. Each of these dips has been quickly bought back, showing strong bull interest around the 3630 zone.
• Despite this, we are still under the falling trendline, which means caution is required.
⚖️ Trading stance:
This type of price action prompted me to close my short trades with around +550 pips profit. For now, I am adopting a wait-and-see approach but with a bullish bias in mind.
🟢 Two bullish scenarios I’m working with:
1. A fresh dip towards 3620 could provide a buying opportunity, as I would expect bulls to step in again.
2. If the price stabilizes above 3665–3670, I will consider the correction complete and start looking for long entries on strength.
At this stage, patience is key. Let the market show its hand, but the evidence suggests that the bullish trend is preparing for another leg higher. 🚀
Undeads (UDS) Bullish Setup: Targeting 3 USD After CorretionSince the beginning of September, UDS (Undeads) has delivered a nice rally of more than +50%, showing strong momentum and growing interest from both gamers and investors.
Built on a solid GameFi and Web3 foundation, Undeads combines a metaverse economy, staking, NFTs, and a post-to-earn model that keeps the community engaged and expanding.
With the native UDS token at the core of the ecosystem, every step of the game’s evolution drives fresh demand: from in-game purchases to staking rewards and community participation.
What makes this project even more attractive is its growing fan base and accessibility, with the game available on Steam, opening the door to mainstream adoption. At the same time, staking opportunities and play-to-earn mechanics add a strong incentive to hold UDS, reinforcing its long-term value proposition.
The fundamentals remain bullish, positioning UDS as one of the standout performers in the GameFi sector. 🚀
________________________________________
Key Question
Is this just the beginning of UDS’s bullish run, or will the current correction push prices lower before the next breakout?
________________________________________
Why a Healthy Correction is Good
• 2 USD resistance: Price just tested this area twice, creating a double top before pulling back.
• Support retest: The 1.35–1.30 zone, which acted as resistance since late August, is now turning into support – a classic technical setup.
• Higher lows structure: Since April, UDS has consistently made higher lows, confirming the broader bullish trend remains intact.
________________________________________
Trading Plan
The correction we see now could provide a better entry zone around 1.35–1.30, aligning with both technical and structural support. As long as this zone holds, bulls remain in control.
A soft target for this bullish scenario stands around 3 USD, which would represent the next key resistance and a natural profit-taking zone for short-term traders.
________________________________________
Final Thoughts
UDS combines strong fundamentals with a clear technical structure: bullish trend, healthy corrections, and expanding adoption. If the 1.35–1.30 support zone holds, we may see the next leg higher toward 3 USD in the weeks ahead.

GBPUSD Rejection at 1.3727 – Sell Rallies, Eye 1.32In my previous analysis on FX:GBPUSD , I highlighted the 1.3600 zone as a key resistance area that could trigger a reversal and open the way towards 1.3200.
I initially took a short position, but as the buying pressure persisted, I closed the trade with a 40-pip loss and stepped aside, keeping my medium-term bearish view unchanged.
That decision proved correct: yesterday the pair spiked to a local high at 1.3727, only to reverse sharply and leave behind a long-tailed bearish Pin Bar — a strong technical signal of rejection at the highs.
My bias remains the same: I expect the market to eventually move lower and test the 1.3200 area.
📉 Trading Plan: I will look to sell rallies, with confirmation of downside acceleration coming on a break back below 1.3550.

XRPUSD: Buy the Dips Above 2.90, Target the ATHAfter printing a new all-time high at the end of July, COINBASE:XRPUSD entered a correction phase that bottomed in early September around 2.70.
From there, the rebound was strong: price broke above the falling trendline and, even more importantly, reclaimed the 3.00 psychological level.
Looking at the broader chart structure since June, the picture is constructive and it’s reasonable to expect further upside — potentially a retest of the previous ATH, or even the making of a fresh one.
📈 Bias: I remain bullish on XRP as long as price holds above 2.90.
🎯 Trading Plan: The strategy here is to buy dips, with the old ATH as the first big target.

Bitcoin Under Pressure, Correction or Breakout Ahead ?Regarding the overall trend, BTC is currently in a corrective phase after a strong rally from March to July, and is now facing a key resistance zone between 114,500 – 117,500 USDT.
🔸 The price failed to break the recent high at 117,500.
🔸 A clear supply order block is visible between 116,500 – 117,300 USDT, acting as strong selling pressure.
🔸 There’s also a partial Fair Value Gap (FVG) between 111,000 – 113,000 USDT, which may get retested.
📈 If BTC breaks above 117,500, the likely scenario is a rally toward the major resistance at 124,000 USDT, where a potential Double Top formation may occur with a possible failed second high.
📉 On the other hand, if support at 114,500 is broken, the price could head toward the strong support zone around 110,000 – 107,000 USDT.
💡 Trade Idea (Short-Term):
Entry: Sell from price ~117,500
🎯 TP1: 114,600 (Consider closing 50% here)
🎯 TP2: If 114,600 breaks, hold the remaining position for a move toward 110,000
SL: Daily close above 117,500 (If this happens, trend flips bullish and a long trade toward 124,000 can be considered).
Please note:
This is not financial advice – I’m only sharing my personal trades.
Always do your own research before taking action.
👍 Don’t forget to like if you found this useful, and feel free to follow me for more analysis of this kind.
Best of luck 🌹

XAUUSD Reversal Signs Grow – Bears Eye 3620/3570In yesterday’s analysis, I pointed out that while OANDA:XAUUSD remains technically bullish, the signs of a potential reversal were already piling up.
That view played out quickly: after spiking above 3700 on the Fed’s decision — which triggered my sell orders — gold reversed sharply, dropping all the way to a local bottom near 3645.
The market then staged a natural rebound after such a violent sell-off, and at the time of writing, price is consolidating around 3655. Interestingly, this was last week’s resistance, now acting as short-term support.
Looking ahead, I believe the correction of the nearly 4,000-pip rally in less than a month is far from over. A fresh drop could be next.
For the bears, the key levels to watch are:
• 3620 – the first checkpoint for potential downside continuation
• 3560-3670 – a stronger support zone I’ve highlighted before, aligning with the 38% Fibonacci retracement of the latest rally
A move towards these levels would still be a healthy correction within the broader bullish context — not at all an out-of-the-question scenario. 🚀

Gold Bulls Walking on Thin Ice1. Yesterday’s action
In yesterday’s analysis I said that although the chart looks bullish, Gold bulls should be very careful. After all, price had already climbed 4,000 pips in less than a month, and such complacency usually doesn’t end well.
During yesterday’s session, XAUUSD spiked above 3700, quickly reversed, and touched the newly formed support at 3675. From there, price attempted another push higher. Now we are once again back at support.
2. Key question
Will the 3670 zone hold, or are bulls about to lose control of the market?
3. Why caution is needed
• The chart is still bullish overall, but the structure is becoming increasingly concerning.
• If bulls lose the 3670 zone, I don’t expect a quick rebound from 3650.
• Instead, the market is more likely to continue lower, with at least a move toward 3620.
4. Trading plan
• From my perspective, buying here is very risky, even riskier than selling.
• I remain out of the market, waiting for a GOOD entry to sell.
• My target is a 700–1000 pip as usual, which I believe will come to the downside, not the upside.
5. Conclusion
Gold’s chart may still look bullish, but risk is shifting quickly. Chasing longs here could be dangerous — patience and discipline are key until the right sell opportunity appears 🚀

NZDUSD: A Slow Pair, but a Clear Setup1. What happened before
Although NZDUSD has been a very slow mover lately, the pair remains highly technical. Looking back, the broader downtrend started in 2014, with the decline visible on the chart since 2021. The most recent leg down began exactly one year ago and ended in April at 0.55 – a level that coincided with both the pandemic low and the October 2022 bottom.
2. Key question
Has NZDUSD finally built a foundation for a bullish continuation, or will the market remain trapped in its slow range?
3. Why upside continuation looks possible
• The rebound from April low reached 0.61 resistance before pulling back.
• Importantly, the pullback stopped at 0.58, forming a higher low and aligning with an old support.
• The new rise that followed confirms strong demand at 0.58, suggesting momentum may continue to the upside.
4. Trading plan
• The pair is bullish above 0.58.
• First upside target: 0.61 resistance.
• Longer-term soft target: 0.64.
• Patience is required – NZDUSD is a slow pair, and such a move needs time to develop.
5. Conclusion
NZDUSD might not be the fastest market, but its technical precision makes it worth watching. Above 0.58, the bias stays bullish, with the market slowly but surely building a case for higher levels 🚀

EUR/NZD – Trendline Broken, Bears Warming UpAfter touching the psychological 2.00 handle once more at the end of August, EUR/NZD started to fall. Last week, the pair finally broke below the rising trendline that had been intact since June — a technical signal that momentum is shifting.
Following the recent low at 1.9627, the pair is now in a normal rebound. But rebounds after a trendline break are often just pauses before continuation. Once this corrective move is complete, I expect fresh downside pressure to return.
My trading plan:
• Look to sell rallies into resistance.
• Expect at least a 500-pip decline, targeting the 1.9200 support zone.
• The bearish scenario remains valid as long as price stays below 1.9950.

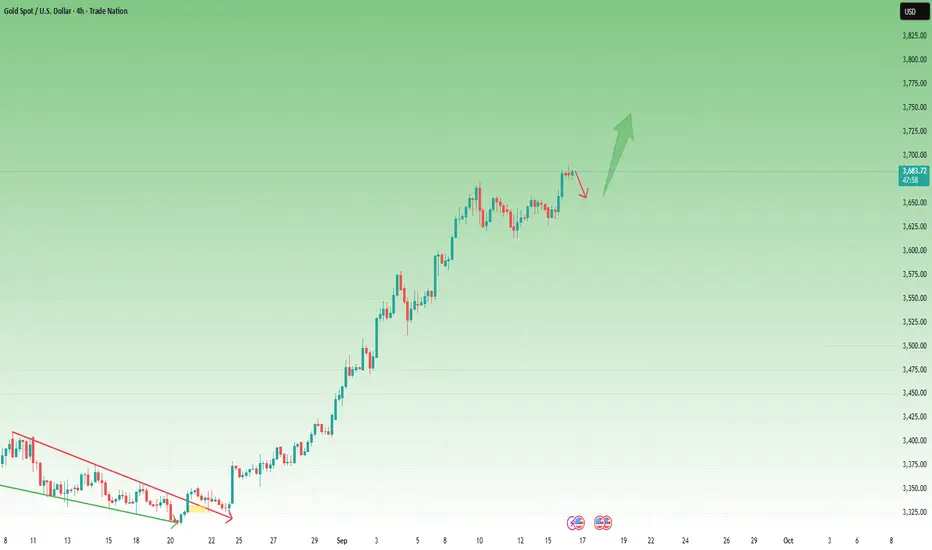
Complacency Before the Fall? Bulls in Control, But For How Long?Yesterday, I was debating whether last week’s consolidation was a rectangle (suggesting continuation) or, in fact, a triple top (hinting at correction). I began the session with a slightly bearish bias, but the reversal from support and the subsequent breakout above the consolidation’s resistance forced me to reevaluate. The breakout was clean, momentum followed, and the market even printed a new ATH at 3689.
Unfortunately, my pending buy order wasn’t filled, so I remain flat for now—an important reminder that in trading, sometimes discipline keeps you safe, even if you miss an opportunity.
Technical outlook:
• Price broke above resistance, confirming bullish control.
• The 3660 zone now acts as key support—any dips into that area can be treated as potential buying opportunities.
• The measured target for this breakout points toward 3710, which could represent the next objective for the bulls.
But here’s the psychological twist:
The market feels euphoric and complacent at this moment. Historically, reversals from this type of mindset tend to be brutal. Traders get comfortable, start believing in endless uptrends, and that’s exactly when the trapdoor opens.
Medium-term, I still anticipate a significant correction. Timing it is always the hardest part, but acknowledging the risk helps keep emotions under control. For now, bulls clearly hold the wheel—but they may not realize they’re driving toward a cliff.
🚀 Stay sharp, trade the trend, but don’t forget that markets punish overconfidence.
XAU/USD Stalls Slightly above 3650 – Bulls Losing Steam?Gold printed fresh all-time highs at 3674 last week, only to reverse sharply and settle into a sideways structure between 3620–3655.
The current debate: is this simply a consolidation box that will fuel another breakout, or is the market quietly building a distribution top that could resemble a triple top pattern (if we ignore the spike to ATH)?
Technically, the momentum has clearly cooled. The 3355–3360 area continues to cap the upside, turning into a stubborn barrier that bulls haven’t been able to overcome.
From a fundamental angle, the Fed’s rate cut is already baked into the price. The focus is now on Powell’s guidance. With inflation pushing higher, a cautious and balanced tone is more likely than a dovish surprise.
Cross-checking with other pairs, XAU/EUR and XAU/GBP are already pressing their support levels. That relative weakness suggests the gold complex as a whole may be closer to a downside break than to a new leg up.
For now, I’m flat. But unless bulls regain control quickly, I’ll be watching for failed rallies after London open as potential short setups.

Bitcoin to $150K ? Mining Difficulty Holds the KeyUnlike Ethereum, Bitcoin’s mining difficulty has always marched higher alongside price. This natural cycle reflects a simple truth: as the price climbs, more miners join the network, competition grows, and blocks become harder to produce.
📈 Historical Patterns
2017 Bull Run → Price exploded while difficulty surged. Even after corrections, difficulty never reversed its long-term uptrend.
2021 Recovery → Despite China’s mining ban, difficulty quickly rebounded to new highs, fueling Bitcoin’s rally back from $30K.
2023–2025 Cycle → With Bitcoin pushing to new records, difficulty has now reached an all-time high of 136T, signaling massive investment and long-term confidence.
Why Rising Difficulty Is Bullish
Miner Confidence → Expanding operations show miners expect higher prices ahead.
Reduced Selling Pressure → Higher costs mean miners prefer to sell at elevated levels, reinforcing upward momentum.
Proven Signal → Historically, price accelerations often followed major spikes in difficulty.
The Short-Term Risk
If prices stagnate while costs rise, weaker miners may shut down, creating temporary selling pressure. But historically, this has only made the network stronger and healthier over time.
Outlook: $150K and Beyond?
With Bitcoin trading around 115K and strong support $110K and difficulty at historic highs, the setup resembles past cycles that led to explosive upside. Each surge in difficulty has paved the way for new price records — making $150,000 look less like a dream and more like the next logical step.
🔥 Bottom Line: Record-high mining difficulty has consistently been a medium-to-long term bullish signal. If history rhymes, Bitcoin could be gearing up for its next major leg higher — and $150K might just be the beginning.
Do you think Bitcoin will hit $150K this cycle?
This post is for educational and informational purposes only and should not be considered financial or investment advice.
Always do your own research .
Best Regards

XRP Bulls Are Back, Double Bottom + Divergence Signal Uptrend
XRP , After failing to break the previous low, which acted as a strong support at $2.7280, XRP has formed a Double Bottom pattern. This is a powerful bullish signal expected to push the price higher.
The price is currently rising to test the daily descending trendline shown in the chart, with a potential target of the $3.04000 zone. The bullish move is also confirmed by a Divergence pattern on the daily chart.
Additionally, the daily RSI shows an overbought signal, which can be a sign of strong buying pressure. This movement is also supported by the overall daily uptrend illustrated in the chart.
🔔 Summary:
Key Factors Supporting an Upside Move
Double Bottom Pattern
Daily Divergence
Uptrend
Daily RSI Overbought Signal
✅ Write a comment with your favorite altcoin hit the like button, and I'll provide my analysis in the reply. Trading is simpler with the right coaching.
My analyses are personal opinions, not trade setups.
Thank you for your support, and I wish you successful trades 🌹

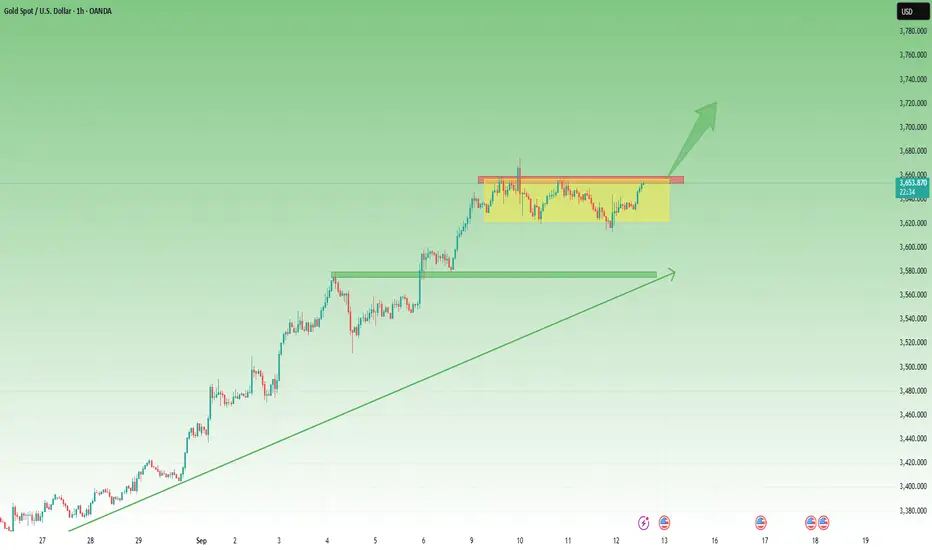
Gold Analysis – Is the Correction Over?Yesterday I maintained my bias that OANDA:XAUUSD correction could extend lower, with 3570 as the focus for the next swing low. I even sold rallies above 3640 zone with that scenario in mind.
However, after the CPI release, Gold dipped to 3620 zone but quickly recovered. That prompted me to lock in a modest 100 pips gain rather than fight the market.
A wise move in hindsight, since Gold is now back testing the 3650+ resistance zone.
So, is the correction finished?
➡️ Most probably, yes.
Here’s why:
• Bulls are defending the 3620 zone, stepping in strongly on dips.
• The chart is shaping into a rectangle, typically a continuation pattern, which suggests consolidation before trend resumption.
• Momentum is aligning again with the broader bullish trend.
Trading Plan:
• As long as 3620 holds, my strategy shifts to buying dips instead of selling rallies.
• A break above 3660 would open the path for continuation, with 3700 as the next bullish milestone.
The market has spoken – the correction seems to be losing steam, and the trend is ready to reassert itself. 🚀
GBPUSD Faces Strong Ceiling at 1.36 – Drop to 1.32 Ahead?The first half of this year was strongly bullish for GBPUSD, with the pair climbing from 1.20 to 1.37 — a rally of nearly 1,700 pips (14%).
However, after topping in July, cable corrected around 600 pips, only to find solid support at 1.32 in August. From there, a rebound followed, pushing price back up to 1.36 by the end of the month.
Looking at the chart, we can see a clear technical picture: while GBPUSD has rebounded from support, it has also formed a very strong ceiling at 1.36. This zone has now been reinforced by a bearish pin bar printed just two days ago.
Going forward, as I already highlighted in my DXY analysis, I expect a rebound in the USD — and this will almost certainly translate into a drop in cable.
From a purely technical standpoint:
• 1.36 = strong resistance, validated by the pin bar and multiple rejections.
• 1.34 is the first support and can act as a soft target.
• In the medium term, I expect GBPUSD to revisit 1.32.
The strategy is clear: sell the rallies into resistance, as the pair appears to be at the beginning of a corrective leg lower. 🚀

TIA Consolidation Ends? Bulls Eye 2.2 First, Then 4.0In my previous analysis, I mentioned that I am bullish on BINANCE:TIAUSDT , expecting the coin to recover at least part of the ground lost since the start of 2024.
So far, we haven’t seen real acceleration to the upside, but the price action is encouraging:
• Dips have been well defended around the 1.5 zone.
• The recent low stands above the July low, suggesting buyers are stepping in earlier.
• Two days ago, price finally managed to break above the falling trendline, a technical step in the right direction.
Putting these elements together, I maintain my bullish outlook. The first soft target for this move is 2.2.
But the real inflection point comes there: if TIA manages to stabilize above 2.2, a level that acted as support in early 2025 and resistance in late July, then the door opens for a much stronger rally. In that case, a reasonable target would be 4.0, with momentum likely to pick up sharply.
