EURCHF SHORT FROM SUPPLY AREA|
✅EURCHF is tapping the higher-timeframe supply after sweeping buy-side liquidity. A corrective drop into the imbalance is likely as algos rebalance before targeting downside liquidity.
Time Frame 6H.
SHORT🔥
✅Like and subscribe to never miss a new idea!✅
Signals

USD-JPY Local Short! Sell!
Hello,Traders!
USDJPY is tapping the horizontal supply after a sweep of internal liquidity, signaling distribution. If rejection confirms, expect a drop toward the next sell-side liquidity zone.
Time Frame 1H.
Sell!
Comment and subscribe to help us grow!
Check out other forecasts below too!
Disclosure: I am part of Trade Nation's Influencer program and receive a monthly fee for using their TradingView charts in my analysis.

ADA/USDT | Cardano Slides to 0.38 and Bears Keep Pushing!By analyzing the CRYPTOCAP:ADA chart on the 3 day timeframe, we can see that price finally dropped to 0.38, which confirms the bearish pressure we talked about earlier. ADA is now trading near 0.40 and the chart still looks weak. Buyers are not showing real strength and momentum is clearly on the sellers’ side.
If the drop continues, the next downside target I am watching is 0.36. Make sure you monitor price reaction at this level.
From my perspective, the 0.32 to 0.36 zone is a possible long term accumulation area for investors who use proper risk management and do their own research (DYOR).
For now the bias stays bearish until ADA reclaims strong levels with real demand.
Please support me with your likes and comments to motivate me to share more analysis with you and share your opinion about the possible trend of this chart with me !
Best Regards , Arman Shaban

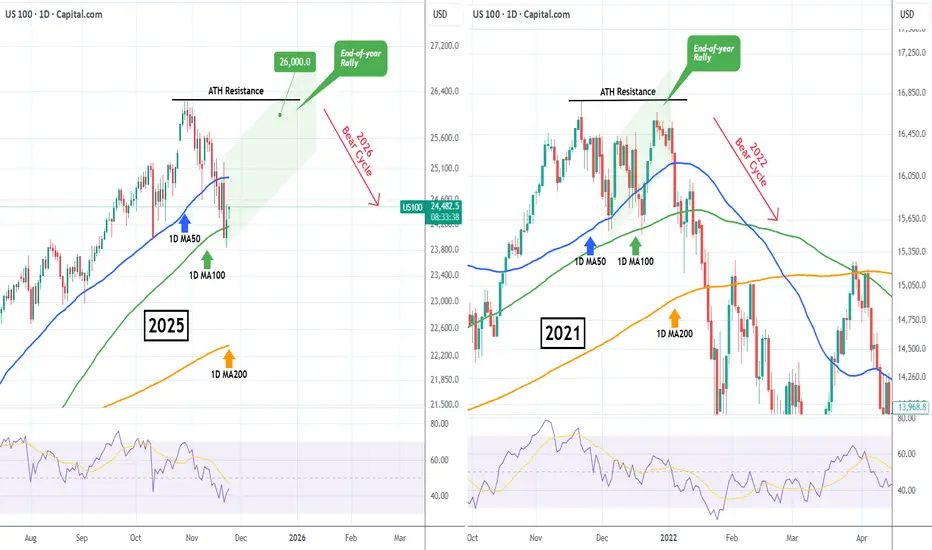
NASDAQ Santa Rally back to 26000 started?Nasdaq (NDX) rebounded on Friday after marginally breaching below its 1D MA100 (green trend-line) for the first time since May 09! The continuation today is a sign of a potentially strong rebound, the traditional end-of-year rally that is know as 'Santa's rally'.
Based on the 2021 Bull Cycle, which after touching its own 1D MA100 it started a final rally that almost tested its ATH Resistance, we can expect Nasdaq to now rise towards the end of the year to potentially 26000.
Could this be the last rally before a new Bear Cycle in 2026?
---
** Please LIKE 👍, FOLLOW ✅, SHARE 🙌 and COMMENT ✍ if you enjoy this idea! Also share your ideas and charts in the comments section below! This is best way to keep it relevant, support us, keep the content here free and allow the idea to reach as many people as possible. **
---
💸💸💸💸💸💸
👇 👇 👇 👇 👇 👇
TRON below its 1W MA50 after 2.5 years! Is Bear Cycle confirmed?Tron (TRXUSD) closed last week below its 1W MA50 (blue trend-line) for the first time since March 20 2023. Those +2.5 years it has been riding the new Bull Cycle within a Channel Up that peaked on the December 02 2024 1W candle, around the majority of the altcoin market.
The current 1W MA50 break seems similar to the December 13 2021 one that was also initiated after a 0.236 Fibonacci level rejection and confirmed the subsequent Bear Cycle. With the 1M RSI brutally falling below its MA, we believe the market may have again confirmed the new Bear Cycle and the next target (as then) is the 1W MA100 (green trend-line).
Our long-term projection for a Cycle bottom is the 0.786 Fib, unless the 1W MA200 (orange trend-line) gets hit after August 2026. If not we believe the market may bottom around at least 0.16500, which is still a more optimistic scenario as it falls even above the 0.5 Fibonacci retracement level from the November 14 2022 (previous) bottom.
---
** Please LIKE 👍, FOLLOW ✅, SHARE 🙌 and COMMENT ✍ if you enjoy this idea! Also share your ideas and charts in the comments section below! This is best way to keep it relevant, support us, keep the content here free and allow the idea to reach as many people as possible. **
---
💸💸💸💸💸💸
👇 👇 👇 👇 👇 👇

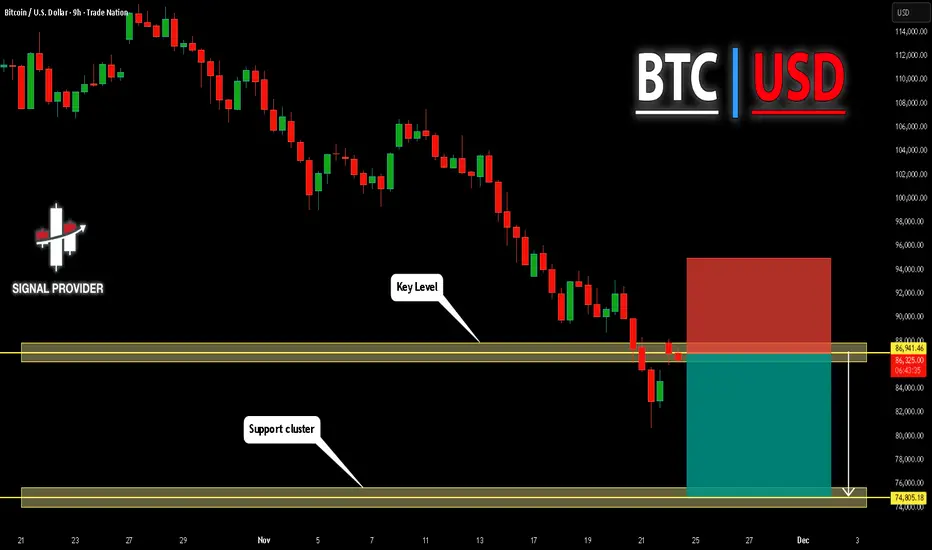
BITCOIN Will Fall! Sell!
Please, check our technical outlook for BITCOIN.
Time Frame: 9h
Current Trend: Bearish
Sentiment: Overbought (based on 7-period RSI)
Forecast: Bearish
The market is approaching a significant resistance area 86,941.46.
Due to the fact that we see a positive bearish reaction from the underlined area, I strongly believe that sellers will manage to push the price all the way down to 74,805.18 level.
P.S
Please, note that an oversold/overbought condition can last for a long time, and therefore being oversold/overbought doesn't mean a price rally will come soon, or at all.
Like and subscribe and comment my ideas if you enjoy them!
USDJPY Will Go Down From Resistance! Short!
Here is our detailed technical review for USDJPY.
Time Frame: 6h
Current Trend: Bearish
Sentiment: Overbought (based on 7-period RSI)
Forecast: Bearish
The market is on a crucial zone of supply 156.909.
The above-mentioned technicals clearly indicate the dominance of sellers on the market. I recommend shorting the instrument, aiming at 155.044 level.
P.S
The term oversold refers to a condition where an asset has traded lower in price and has the potential for a price bounce.
Overbought refers to market scenarios where the instrument is traded considerably higher than its fair value. Overvaluation is caused by market sentiments when there is positive news.
Like and subscribe and comment my ideas if you enjoy them!

EURAUD Will Go Lower! Sell!
Take a look at our analysis for EURAUD.
Time Frame: 4h
Current Trend: Bearish
Sentiment: Overbought (based on 7-period RSI)
Forecast: Bearish
The price is testing a key resistance 1.785.
Taking into consideration the current market trend & overbought RSI, chances will be high to see a bearish movement to the downside at least to 1.777 level.
P.S
We determine oversold/overbought condition with RSI indicator.
When it drops below 30 - the market is considered to be oversold.
When it bounces above 70 - the market is considered to be overbought.
Like and subscribe and comment my ideas if you enjoy them!

CADJPY Will Go Up! Long!
Please, check our technical outlook for CADJPY.
Time Frame: 3h
Current Trend: Bullish
Sentiment: Oversold (based on 7-period RSI)
Forecast: Bullish
The market is trading around a solid horizontal structure 111.244.
The above observations make me that the market will inevitably achieve 112.283 level.
P.S
Overbought describes a period of time where there has been a significant and consistent upward move in price over a period of time without much pullback.
Like and subscribe and comment my ideas if you enjoy them!

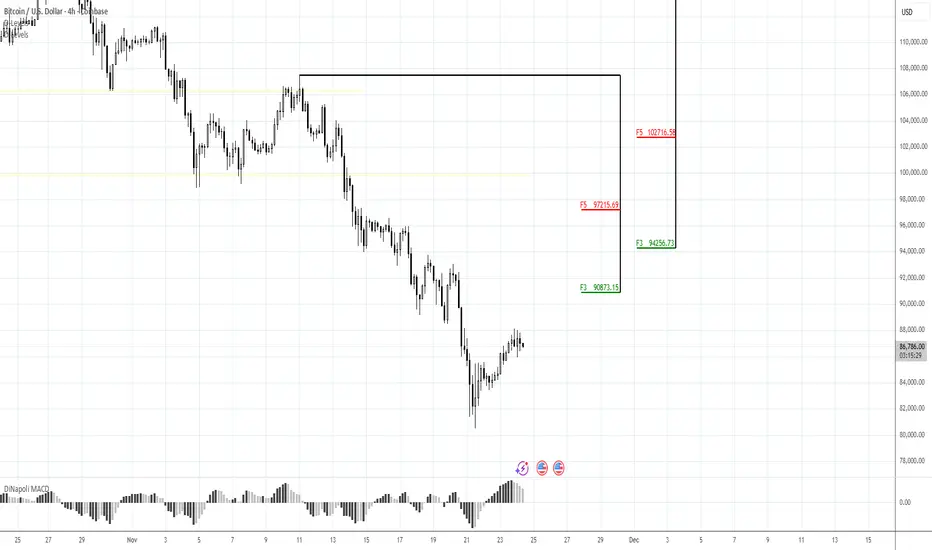
90-91K POTENTIALLY INTERESTING FOR SELL.Morning folks,
So, our DRPO "Buy" pattern has failed. This shows is how strongly market depressed, and here we see non-market driving factors. Now we suggest that the really big game is ready to start. On weekly chart 2/3 parts of H&S is already in place. And it will be quite interesting to see what will happen in nearest 2-3 months.
In short-term, market has completed our 79K target on daily chart of the same downside AB-CD pattern. BTC is oversold now on all time frames. At the same time, the price shape here is not bullish - too slow and choppy. It's just a technical bounce. So, we think that 90-91K resistance area might be interesting for potential short entry with the minimum target around 84K - downside momentum on daily chart is rather strong.
Below 51, Silver Remains Heavy – Watching 47.50 Next1. What Happened After Last Week’s Call
As expected — and exactly as outlined in last week’s analysis — Silver reversed sharply from the sell zone above 52, dropping nearly 4,000 pips from that level.
This was a textbook reversal from resistance, confirming that the 52+ area is a major rejection zone for the metal.
After the drop:
- Price reclaimed the 49 support, showing short-term stabilization,
- But failed to regain the 50.50 zone, which was crucial for a genuine bullish recovery.
- Instead, Silver has now slipped into a sideways consolidation, showing hesitation and lack of strong buyers.
2. Current Market Context – Not the Same as Gold, but Still Bearish
While Silver’s structure is not identical to Gold’s, it shares the same underlying message:
➡️ The market is heavy, not neutral.
Key observations:
- The rebound lacked momentum.
- Every rally since the drop has been corrective, not impulsive.
- The failure at 50.50–51.00 confirms that sellers are still defending this zone aggressively.
This leaves Silver stuck under resistance with a bearish tone, despite the temporary bounce above 49.
3. Technical Outlook – Preparing for the Next Leg Down
Resistance zone:
50.50 – 51.00
This remains the decisive ceiling.
As long as Silver stays below this band, the market structure is bearish, and every rally into this area is a sell opportunity.
Support zone:
49.00
A key reference point.
If Silver breaks below 49 again, sellers will likely push aggressively.
Downside target:
47.50 zone
This is the next major support, and the most logical destination for a completed second leg down.
Given the current rhythm of the market, a drop into this zone is highly plausible if 49 gives way.
4. Trading Plan – Clear, Simple, Disciplined
- Sell rallies into 50.50–51.00 resistance
- More confirmation if price approaches 49 again
- If 49 breaks, expect a continuation toward 47.50
Bias changes only if Silver reclaims 51 with strong buying (low probability for now)
No need to overcomplicate this setup — the market is offering clear technical boundaries.

Lingrid | GOLD Weekly Analysis: Coiled Spring at Key CrossroadsOANDA:XAUUSD price action has settled into a tense, range-bound struggle, repeatedly testing the ascending trendline that has defined its path since late October. This persistent retest is a double-edged sword: while it demonstrates underlying buying interest, it also signals exhaustion and a growing risk of failure. The market is now at a critical juncture where the next decisive move will determine the immediate direction. A close below this trendline would be a significant bearish signal, such a break often triggers a deeper corrective pullback to complete an ABC pattern. Conversely, a strong breakout above the recent lower high near $4,130 could reignite the bullish momentum and target the $4,200 resistance zone.
The broader structure on the 4-hour chart reveals a clear downward channel forming from the peak in mid-October, with price currently trapped between the channel’s upper boundary and the ascending trendline support. This creates a tightening triangle pattern, a classic consolidation formation that typically precedes a sharp, directional move. Key levels to watch are the immediate support around $4,020 and the more substantial monthly low near $3,930. The current corrective move phase suggests the market is digesting prior gains, and the upcoming catalyst—whether it’s a fundamental driver or pure technical exhaustion—will likely force a resolution. The repeated tests of resistance near $4,230 have so far been unsuccessful, reinforcing the view that bulls lack the conviction to push higher without a catalyst.
For us the strategy is simple: wait for the breakout. The neutral stance is warranted as long as price remains within the converging trendlines. A close below the ascending trendline would be a clear sell signal, targeting the $3,930 support area. On the flip side, a sustained move above $4,150, especially with increasing volume, would be a buy signal, opening the path toward $4,200 and potentially $4,300. Until then, the market is in a holding pattern, with the balance of power shifting with every candle. The key takeaway is that the longer price trades in this narrow range, the more explosive the eventual breakout is likely to be, making patience the most valuable tool for navigating the coming week.
If this idea resonates with you or you have your own opinion, traders, hit the comments. I’m excited to read your thoughts!

GOLD market after “Fed fever”, growth momentum is challengedOANDA:XAUUSD prices remain in the spotlight as the market has been experiencing a series of strong fluctuations following mixed signals from the Federal Reserve and labor data. However, developments show that the risk of price declines is increasing as the precious metal has repeatedly failed in its efforts to hold the $4,100/ounce area, the first resistance level of this year's hot period.
For most of 2025, gold has risen more than 55%, despite high bond yields and a strong dollar. But as the Fed’s final policy meeting approaches and the market lacks consensus on the path of interest rate cuts, the traditional correlation between gold, interest rates, and the dollar is returning. According to CME’s FedWatch, the market still expects a more than 70% chance of the Fed cutting interest rates next month, while economists maintain a more cautious assessment of only about 50/50.
This puts the upcoming economic data in a decisive position for both market expectations and gold’s stability in this trading week.
Fed’s Dovish Return: A Direct Impact on Gold’s Upward Momentum OANDA:XAUUSD
Gold settled in the first half of the week as demand for havens increased, while the ADP report showed that the private sector cut an average of 2,500 jobs per week in the four weeks to November 1.
The 4,000 USD/ounce level continues to be the key threshold determining the short-term trend, as the market is moving within a correction zone but has not yet broken the medium-term bullish structure.
Technical analysis and suggestions OANDA:XAUUSD
1. Price Structure & Overall Trend
• Price is still within the ascending channel that has extended since August, although the range has narrowed compared to October. The October peak around 4,128 USD acts as a major medium-term resistance.
• The current decline is still only a pullback within the uptrend, as long as price holds above 3,972 USD (Fib 0.382) and especially the 4,000 USD psychological & technical support.
2. Key Technical Zones
• Nearest resistance: 4,128 – 4,216 USD
(A strong resistance cluster where price has been repeatedly rejected in November.)
• Nearest support: 4,055 – 4,000 USD
(This zone aligns with Fib 0.382 and the short-term bottom.)
• Deeper supports:
3,846 USD (Fib 0.5) – Important for a deep pullback scenario
3,720 USD (Fib 0.618) – Reaction support in case of strong macro volatility
3. Price Momentum – RSI
• RSI has moved out of oversold territory but remains weak and has not re-established a bullish structure.
• The RSI-MA21 is flat → the market lacks strong momentum; sideways movement or a retest of the 4,000 USD zone is highly likely.
4. Short-Term Outlook (Next Week)
• Market bias: Neutral to slightly bearish, but the medium-term uptrend remains intact.
• Price is likely to retest 4,000 USD, then form one of two scenarios:
o Hold 4,000 → rebound to 4,128 – 4,216 USD
o Break 4,000 → drop to 3,972 – 3,846 USD
👉 Conclusion: 4,000 USD is the decisive level for the short-term trend.
BUY XAUUSD PRICE 4102 - 4100⚡️
↠↠ Stop Loss 4106
→Take Profit 1 4094
↨
→Take Profit 2 4088
SELL XAUUSD PRICE 4016 - 4018⚡️
↠↠ Stop Loss 4012
→Take Profit 1 4024
↨
→Take Profit 2 4030

Lingrid | BTCUSDT April Lows Revisit - Possible Reversal ZoneBINANCE:BTCUSDT is rebounding from the major support zone near 82,300 after completing a full extension inside the downward channel. Price is now pressing into the descending trendline — a level that has capped every bullish attempt since early November. The market is forming a higher-low structure on the retest, hinting at an early accumulation phase.
From a fundamental side, Bitcoin is stabilizing as ETF inflows recover and risk sentiment improves after softer U.S. data this week, reducing pressure on high-beta assets. If buyers manage to break above the descending trendline and reclaim 93,300, this would confirm the start of a bullish recovery cycle.
➡️ Primary scenario: Break above the trendline → move toward 93,300.
⚠️ Risk scenario: Failure to break the trendline sends CRYPTOCAP:BTC back to for another liquidity sweep.
If this idea resonates with you or you have your own opinion, traders, hit the comments. I’m excited to read your thoughts!

Gold Dancing Around 4050– Will the Market Rhyme With Last Month?1. Recap of Last Week’s Price Action
Last week started with a fake attempt at recovery:
Gold reversed early in the week back above 4100, reaching a local high around 4133.
From there, sellers stepped back in and pushed the price lower, bringing us once again into the familiar 4050–4100 range I have been talking about for days.
On Friday, we had a classic whipsaw:
- Price dipped below 4050 support,
- Then reversed sharply and tested 4100 resistance again,
- Only to close the day slightly above support, right back inside the range.
Today, during the Asian session, selling pressure returned and Gold is trading below 4050 support once again. The market is still orbiting this key zone like a magnet.
2. Current Technical Picture – A Heavy Market Hiding Behind a Sideways Range
Right now, the chart shows:
- Well-defined resistance: 4100–4110
- Broken/fragile support: 4050
- Key downside reference: 3900 zone
Even though we are “just” ranging between 4050 and 4100 most of the time, I still see the structure as heavy, not neutral.
The fact that:
- Every bounce above 4100 fails quickly, and
- Every dip below 4050 gets a bit deeper or a bit more frequent,
…suggests that sellers are slowly gaining control, even if there is no clean breakdown yet.
3. Bigger Picture Outlook – Why I Still Expect 3900 📉
My medium-term outlook remains the same:
➡️ I still expect a drop toward the 3900 zone.
Why?
- Failed upside follow-through:
- The reversal back around 4100 looked promising for bulls, but there was no continuation. That kind of failed breakout often precedes a deeper leg down.
Support erosion at 4050:
4050 used to be a clean support. Now it’s constantly pierced, reclaimed, then lost again. When a level is “played with” too much, it often breaks properly later.
Lack of strong bullish candles:
We see bounces, yes, but not the kind of decisive ones that normally start a new leg up.
Because of this, I still see 3900 as the next logical destination once the market finally gives up on this range.
For now, I’m out of the market, waiting patiently to sell rallies, not chase price in the middle.
4. The “Rhyme” With Last Month – A Speculative but Interesting Angle 📅
“Markets don’t repeat, but they often rhyme.”
If we look back at last month’s end-of-month action, there’s an interesting similarity in structure:
- On Thu 23 Oct, we had a low, then a reversal up.
- By Mon 27 Oct, price was back to support around 4050 – yes, the same 4050 zone we’re dealing with now.
- On that Monday, we then got the real break, followed by a 1,500-pip drop into Thu 28 Oct.
Now compare that to the current price action:
- We have a low → bounce → failure → back to 4050 pattern,
- We’re again at (or just under) 4050,
- The broader structure feels like a tired consolidation after an earlier strong move.
Is this a guarantee that we’ll see another sharp fall like last time?
👉 Of course not. This is only speculation and observation.
But the similarity in the structure is worth keeping on the radar, especially considering that:
- We’re again at 4050,
- We’re again in a sideways consolidation after a strong leg down
- And again the market seems to be “deciding” whether to finally break.
If the “rhyme” plays out, we might see:
- A bit more back-and-forth around 4050–4080,
- A clean, decisive break of 4050,
- A more direct move toward 3900 (or even beyond) with less hesitation than now.
5. Trading Plan – What I’m Actually Doing (Not Just Thinking)
Despite the interesting fractal and speculation, my plan stays simple and disciplined:
- I’m currently out of the market – volatility around 4050 is messy.
- I’m looking to sell rallies, especially if we see:
- Price popping back into 4100 area, but failing to hold, or
- Weak, corrective rebounds into resistance after another dip.
I’m not interested in chasing shorts after a big down candle at 4010 or 4000. I want price to come to me, not the other way around.
Target remains: 3900 zone.
If the market gives a similar “impulsive leg” as it did last month, this level can be reached faster than most traders expect.
6. Conclusion – Logic First, Speculation Second
Bias: still bearish.
Key level: 4050 – the market is clearly “fighting” around this line.
Plan: stay patient, sell rallies, target 3900.
The October “rhyme” is just an extra narrative layer – nice to watch, but risk management and levels still come first.
If the market decides to repeat that end-of-month pattern, I’ll be ready. If not, I’ll still trade the levels, not the story. 😊

Gold Fluctuates in Support Range; Accumulation Signals Rise⏰ Timeframe: 30m
📅 Update: 24/11/2025
🔍 Market Context
After a corrective decline from the 4,104 USD area, gold is moving within a range-bound structure with strong support at the 4,003–4,023 USD area.
The market is in a short-term re-accumulation phase, as consecutive CHoCH movements appear around the bottom area — reflecting the buying side's effort to absorb liquidity.
The selling side temporarily controls, but balancing signals are becoming clearer as the price continuously rejects breaking deeply below the Demand Zone.
📊 Technical Structure
Resistance Zone (4,090–4,104 USD): main supply area, confluence with Fibo 1.0, where profit-taking reactions are likely if the price rebounds.
Support Zone (4,023 USD): intermediate support, playing a key role in the current sideways structure.
Demand Zone (4,003 USD): potential demand area, confluence with previous liquidity bottom – main BUY Zone area.
Structure Bias: still inclined towards accumulation – recovery, as long as the price maintains above 4,003 USD.
🎯 Market Outlook
1️⃣ Priority Scenario (Buy setup):
• The price may continue to retest the Demand Zone (4,003–4,023 USD).
• When a clear reaction signal appears, expect a recovery to the Fibo 0.618 → 1.0 area, corresponding to 4,075–4,104 USD.
2️⃣ Secondary Scenario (Breakdown):
• If the price breaks below 4,003 USD, the recovery structure will be invalidated, bringing gold back to the lower liquidity area around 3,985 USD.
💎 Key Zones
BUY Zone: 4,003 – 4,023 USD
SELL Zone: 4,090 – 4,104 USD
🧠 Analyst’s View
Gold is currently in a liquidity re-accumulation phase, as both sides are testing the lower boundary of the main support area.
The buying side needs confirmation with a break above 4,075 USD, while the selling side still holds the advantage if the price cannot maintain above the balance area.
In the current context, price behavior leans towards the “Sweep – Retest – Expansion” model, with the potential for forming a short-term technical recovery wave.
🛡️ Risk Note
The market is in a low volatility area – avoid emotional actions without clear structural confirmation.

Bitcoin Drops Sharply – Is This Bounce Only Temporary?Hello everyone, Bitcoin continues to show weakness on the 4H chart: the bearish structure remains intact, with overlapping red FVGs above and nearly every rebound being rejected quickly. After the sharp fall from the 100,000 USD region, the price is now hovering around 85,000 USD — a level that clearly reflects persistent selling pressure.
Digging deeper into the technicals, BTC remains below the Ichimoku cloud and under several unfilled FVG zones, especially the 87,500–89,000 USD region. This forms a “lower ceiling” where any upward attempt is met with immediate selling pressure. Volume also leans heavily toward the sellers, reinforcing the view that the short-term trend is still firmly bearish. Just beneath the price, the 84,500–84,000 USD area is acting as temporary support; it’s also the nearest liquidity pocket, suggesting a technical rebound may occur.
The broader environment is not helping Bitcoin either. The USD has strengthened following a series of stronger-than-expected US economic reports, from employment data to Big Tech performance. This has pulled capital away from risk assets. US equities continue to attract speculative money, while the Fed has yet to provide any clear signal about rate cuts. Market sentiment isn’t extremely risk-off, but it is discouraging enough to limit Bitcoin’s chances of staging a meaningful reversal.
With all these factors combined, I lean toward one main scenario: Bitcoin may see a technical rebound toward the 87,000–88,000 USD region, where the nearest FVG and an unfinished supply–demand balance lie. However, I still expect this bounce to act merely as a liquidity-grab move before BTC faces renewed selling pressure and revisits the 84,000–82,500 USD zone.
What do you think — is this rebound just a trap before the next leg down?

EURNZD LONG FROM TRENDLINE|
✅EURNZD is approaching the rising trendline after a clean liquidity sweep beneath the prior low, but hasn’t reacted yet. Expect algorithmic buying to step in once we tap the discounted zone, setting up a push toward the higher buy-side liquidity.Time Frame 3H.
LONG🚀
✅Like and subscribe to never miss a new idea!✅

USDCHF WILL KEEP GROWING|LONG|
✅USDCHF taps the demand block and shows displacement, suggesting bullish order-flow returning after liquidity sweep beneath the short-term low. Expect a corrective pullback into the imbalance before targeting the higher buy-side liquidity. Time Frame 1H.
LONG🚀
✅Like and subscribe to never miss a new idea!✅

AUD-USD Correction Ahead! Sell!
Hello, Traders!
AUDUSD swept the lows beneath the demand boundary, grabbing sell-side liquidity before shifting order flow. A corrective pullback into the mitigation zone may fuel a continuation toward the target imbalance. Time Frame 3H.
Sell!
Comment and subscribe to help us grow!
Check out other forecasts below too!
Disclosure: I am part of Trade Nation's Influencer program and receive a monthly fee for using their TradingView charts in my analysis.

AUDUSD FREE SIGNAL|SHORT|
✅AUDUSD price purged liquidity above the internal high and tapped into the H1 supply block. With displacement shifting bearish, I expect a draw towards the next inefficiency before any reaction.
————————————
Entry: 0.64550
Stop Loss: 0.64710
Take Profit: 0.64400
Time Frame: 1H
————————————
SHORT🔥
✅Like and subscribe to never miss a new idea!✅

GBP-USD Free Signal! Sell!
Hello,Traders!
GBPUSD tapped the horizontal supply, swept resting buy-side liquidity and rejected cleanly from the mitigation block, showing displacement to the downside as smart money shifts order flow bearish.
--------------------
Stop Loss: 1.31249$
Take Profit: 1.30706$
Entry: 1.30971$
Time Frame: 2H
--------------------
Sell!
Comment and subscribe to help us grow!
Check out other forecasts below too!
Disclosure: I am part of Trade Nation's Influencer program and receive a monthly fee for using their TradingView charts in my analysis.

GBP-AUD Local Short! Sell!
Hello,Traders!
GBPAUD swept the supply-zone highs in a classic liquidity grab, reclaiming the range and signalling distribution. If bearish order flow holds, price may rotate toward the unmitigated demand below. Time Frame 5H.
Sell!
Comment and subscribe to help us grow!
Check out other forecasts below too!
Disclosure: I am part of Trade Nation's Influencer program and receive a monthly fee for using their TradingView charts in my analysis.
