Pullback After Breakout Entry M15 ApproachIn this model, we define an approach that I personally use a lot, namely the creation of a demand or supply zone on the H4. In this case, we are observing a demand zone. Once the zone has been plotted on the chart, we wait for a retracement on the M15, and as soon as the market shows a structural change, in this case to the upside during the three London, pre-NY, and NY sessions, always considering to have the midnight open behind us, we can enter the market. The target will be the nearest swing high level, always considering to have at least a risk/reward ratio of 1.5. Best regards and have a good day everyone.
Signals

DECODING GANN FAN: HOW TO USE IT IN TRADING👋 Hello, Forex traders! In this post we are going to talk about Gann angles, which many of you know as the Gann Fan. Essentially, they are the same thing. We will learn how to build these angles, what are their essence, and most importantly - how we can apply Gann's Fan in practice in our trading.
What Are Gunn Angles ? 📢
Gann Angles, or Gann Fan, is one of the standard tools present by default in TradingView. The Gann fan indicator includes a sequence of straight lines drawn at different angles with the base at the pivot point. The resulting picture resembles a fan, from which the name of the tool was derived. Each of these lines indicates possible support or resistance levels as the price approaches it.
William Gunn notes that his indicator cannot 100% predict and that the market always will change the trend direction. It only shows the moments when there is the highest probability of market reversal or consolidation.
Widespread use of Gann angles as part of analytical work in the market is one of the most popular and, at the same time, complex methods of technical analysis. Nevertheless, the skills of structural assessment and forecasting of currency market dynamics, based on the theory of William Gunn's angles are in demand in the tools in the arsenal of every professional trader. It is worth mentioning that Gann angles are often confused with trend lines, which is not true, despite the characteristic similarity.
The key difference between the Gann line and the trend line is that the Gann line is characterized by dynamic features that allow it to move both along the x-axis (vertical axis) and y-axis (horizontal axis), which opens up wider functionality for the trader. For example, it is possible to analyze an asset by plotting it in charts, which makes it possible to determine the angles of fluctuations of a market instrument and, subsequently, to mark the limits of its dynamics.
The key assumptions of market dynamics, within the framework of the Gann theory, are the following:
• Price, time and range of market fluctuations;
• Geometric structure of the currency market, the analysis of which allows to predict the factors of further formation of its dynamics;
• The fundamentally cyclical nature of market dynamics.
Gann compared the nature of the market with the nature of human beings, analyzing the past and present of which, one can make a series of essential conclusions regarding its future.
Gann Fan In Forex Trading 📊
Now it's time to tell you how Gann angles are applied in practice. The peculiarity of applying Gann's theory in practice is to focus on two, classic for his theory, models, designed to help the trader in predicting market movements:
• The research time model, which implies fixing cyclically repeating dates;
• The price range model, which includes support and resistance lines, as well as pivot points.
Since such techniques require deep knowledge and experience from a trader, let us note the most essential technical aspects that should be kept in mind first of all.
A trader should decide on the models that she/he will use when analyzing the market with the help of Gann fan. The most common of them are models 1, 1×2 and 2x1, each of which implies a certain slope of the lines. However, there are many more among these models and, accordingly, angles:
1 × 1 - 45 degrees
1 × 2 - 63.75 degrees
1 × 3 - 71.25 degrees
1 × 4 - 75 degrees
1 × 8 - 82.5 degrees
2 × 1 - 26.25 degrees
4 × 1 - 15 degrees
8 × 1 - 1.5 degrees
There is nothing complicated about these parameters: the first one corresponds to a unit of time, the second one to a unit of price, and the formula, accordingly, shows the relation between price and time interval.
Of particular note is the 45 degree model, also known as 1×1.
According to Gann, the 1×1 line represents the long-term trend line: up or down. In this model, the disposition of price above the ascending line indicates a bullish trend and below the descending line a bearish trend respectively. The disposition of the price crossing the line indicates an anticipated trend reversal. It is important to emphasize that the 1:1 line represents the balance between price and time ranges. It is not uncommon in the market that when price approaches the line, time and price are balanced.
How To Draw Gann Angles On A Chart? 📈📉
Let's try to apply the Gann Fan in practice. Gann angles are drawn from the top of the trend. In this case, it is the lowest point. We draw a line 1x1 at an angle of 45 degrees. How to determine the angle of 45 degrees? Very simple. You can use the Trend Angle insturment to calculate 45 degrees. Under this line you will immediately begin to touch the trend. It is almost impossible to make a mistake with the construction of the angle. All other lines are pulled up automatically.
Note! Once built, this fan has a large number of points of touch and points of touch with the trend in the future. In other words, these angles can be used as an additional tool for technical analysis in the form of support and resistance levels. We strongly do not recommend trading using only one of these tools.
Also, the Gann theory has a number of similarities with fan lines based on Fibo coefficients. In light of the market moving up or down, the angles transform within the existing trend, forming resistance and support levels. As you may have already realized, this tool is not associated with any specific trading strategies, but it can serve as a good additional tool to identify support/resistance levels as well as trend reversal points.
Another key is to look for time and price discrepancies. Price will always tend towards the mean line.
In summary, Gann angles, also known as the Gann Fan, can be found on TradingView and are a standard tool frequently utilized by Forex traders. They are comprised of a sequence of straight lines that derive from a pivot point and form a shape resembling a fan. Each line indicates potential support or resistance levels as the price approaches them. Gann angles are not deterministic, and their purpose is to show when there's a high probability of market reversal or consolidation.
Traders, If you liked this educational post🎓, give it a boost 🚀 and drop a comment

Navigating Sympathy Plays: A Guide to Trading BITCOIN & COINBASE** Introduction **
Sympathy trading, a strategic approach rooted in both technical and fundamental analysis, capitalizes on correlated movements between assets to uncover profitable opportunities. In this article, we delve into the nuanced realm of sympathy trading using Bitcoin (BTCUSD) and Coinbase Global Inc. (COIN) as case studies, exploring how a blend of technical and fundamental analysis can enhance trading strategies.
** Understanding Sympathy Trading **
Sympathy trading hinges on discerning and exploiting the symbiotic relationship between correlated assets. It involves analyzing both technical indicators and fundamental factors to identify potential entry and exit points, as well as underlying drivers influencing price movements.
** BTCUSD and COIN: A Sympathetic Relationship **
BTCUSD and COIN exemplify a compelling case study in sympathy trading within the cryptocurrency domain. Bitcoin's price dynamics often exert a significant influence on Coinbase's stock value, reflecting the exchange's dependency on Bitcoin's performance and trading volumes.
Technical Analysis Insights:
Technical analysis provides crucial insights into price trends, momentum, and support/resistance levels. Key technical indicators for trading BTCUSD and COIN include:
1.Moving Averages: Analyzing moving average crossovers and trends helps identify potential entry or exit points. Golden crosses (short-term moving average crossing above long-term moving average) or death crosses (opposite) can signal trend reversals.
2.Volume Analysis: Monitoring trading volumes in both BTCUSD and COIN can confirm price movements and signal changes in market sentiment. An increase in volume accompanying price movements suggests stronger market conviction.
3.Chart Patterns: Identifying chart patterns such as triangles, flags, and head and shoulders formations can provide insights into potential price reversals or continuation patterns, guiding trading decisions.
Fundamental Analysis Insights:
Fundamental analysis delves into underlying factors driving asset valuations and market sentiment. Key fundamental factors influencing BTCUSD and COIN include:
1.Regulatory Developments: Changes in regulatory frameworks governing cryptocurrencies can impact investor sentiment and trading activity. Positive regulatory developments may boost confidence in BTCUSD and COIN, while regulatory uncertainties could lead to volatility.
2.User Adoption and Trading Volumes: Monitoring user adoption rates and trading volumes on Coinbase's platform can provide insights into the exchange's revenue prospects and growth trajectory. Increased user activity often correlates with higher revenues for the exchange.
3.Market Sentiment and News Catalysts: Market sentiment surrounding Bitcoin, such as institutional adoption, macroeconomic factors, or geopolitical events, can influence both BTCUSD and COIN prices. News catalysts, such as product launches, partnerships, or earnings reports from Coinbase, can drive short-term price movements.
** Crafting Sympathy Strategies: **
Sympathy trading strategies integrating technical and fundamental analysis may involve:
1.Confirmation of Technical Signals: Confirming technical signals with fundamental catalysts can strengthen trading convictions. For example, if a bullish technical pattern emerges in BTCUSD, traders may look for positive fundamental catalysts supporting the uptrend in COIN.
2.Event-Based Trading: Leveraging fundamental analysis to anticipate market-moving events, traders may position themselves ahead of key announcements or developments. For instance, if positive regulatory news is expected for cryptocurrencies, traders may preemptively buy COIN in anticipation of increased trading activity.
** Risk Management Considerations: **
Effective risk management is paramount in sympathy trading to mitigate potential losses:
1.Position Sizing: Determine appropriate position sizes based on risk tolerance, account capital, and trade conviction. Avoid overexposure to a single trade and diversify across multiple assets to spread risk.
2.Stop-Loss Orders: Implement stop-loss orders to limit potential losses and protect capital. Place stop-loss levels based on technical levels, volatility considerations, or predetermined risk-reward ratios.
** Case study in action **
Let's look at the charts, both on the 1W time-frame in order to catch and get an understanding of the bigger trends and see if the theory is applied on the price action.
Bitcoin has provided 5 excellent Sympathy Play signals for Coinbase in the last 2 years. Starting with a Bear Flag that was rejected on its 1W MA50 (blue trend-line), Bitcoin initiated a huge decline on Coinbase (red shape), proportionally much stronger that its own. Then as its was attempting to find a market bottom, it provided 2 recovery signals that gave a proportionally bigger rise on Coinbase. Then a BTC Bull Flag again turned into a proportionally bigger rise on Coinbase with the last signal coming on October 2023.
As you can see during this significantly sample, Bitcoin tends to provide strong early buy/ sell signals on Coinbase. It is worth noting that even though Coinbase is a stock, it follows Bitcoin's price movements more closely than the S&P500 stock index, which we have illustrated on the right chart by the grey trend-line. As you can see there have been numerous occasions where Coinbase failed to follow a big stock market rally and instead was tied to BTC with the most notable examples being recently in January 2024, March 2023 and October 2022.
** A few things to consider that distinguish Bitcoin from Coinbase: **
Market Factors: Bitcoin's price is influenced by various market factors such as supply and demand dynamics, investor sentiment, macroeconomic trends, regulatory developments, and technological advancements. Coinbase's stock price, on the other hand, is influenced by factors specific to the company, including financial performance, earnings reports, regulatory compliance, competition, and market sentiment towards the cryptocurrency industry.
Liquidity and Trading Volume: Bitcoin, being the largest and most well-known cryptocurrency, typically exhibits higher liquidity and trading volume compared to Coinbase's stock. As a result, Bitcoin may experience more significant price movements and volatility compared to COIN, which could impact their respective charts differently.
Correlation vs. Causation: While Bitcoin's price movements may influence sentiment towards Coinbase and vice versa, correlation does not necessarily imply causation. While there may be periods where BTC and COIN prices move in tandem due to shared market sentiment or external factors, they are ultimately distinct assets with their own fundamental drivers.
Market Participants: Bitcoin is traded on cryptocurrency exchanges by a diverse range of market participants, including retail investors, institutional investors, miners, and traders. Coinbase's stock, on the other hand, is traded on traditional stock exchanges and may attract a different set of investors, including institutional investors, hedge funds, and retail traders.
** Conclusion: **
Sympathy trading using BTCUSD and COIN as case studies demonstrates the synergy between technical and fundamental analysis in identifying trading opportunities and managing risk. By integrating insights from both disciplines, traders can enhance their trading strategies, navigate market dynamics with confidence, and strive for consistent profitability in the dynamic cryptocurrency market.
-------------------------------------------------------------------------------
** Please LIKE 👍, FOLLOW ✅, SHARE 🙌 and COMMENT ✍ if you enjoy this idea! Also share your ideas and charts in the comments section below! This is best way to keep it relevant, support us, keep the content here free and allow the idea to reach as many people as possible. **
-------------------------------------------------------------------------------
💸💸💸💸💸💸
👇 👇 👇 👇 👇 👇

Equal High & Low SweepToday I wanted to talk about two scenarios concerning market structure: the equal high for a bullish structure and the low sweep for a bearish structure. The crucial point of each setup, as always, is to identify a structural change called BOS. From there, I start looking for a demand or supply zone in the market where we should pay attention to observe the price return. This price return should occur as indicated in the setup, with the market starting to consolidate and form a double bottom or top of momentum. It is also important to consider the presence of a liquidity zone, as this will be our primary target zone, followed by the minimum or maximum of the structure. I wish everyone happy trading and remain available for further discussions on the matter.

The Best Entry on the MarketIn this model, we will examine a tactical approach to achieve high-performance entry. It all starts with an uptrend characterized by continuous structural changes. In fact, there are continuous directional changes until the retest of the supply zone on M30. Subsequently, the market reacts to this zone by pushing downwards and generating a CHoCH. Here, switching to a 1-minute timeframe, it will be possible to wait for a retest of the supply zone before entering. The trade will target the session or daily low. Greetings and happy trading to all.

New Approach on Forex: Inducement LowIn my analysis model, I focus on a bearish structure, where I identify the so-called "false demand zones" (SM Trap). It all starts with a supply zone, where the price begins to decline, creating a liquidity zone with a double bottom. Subsequently, the price retests the supply zone, declines again, and breaks the false demand zone, generating another one. Then, the market starts forming decreasing lows and highs, clear signals of the ongoing bearish trend. This is where I pay attention, as it constitutes a clear signal of the developing trend.
To enter the market, I prefer identifying an FVG M15, targeting weekly, daily lows, or the H4 timeframe, in line with my trading plan. I find it crucial to observe the evolution of lows and highs, as their decrease further confirms the bearish trend.
I wish everyone happy trading and success in their operations.

The Best Strategy of 2024: Reversal Entry ModelGood morning, today I would like to draw your attention to a model that I am integrating into my analyses for this year. In this model, we define simple structural changes either downwards or upwards, in this context downwards using two BOS. Subsequently, we define the main demand zone where the price retests. After the retest, the price breaks upwards the structure creating a CHOCH, or an internal breakout. Afterwards, the price will move into a lateral phase accumulating a lot of liquidity, and as it is known, as soon as the price absorbs liquidity above or below a range, it then moves in the opposite direction of the filled liquidity. In this case, liquidity is absorbed below in the order block zone and the price moves upwards. I recommend supplementing charts with this model and identifying these setups starting from an H4 timeframe which can be simpler compared to smaller timeframes. Best regards and happy trading to everyone.

TYPES OF ORDER BLOCKThis educational post is great for beginners who are just starting to grasp the concept of SMC. We've already talked about what an order block is. This time we'll talk about other types of blocks in trading.
✴️ Mitigation Block
Mitigation Block is a sell or buy zone, which is formed when the market structure (BOS) continues. In other words, it is a broken order block and tested, but from the other side.
We all know that when the price is moving along a trend, it is better to open trades in the direction of this trend. The most optimal points for buying and selling are the price pullback. By this logic a mitigation block is formed.
Mitigation Block Sell Scheme
Mitigation Block Buy Scheme
Those who trade classical technical patterns will notice that it is anything but: a support zone becomes a resistance zone, and a resistance zone becomes a support zone. Institutional level traders understand the skills and knowledge of classical technical analysis traders, so they manipulate the price to generate and collect additional liquidity.
In this zone we have our block, an ordinary block, which becomes a mitigated block after an impulse breakout.
Schematically, the Mitigation Block in sell looks like this:
Schematically, Mitigation Block in buy looks like this:
✴️ Breaker Block Smart Money
Breaker Block is a sell or buy zone that is formed when the market structure (BOS) continues. In other words, it is a broken order block and tested, but from the other side. An important difference from a broken Block is that there is a change in market character (CHoCH).
As you have understood, the essence of sell zones and blocks remains the same as in Mitigation Block, but first there is a liquidity grab, and then there is a change in market character (change in market structure). It looks schematically as follows:
Breaker Block Sell Scheme
Breaker Block Buy Scheme
✴️ Rejection Block Smart Money
A Rejection Block is a selling or buying zone that appears on the chart as long candlestick tails at a market high or low.
As in all other cases, the block is formed only after liquidity is grabbed from the previous high/minimum or equal highs/minimums. This is classically referred to as a false breakout or sweep.
Bullish and Bearish Rejection Block
The logic of building and searching for a Rejection Block is very simple:
Bearish Rejection Block: Swing High, find the highest candle whose high and close are higher than the high and close of the neighbouring candles respectively. The tail (wick) of the candle will be the bearish order block.
Bullish Rejection Block: Swing Low, we find the lowest candle, the minimum and close of which are lower than the minimum and close of the neighbouring candles respectively. The tail (wick) of the candle will be a bullish order block. It does not matter what colour the candle is. At the maximum it can be not only bullish but also bearish, and at the minimum it can be not only bearish but also bullish. This is worth paying attention to. Look for the highest candle, with the highest open or close and with the highest wick (same in the opposite direction).
✴️ Vacuum Block Smart Money
A block stands out as a regular gap - from the high of the first candle to the low of the second candle in an up gap and vice versa, from the low of the first candle to the high of the second candle in a down gap.
We can expect 2 variants of price movement: in continuation, return to the gap zone to fill it partially or completely. This is based on the presence and size of the block order.
Complete gap filling
Complete gap filling of the price void can be expected if there is an order block that is above or below the Vacuum Block. The price can bounce from the beginning of Vacuum Block, but in order to reduce the risk it is better to wait until the block is fully closed and touched.
Partial filling of the gap
A partial filling of the price void can be expected if the order block is below or above the Vacuum Block, but they overlap. The price can rebound from the beginning of the Vacuum Block, as well as overlap it completely. This is shown schematically in the figure above.
✴️ Conclusion
You should realize that you don't need to click the "buy" or "sell" buttons where you see one of the block options. An order block is simply a price range where you can consider buying or selling, depending on your preliminary analysis and determining the context of the price movement. You will trade from every block a capital loss is guaranteed. Price moves for liquidity. This is the main analysis, and only then we look for the place (blocks) where we can jump from a less risky place.

The Ultimate Strategy | ChoCh + InducementThis strategy is based on identifying a market structure, which can be bullish or bearish. In this specific case, a bullish structure characterized by rising highs and lows is considered. The expectation is for the market to change direction, creating a shock. Subsequently, the formation of a liquidity block is observed during a market consolidation phase, followed by entering a demand zone where the imbalance dictates, and the response is a downward movement, as anticipated. The target of this movement is defined graphically. Greetings and happy trading to everyone.

15M Pro OrderFlow | A Unique and Profitable StrategyIn this approach, we will outline one of the best entry points on M15. The model involves quickly assessing a potential demand area by identifying a liquidity zone formed during the Fibonacci retracement at the .62-0.78 level. From this zone, the market initiates a physiological uptrend before retracing downward, creating a sharp movement with an internal break, followed by a bounce in the demand area. It is at this moment that a precise entry will be executed, aiming to reach the structure's peak. It is important to note that this model is also applicable to H1, H4, and Daily time frames. Greetings to everyone and happy trading.

SMC Sell Setup: High Probability EntryGood morning everyone, today we will explore a short entry model using the concepts of smart money. This model involves entering the market in a short position after a series of specific patterns. Firstly, we start with a bearish structure where the price breaks a significant low, creating a BOS. Subsequently, we will identify the SMC zone, which is a trap zone to avoid. In this zone, the price makes a false descent before rising, creating the most important peak that we will use to evaluate a short entry.
After identifying this peak, the market begins to decline, forming a CHOCH, representing an internal break. This will signal our sell point, and we could define our sell zone indicated by the POI on the chart. Once the price enters this zone, we may consider opening a short position on the security. Greetings to everyone.

THREE DRIVES PATTERNThree Drives Pattern is a price pattern that consists of three consecutive changes in the market. The first and third are strong moves in one direction, while the second is weaker and in the opposite direction. The pattern can be used in trading to determine direction and predict optimal entry-exit points. Below we take a closer look at what this tool is, how it is formed and how to trade it correctly.
What is the Three Drive Pattern?
• Three Drives Pattern in trading is a reversal pattern formed from three consecutive price movements in the market:
• First is an up or down swing that creates a trend;
• The second is a correction of the trend, which is usually about 50% - 61.8% of the first impulse leg;
• Third resumption of the trend, which is usually in the opposite direction of the correction.
In the case of a bullish trend, the Three Drive Pattern often indicates that the trend is about to end. This is the case because a second downward movement indicates high selling pressure on the market. If the second momentum is strong enough, it can lead to a reversal in the trend. In a bearish trend, the Three Drives Pattern often indicates that a bearish trend may end in a reversal. This is because the second upward movement indicates the following: buyers are starting to put pressure on the market. If the second momentum is strong enough, a trend-reversal scenario is possible.
The harmonic reversal pattern requires a competent approach on the part of the trader. It is important to use it in combination with other technical indicators, not to trade against the trend, and not to enter the market before the completion of the pattern. This means that the second movement is completed, and the market returns to the previous version in the direction of the first movement. The Three Drive Pattern is a useful tool that can be used in trading to determine the direction of the trend and forecast the optimal entry and exit points.
How the Three Drives Pattern is Formed?
Bullish Pattern
The bullish pattern of three movements consists of three consecutive downward impulses. It is formed when market makers place shorts and is formed as follows:
• A strong downward movement, which is usually the beginning of a trend.
• An upward correction in the form of a weaker impulse. Indicates attempts to stop the downtrend by market participants.
• A strong downward movement that exceeds the level of the first move.
Ratios of impulse legs:
First is 1.13 or 1.27;
Second is 0,786;
Third is 1,618.
In the case of a bullish pattern, it is worth considering selling after the completion of the third movement. Additional signals could be a change in indicators, a decrease in trading volume, a break of support, or a resistance level. As in the case discussed above, it is not recommended to use such a tool on its own, trade against the trend, or act early.
As you can see above, the market started the trend with the first downward impulse. Then it experienced an upward correction and resumed the trend with the third downward impulse. We always place a stop loss to protect against losses. After opening a position, wait for a pullback towards the first impulse to close the trade or add another position to it. Take into account that the price may be at the right point, but the pattern still may not work.
Bearish Pattern
A bearish pattern of three movements is a price pattern formed from three impulses showing growth. It is used by traders to find the best point to open a position against the market changes.
• A strong upward movement, which is usually the beginning of a bearish trend.
• A downward correction and a small market reversal that does not reach the level of the first impulse. This may be preceded by the fact that sellers show resistance and try to stop the trend.
• A powerful upward movement that exceeds the level of the first impulse. This indicates that the trend is continuing and that the end of the trend is not imminent.
Impulse legs have the following level:
First move is 1.13 or 1.27;
Second move is 0,786;
Third move is 1,618.
The ratios mentioned are not strict.
The pattern is more reliable if it is accompanied by other signals, such as:
A change in trend direction indicators;
an increase in trading volume;
divergence with an oscillator;
the presence of support below or resistance above.
Always use the tool in combination with other technical indicators to get an accurate prediction. Also, do not trade against the trend.
As you can see on the chart, the market started a bearish trend from the first impulse upwards. After it experienced a downward correction, it did not reach the minimum or level of the first impulse. Finally, the market resumed the trend with the third upward impulse.
How To Trade Using The Three Drives Pattern?
1. Find three consecutive movements on the chart that meet the criteria of the pattern.
2. Do not enter the market until the pattern is complete.
3. Make an entry at the initial point of the third move after it reaches the fibonichci extension level of 127.2% - 161.8%.
4. Place a stop above the 161.8% expansion level to protect losses in case the pattern doesn't work and goes lower or higher.
5. Close the trade when the market reaches the target profit at the 50% - 61.8% retracement of the whole pattern or you can at the level of the start of the first impulse.
As you can see in the chart below, the market started bullish - the first impulse. Then there was a correction, which did not reach the level of the first impulse. Finally, the market resumed the trend and finished with the third impulse, in which the price went down and completed the pattern. Note that the price was at a strong co-contraction level. You can draw a trend line from above. The last element that hinted at a change of trend was the divergence.
Use other technical indicators. The three-move pattern is a valuable tool, but it is not an accurate one. Using other tools, such as trend direction and volume indicators, can help improve the accuracy of your forecasts. Do not trade against the trend. A three-move pattern can be more reliable if it is used to confirm a trend. Be prepared for the pattern not to work like any other technical pattern.
Bottom line
The Three Drive Pattern is a reversal pattern. It can be used to determine the trend direction, as well as to predict potential entry and exit points. The optimal place to open a position is the level of the first impulse, and the exit point is reaching the target profit calculated using the Fibonacci ratio. Trading against the trend is riskier than trading in the direction of original market movement. This is because the price can continue to move in a given direction even if you see a reversal signal. This is why you need to proceed with caution and use other tools to back you up.
Traders, If you liked this educational post🎓, give it a boost 🚀 and drop a comment

BOOM AND BUST CYCLE IN TRADINGThe "boom and bust" cycle in trading is a period in a trader's journey when significant gains are followed by periods of significant losses, which can lead to financial consequences and emotional burnout for traders. Breaking out of this cycle is not easy but very important for long-term trading success. When a trader doesn't know what he or she is doing, but is trying to break out of this cycle, the right direction is needed to find a way out of this difficult trading journey. Here are some tips that will help you stabilize your trading when you are not earning yet but also not losing all the capital as it was before.
1. Develop a solid trading plan. This sounds like a cliché. But if you don't have a trading plan you shouldn't be trading real money. Make a trading plan. A solid trading plan should describe your trading strategy. With a clear trading plan, you will be better able to anticipate market movements, avoid impulsive decisions, and stay focused on your goals. Start your trading day with a trading plan and end it with a trading plan.
2. Everyone talks about risk. The first job of a trader is to protect capital. You learn to defend first and only then attack. Apply strict risk management rules to protect your capital from day one. Because if you don't follow risk management it will become a habit that is hard to get rid of. What to consider about risks? This includes always setting stop loss orders, using the right position size to limit risk. Not trading everything. Less is more can never be applied to trading.
3. Sticking trading strategy. Consistency is the key to getting out of the boom and bust cycle. Stick to your proven trading strategy even in difficult market conditions or during losing streaks. Abandoning a strategy due to impatience or frustration can lead to inconsistency and poor performance. When you don't follow a trading strategy you don't give it a chance to show results. Deviation from a trading strategy kills any strategy. Stick to your trading strategy, give it a chance.
4. Discipline in trading. Discipline is the key to avoiding impulsive decisions. Avoid the temptation to recover losses or over-trade. If you are constantly losing money, just look at your trades for the past week. You will say to yourself, "if I had stopped trading, I wouldn't have lost so much". Why? Because the next day or week market always presents A+ setups that would have easily covered past losing trades. So, stick to your trading plan, manage your emotions and focus on making trades according to your strategy.
5 .Everyone says manage your emotions. Practice emotional discipline and keep your mind clear while trading. But how to do that? Emotions such as greed and fear can have serious consequences on trading results. One of the surest methods of dealing with emotions in trading is backtesting your strategy. You are afraid because you don’t know what to expect from the strategy. If you know all the numbers, for example which days are unprofitable, which session is more suitable for you, etc. then you won't panic and be afraid. You know what to expect. And all these techniques, like meditation, mindfulness or other methods of dealing with stress, will not help you in the beginning. After losing your capital, will you really sit and meditate? These methods work later when you have achieved stability.
6. Last but not least: journaling. Markets are constantly evolving, and pro traders adapt their strategies to changing conditions. How do you know the markets are changing? Or how do you know if you are trading better than last month? How do you identify the trading mistakes that are dragging you down? By logging what you trade, you have to regularly analyze your trading results and be prepared to try new ideas or adjust existing strategies to improve your consistency. Collect the data. If you can't measure it, you won't be able to improve it.
Conclusion
Avoiding the boom and bust cycle in trading requires a lot of work. You will need discipline, the right approach and 100% focus. Success in trading is not your golden goose strategy or some kind of secret money management. It is a combination of several things that bring success. Constant work on yourself, patience and consistency are your allies in overcoming the boom and bust cycle.

5 Steps Smart Money Concept Model5 STEPS SMART MONEY CONCEPT MODEL
Break of Structure (BOS):
Definition: A Break of Structure occurs when the market provides the initial indication that the price is likely to reverse. For example, a new lower low and lower high signal a disrupted market structure, indicating a forthcoming reversal to the downside.
Trading Approach: Traders typically align their trades with the Higher Time Frame (HTF) BOS, especially when the price closes above/below a swing high/low.
Change in Character (CHOCH):
Definition: A CHOCH represents an initial shift that can signal a short- or long-term price reversal. It is considered a reversal pattern, utilized by SMC traders on higher time frames for market direction and on lower time frames for trade opportunities.
Implementation: SMC traders use CHOCHs on various time frames to gauge market direction and identify intraday reversals or reactions to Points of Interest (POIs).
Fair Value Gap (FVG):
Definition: Fair Value Gaps highlight market inefficiencies or imbalances, where buying and selling are not equal. These gaps become magnets for price, resolving the inefficiency as resting orders are filled.
Utilization: Traders use FVG information to target these gaps, identifying potential entry points for long or short positions. Fair Value Gaps are considered valuable Points of Interest (POIs) in price action trading.

2024 US Recession | Key Factors2000 DOT-COM CRISIS
The dot-com crisis, also known as the "dot-com bubble" or "dot-com crash," was a period of economic turbulence that affected the technology and telecommunications sectors in the late 1990s and early 2000s. Here are some key points:
Euphoria Phase: In the 1990s, there was a boom in the technology and dot-com industry fueled by irrational investor euphoria. Many companies secured significant funding, even if they had weak or nonexistent business models.
Excessive Valuations: Valuations of technology companies skyrocketed, often based on exaggerated growth projections and unrealistic expectations. This led to rampant speculation in financial markets.
Bubble and Collapse: In 2000, the dot-com bubble began to burst. Many investors realized that numerous technology companies were unable to generate profits in the short term. This triggered a massive sell-off of stocks and a collapse in tech stock prices.
Economic Impacts: The crisis had widespread economic impacts, with the loss of value in many technology stocks and the bankruptcy of numerous companies. Investors suffered heavy losses, and this had repercussions on the entire stock market.
Economic Lessons: The dot-com crisis led to a reassessment of investment practices and taught lessons about the importance of carefully analyzing companies' fundamentals and avoiding investments based solely on speculative expectations.
Following this crisis, the technology sector experienced a correction but also contributed to shaping the industry in a more sustainable way. Many companies that survived the crisis implemented more realistic and sustainable strategies, contributing to the subsequent growth and development of the technology sector.
2007-2008 FINANCIAL CRISIS
The 2007-2008 financial crisis was a widespread event that had a significant impact on the global economy. Here are some key points:
Origins in the Subprime Mortgage Crisis: The crisis originated in the U.S. real estate sector, particularly in subprime mortgages (high-risk). An increase in mortgage defaults led to severe losses for financial institutions holding securities tied to these loans.
Spread of Financial Problems: Losses in the mortgage sector spread globally, involving international financial institutions. Lack of transparency in complex financial products contributed to the crisis's diffusion.
Bank Failures and Government Bailouts: Several major financial institutions either failed or were on the brink of failure. Government interventions, including bailouts and nationalizations, were necessary to prevent the collapse of the financial system.
Stock Market Crashes: Global stock markets experienced significant crashes. Investors lost confidence in financial institutions, leading to a flight from risk and an economic contraction.
Impact on the Real Economy: The financial crisis directly impacted the real economy. The ensuing global recession resulted in the loss of millions of jobs, decreased industrial production, and a contraction in consumer spending.
Financial Sector Reforms: The crisis prompted a reevaluation of financial regulations. In response, many nations implemented reforms to enhance financial oversight and mitigate systemic risks.
Lessons Learned: The financial crisis underscored the need for more effective risk management, increased transparency in financial markets, and better monitoring of financial institutions.
The 2007-2008 financial crisis had a lasting impact on the approach to economic and financial policies, leading to greater awareness of systemic risks and the adoption of measures to prevent future crises.
2019 PRE COVID
In 2019, I closely observed a significant event in the financial markets: the inversion of the yield curve, with 3-month yields surpassing those at 2, 5, and 10 years. This phenomenon, known as an inverted yield curve, is generally considered an advanced signal of a potential economic recession and has often been linked to various financial crises in the past. The inversion of the yield curve occurred when short-term government bond yields, such as those at 3 months, exceeded those at long-term, like 2, 5, and 10 years. This situation raised concerns among investors and analysts, as historically, similar inversions have been followed by periods of economic contraction. Subsequently, in 2020, the COVID-19 pandemic occurred, originating in late 2019 in the city of Wuhan, Hubei province, China. The virus was identified as a new strain of coronavirus, known as SARS-CoV-2. The global spread of the virus was rapid throughout 2020, causing a worldwide pandemic. Countries worldwide implemented lockdown and social distancing measures to contain the virus's spread. The economic impact of the pandemic was significant globally, with sectors such as tourism, aviation, and hospitality particularly affected, leading to business closures and job losses. Efforts to develop a vaccine for COVID-19 were intense, and in 2020, several vaccines were approved, contributing to efforts to contain the virus's spread. In 2021, the Delta variant of the virus emerged as a highly transmissible variant, leading to new increases in cases in many regions worldwide. Subsequent variants continued to impact pandemic management. Government and health authorities' responses varied from country to country, with measures ranging from lockdowns and mass vaccinations to specific crisis management strategies. The pandemic highlighted the need for international cooperation, robust healthcare systems, and global preparedness to address future pandemics. In summary, the observation of the yield curve inversion in 2019 served as a predictive element, suggesting imminent economic challenges, and the subsequent pandemic confirmed the complexity and interconnectedness of factors influencing global economic health.
2024 Outlook
The outlook for 2024 presents significant economic challenges, outlined by a series of critical indicators. At the core of these dynamics are the interest rates, which have reached exceptionally high levels, fueling an atmosphere of uncertainty and impacting access to credit and spending by businesses and consumers. One of the primary concerns is the inversion of the yield curve, manifested between July and September 2022. This phenomenon, often associated with periods of economic recession, has heightened alarm about the stability of the economic environment. The upward break of the 3-month curve compared to the 2, 5, 10, and 30-year curves has raised questions about the future trajectory of the economy. Simultaneously, housing prices in the United States have reached historic highs, raising concerns about a potential real estate bubble. This situation prompts questions about the sustainability of the real estate market and the risks associated with a potential collapse in housing prices. Geopolitical instability further contributes to the complexity of the economic landscape. With ongoing conflicts in Russia, the Red Sea, Palestine, and escalating tensions in Taiwan, investors are compelled to assess the potential impact of these events on global economic stability. The S&P/Experian Consumer Credit Default Composite Index, showing an upward trend since December 2021, suggests an increase in financial difficulties among consumers. Similarly, the charge-off rate on credit card loans for all commercial banks, increasing since the first quarter of 2022, reflects growing financial pressure on consumers and the banking sector. In this context, it is essential to adopt a prudent approach based on a detailed analysis of economic and financial data. The ability to adapt to changing market conditions becomes crucial for individuals, businesses, and financial institutions. Continuous monitoring of the evolution of economic and geopolitical indicators will be decisive in understanding and addressing the challenges that 2024 may bring.

WHAT IS NONFARM PAYROLLS?Let's talk about trading on Nonfarm payrolls news. What is this news, why traders always expect it, when it comes out, where to look for it and most importantly why the market fluctuates like crazy when NonFarm Payrolls are released?
What is Nonfarm Payrolls?
Nonfarm Payrolls (NFP) is the number of new jobs in nonfarm sectors of the economy over the past month. The released figures show the dynamics of changes (increase, decrease) relative to the previous period. This statistic covers about 500 sectors of the economy: construction, trade, business services, transportation, logistics, financial sector, health care, tourism and so on. The calculations do not take into account workers in the agricultural sector, non-profit organizations and self-employed citizens. A change in the NFP value of 100-200 thousand jobs will lead to strong volatility in prices of world currencies in pairs with the U.S. dollar, gold and stock markets.
When Is This Data Released?
NFP is calculated and published by the U.S. Bureau of Labor Statistics (BLS), releasing preliminary data on the first Friday of each month. Given the significance and impact of the event on the global economy, a repost of these statistics can be seen on any economic calendar, the primary source is on the BLS website. You can also view upcoming economic events on the popular Forex Factory service. The time of news release depends on the U.S. Bureau of Statistics. A trader should check the exact time and date of release every time, as it depends on the readiness of calculations of the Bureau of Labor Statistics. Any calendar indicates the format of data in the form of three figures: previous, actual value and forecast.
How Does The Market React?
Traders evaluate the released data by several criteria:
• Matching with the forecast or with the previous value. With such figures, a spike in volatility can take place without a strong and directional short-term movement;
• Strong changes cause global shifts such as reversals or strengthening of long-term trends, changes in historical volatility values.
Job growth is a leading indicator of growth in the U.S. economy. New hands in an office or manufacturing facility is the last stage of preliminary work done by a company to expand its business. By this time, it has:
1. Attracted investment
2. Expanded production capacity or sales departments for already purchased products
3. Growing employment leads to US GDP growth, low nonfarm payrolls data is a sign of a coming crisis
This is clearly seen in the graph of all employees, built on the dynamics of changes in NFP since the beginning of the calculation, where the areas of global economic crises are marked.
Why Does The Market "Fly" On Nonfarm Payrolls ?
Significant price changes occurring in the Forex market when macroeconomic indicators are released are due to the lack of support for prices by market makers.
During the release of important news, there is no need to support market liquidity, as the attention and funds of large players are attracted. As it was said above - the value of the indicator is a signal for revision of long-term trends, so huge amounts of funds are put in motion.
The absence of a market-maker leads:
• Spread widening (distance between buying and selling prices);
• Low volumes of nearby orders in the stack.
Therefore, the inputs of large players literally "collect the stack" at the moment of dismantling orders at all price levels, the same applies to the exit from positions. The market moves by 50-150 points, which is an acceptable error for long-term positions, but it is killer for stops, which limit losses of intraday traders.
Roughly speaking, the market "flies" during the NFP release because it is relatively easy to move the price at this time. And not because all traders of the world are panic selling/buying currencies.
What Should You Do If Nonfarm Payrolls Are On The Calendar Today?
There's only one 100% profitable way to trade the nonfarm payrolls! So how do we trade them?
YOU DON'T. Yeah, that's right. If you see the NFP coming out today, then:
- When trading intraday, close all positions half an hour before the news comes out
- When trading long term, remember that the average price movement is 50-60 pips and the maximum is 150-200 pips. This should be taken into account, it is possible to change the stop loss
- Remember that after an average of 6 hours the price often returns to the same level as before the news
An interesting point: if you study many strategies, you will see that on bigger timeframes (H4, D1), news carrying changes can serve as a trigger. The market plays back the data in a "second wave", after the volatility calms down, market makers will start accumulating positions on the flat movement. The tactic is called "step" at the end of fluctuations in a narrow channel there is a strong impulse and directional trend, actively shifting the markets to new price levels.
Conclusion
Let's summarize the rules of 100% profitable strategy of trading on Nonfarm Payrolls. Half an hour to an hour before a major news release, simply clsoe all positions. Even if there is a small loss, it is probably better to close them. Two hours after the Nonfarm Payrolls release you can trade again in a normal mode. But since it is already Friday and evening, there is no sense to trade. So, an hour or half an hour before the nonfarm close all positions and go to rest.

HOW TO TRADE THE EURJPYToday we will talk about how to trade EURJPY; one of the most volatile, but also the most popular cross-currency pairs on the forex market. Quite a large percentage of profitable traders include it in their trading arsenal. We will tell you about the differences of this pair, which is sometimes called "the beast".
THE ECONOMIES OF JAPAN AND THE EUROZONE
Japan has the 3rd largest GDP, behind only China and the USA. The country is a producer and exporter of automobiles and high technology and is therefore very sensitive to energy prices. The central bank, the Bank of Japan, is a publicly traded company with 45% of shares owned by private and institutional shareholders. Interest rates are interspersed between negative and very low, ranging from -0.1% to 0.1%, which makes borrowing in yen extremely popular.
The government has traditionally struggled with a high yen and low inflation rates to make Japanese exports more competitive. Earlier it was achieved through so-called currency interventions, and many traders had an opportunity to earn good money by anticipating the moment of the next sales by the Japanese Central Bank, but today the increase in inflation is achieved through stimulus programs - purchases of long-term government bonds and other financial assets by the Central Bank.
The Euro is the official currency of the Eurozone, which consists of 27 EU member. Between them, these 27 countries of the Union form a single market with an economy that accounts for 14% of the world's output in 2021, making it the third largest economy in terms of nominal GDP, the largest exporter and the largest importer of goods and services.
The main governing bank, the European Central Bank, regulates the monetary policy of the eurozone's constituent countries, maintaining overall price stability. In the long term, the ECB's policy pursues similar goals to the Bank of Japan of growing the economy through stimulus programs.
GLOBAL TREND
There has been an uptrend since the beginning of 2020. This is when the Eurozone consumer price index went into negative territory (from 0.3% at the beginning of 2020 to -0.3% by the end of 2020), due to the aftermath of the pandemic. No significant recovery has followed since then, and the situation was only exacerbated by the escalation of Eurosceptic sentiment in certain countries of the Union, which ultimately led to Brexit. At a greater distance EURUSD shows that this was not always the case, and the strongest uptrend in the post-crisis 2012 is proof of that, followed by a decline.
And if we consider EURJPY, we should assume that the uptrend will continue in the coming time, which means that when trading on daily charts, the advantage remains for the upward signals. Of course, the situation may change, but based on the currently available data and the dynamics of recent years, the global trend indicates an upward trend.
EURJPY VOLATILITY
The average daily volatility of EURJPY is approximately 88 pips. The most volatile days are Wednesday and Thursday. The highest intraday volatility is observed at the American session and at the European and Pacific sessions. But it should be noted that there is no such a strong dependence on the sessions as for EUR and GBP, and therefore activity can be expected at any time of the day.
CORRELATIONS
The most stable correlation is observed with USDJPY on the 4-hour charts. Therefore, if you have detected some signal on this pair that has not yet played out on EURJPY, it may be worth getting ready to enter a position. USDJPY is well correlated with the Japanese stock market, namely the Nikkei 225 index. And accordingly, EURJPY will have similar correlations with the Nikkei 225 due to its close correlation with USDJPY, which is observed below:
ECONOMIC CALENDAR
When working with the economic calendar, it is important to follow the news related to the European currency and Japan, as well as the US dollar, paying attention to the most volatile ones, which are marked with three red bars. Speaking about the news background, it will also be important to note that cross pairs, such as EURJPY or GBPJPY, react more smoothly to USD news, as they are less popular among traders and investors who prefer to take risks during such hours on EURUSD or, say, USDCAD trading. There are noticeably fewer spikes.
TRADING EURJPY
The pair is universal and is perfect for both scalpers and trend traders both on higher timeframes and lower timeframes. But reasoning from the point of view of practical popularity, let's say that intraday trading certainly prevails over trading on daily charts. Strong trends are perfectly visible on daily charts, which opens up acceptable conditions for long-term trading. On 4 hourly and even 1 hourly timeframes you can easily observe steady trends with pullbacks.
In addition, due to the relatively higher volatility of the pair compared to the same EURUSD, and with exactly the same characteristic sharp movements, EURJPY trends are more clean and prolonged. It is worth considering that for this pair you may also need to increase the stop loss because of the spikes, where on low timeframes it is simply necessary to put it farther away, otherwise there are risks that they will be knocked out.
Breakout strategies also work well on the same strategies of consolidation exit, allowing to take good profits. Boxes (consolidations) are visible to the naked eye, but even here it is worth setting the indicators properly so that they take into account these candle wicks.
TO SUMMARIZE
• The EURJPY pair trades perfectly and universally both intraday and on daily timeframes.
• It is worth taking into account spikes and tails, which can easily knock out your stop loss.
And therefore, calculate the stop loss with the appropriate correction for higher volatility.
• The same candlestick wicks can be used for your benefit by opening opposite small-target positions after long wicks.
• Breakout strategies work well, in particular, bull flag and bear flag patterns.
• More clearly defined trends than classic pairs such as EURUSD.
• There are correlations with USDJPY, as well as the Nikkei 225 stock market.

Advanced Forex Trading Strategy M15The trading strategy under examination is tailored for the M15 timeframe in the forex market, focusing on identifying supply and demand zones to make well-informed trading decisions. Let's delve into the key steps to successfully implement this strategy.
Step 1: M15 Chart Analysis
Position yourself on an M15 timeframe chart to gain a more detailed view of the market. This shorter time frame allows for capturing swift movements and identifying potential trading opportunities.
Step 2: Identification of Supply and Demand Zones
Utilize technical analysis tools such as supports, resistances, and volume indicators to clearly pinpoint supply and demand zones. Demand areas represent points where price is expected to rise, while supply zones indicate potential downward reversal points.
Step 3: Confirmation of Demand Zone Breakout
Wait for the breakout of a demand zone, accompanied by a bounce. This confirms the strength of the movement and suggests a potential change in the price direction.
Step 4: Waiting for Price Bounce Above the Broken Zone
After the demand zone breakout, observe price behavior and wait for it to return above the same zone. This confirms the effectiveness of the breakout and suggests a potential entry opportunity.
Step 5: Identification of Supply Zone
Once the price has surpassed the demand zone, identify a possible supply zone. This is the level where price is expected to encounter resistance.
Step 6: Market Entry and Goal Planning
Enter the market when the price reaches the identified supply zone, aiming to capture the downward movement. Set the target corresponding to the minimum that led to the last uptrend, intending to capitalize on the potential downward movement.
Conclusions:
This advanced forex trading strategy on the M15 timeframe is based on analyzing supply and demand dynamics. Always remember to manage risk carefully and adapt the strategy to evolving market conditions.

Market Phases | Buy & Sell zone!Today, we delve into the crucial market phases, focusing on the dynamics of accumulation and distribution, along with the concepts of BOS (Breakout of Structure), Sweep, Range, and Liquidity. Understanding these phases is essential for developing an informed trading strategy and improving trading decisions.
The market goes through various phases, such as accumulation and distribution, which play a key role in price formation. Accumulation represents a period when institutional traders accumulate a significant position, while distribution is associated with the sale of these positions.
BOS (Breakout of Structure) is a pivotal event where the price surpasses a significant support or resistance level. Analyzing BOS can provide signals for reversal or trend continuation, indicating the end of one phase and the beginning of another.
The concept of Sweep involves the rapid and aggressive buying or selling of a large quantity of assets at current market prices. This may indicate institutional interest and influence the future direction of the price.
Range refers to a consolidated price interval where the market is temporarily "locked." During these phases, traders can seek breakout or breakdown signals to identify trading opportunities. Liquidity is crucial as it represents the availability of a large volume of trades at a specific price level.
Understanding market phases and concepts like BOS, Sweep, Range, and Liquidity provides a solid foundation for chart analysis. Using this knowledge, informed decisions can be made to identify trading opportunities and manage risks more effectively.

The best trading setup with Entry!In this model, we observe a market that begins to consolidate before a sharp decline, during which liquidity is created with an imbalance. Immediately after, there is an upward movement with rising highs and lows, forming a bullish liquidity trendline. When the price reaches a point where it starts to consolidate, dual liquidity is generated on the buy side in the upper part of the consolidation. Subsequently, a false upward movement occurs, during which the price gains liquidity from the previous order block created by the initial sharp decline. This creates an excellent opportunity to enter a short position, with the aim of reaching the minimum of the main decline. Updates will be provided with an example applied in a real case study. Greetings and happy trading to everyone from Nicola.

Choch Entry & Liquidity Model | Trading StrategyIntroduction:
The trading strategy "Choch Entry & Liquidity Model" has emerged as an innovative model in the financial domain, focusing on market entry and liquidity. This approach is built upon key principles aimed at maximizing returns and effectively managing risk.
Fundamental Principles:
The strategy relies on an entry approach known as "Choch Entry," which is presumed to provide precise trading signals based on specific indicators. This method aims to capture significant price movements through a detailed analysis of market data.
Liquidity Management:
Another distinctive element of this strategy is its focus on liquidity. The "Liquidity Model" seeks to optimize order execution, ensuring that the strategy can enter and exit the market efficiently, minimizing slippage and price impact.
Practical Implementation:
The practical implementation of this strategy requires a thorough understanding of financial instruments and indicators used in the model. Traders must be able to adapt the strategy to changing market conditions and constantly monitor key variables to make informed decisions.
Risks and Challenges:
As with any trading strategy, it is crucial to understand the potential risks and challenges associated with the "Choch Entry & Liquidity Model" strategy. Market volatility, sudden changes in economic conditions, and other factors can influence outcomes.
Conclusions:
The "Choch Entry & Liquidity Model" trading strategy represents an intriguing approach that combines targeted entry with careful liquidity management. Its effectiveness depends on the trader's proficiency in consistently and flexibly applying key principles, adapting them to the changing dynamics of the market.

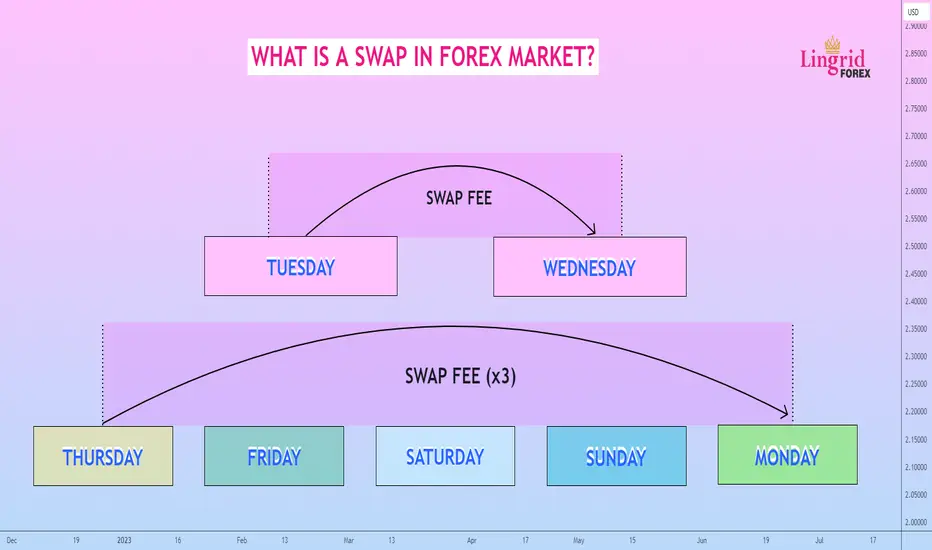
WHAT IS A SWAP IN FOREX MARKET?All participants in forex trading sooner or later leave an open position overnight. Most often, beginners do not have access to impressive sums of money as initial capital, so they actively use leverage. Although it carries a lot of risk, it gives an opportunity to earn good money trading currency pairs in a relatively short period of time. Around midnight, changes occur in the client's account: a certain amount is debited or credited, which is called "swap." What is it, and is it worth being afraid of?
What is a Swap?
Traders whose position has not been closed overnight are sure to ask the question: What is swapping on Forex? Some believe that it is a guarantee of loss; others see it as an opportunity to earn. Each currency, whether it is the American dollar, Japanese yen, or euro, has its own central bank, which sets the interest rate. This rate is the determining value for granting loans to other financial institutions.
For example, Japan's central bank sets the interest rate on the yen at which other banks in the country are lent. When trading begins in the market, a position is opened for a currency pair, one of the components of which is Japanese money. At the same time, the interest rate of the Bank of Japan will be valid for the yen on the exchange. The second currency in the pair, let's say the dollar, also has its own rate. The difference between these values will be called a forex swap.
Since each country sets its own interest rate for loans, the value between them in a currency pair can be either positive or negative. For example, the Japanese yen is lending at 1% and the dollar at 0.5%. Then an open JPY/USD position can bring 0.5% profit from the deposit amount if it is held for a long time. If you swap the components of the currency pair, you will get the same value but with a negative sign.
Swap accrual occurs at night, i.e., after the end of the trading session. This means that those who are engaged in scalping or intraday trading do not face this concept at all. Other traders see its impact on the account every day.
What is a forex swap, in simple words? It is the difference in a currency pair between the interest rates that banks set. Traders often use it in trading and can sometimes make a significant amount of money in a short period of time. An important point: the use of leverage is a guarantee that a certain amount of money will be charged or debited to the account. Otherwise, trading is done without the use of loans and deposits, which, although it reduces risks, does not eliminate them altogether.
Why Do Overnight Swaps Occur?
An open position in the forex market is typically held for a few minutes, hours, or, in some cases, days. When a trader holds an open position beyond the end of the trading day, they need to roll it over to the next day. This process is called an overnight swap. The purpose of overnight swaps is to ensure that open positions are settled at the end of each trading day, allowing traders to continue holding their positions and making adjustments based on their trading strategies.
How Does An Overnight Swap Work?
Perhaps one of the main features of swaps is their occurrence when trading with leverage. That is, there is no such concept for ordinary investment accounts. As soon as leverage is used, swaps appear. Brokers increase their income not only from account commissions but also from the negative difference. Therefore, no one will warn a beginner about the need to close a position overnight so as not to make a loss.
Islamic Account Without Swap
At the same time, traders have the opportunity to trade with leverage without swap. The so-called Islamic account is used, which can be opened by anyone. According to religious canons, Muslims can not use interest in any activity. A special account was created for them, and not only those who use Islam can apply for it.
It is important to realize that brokers do not work for free. If a trading account has a swap, it means that the commission or spread has been increased. Information about this should be found before opening to avoid unpleasant surprises over time.
Time Of Swap Setting
Traders are often interested in what time the swap is set on Forex. The difference is accrued or written off at night. The exact time of the swap is 0:05. Every night, the servers go to reboot at 24:59. After that, they start working again at 0:05, and at the same time, the swap is calculated. If a trader manages to close a position before midnight, her/his account will remain unchanged with a 100% guarantee.
Triple Swap
Financial market participants face one more peculiarity of the swap: its triple size. On the night from Wednesday to Thursday, the value multiplied by three is charged or withdrawn from the account. Why does it happen?
Conversion on the Forex market takes place in three days. So, the swap value is available for calculation three days after opening a position. On weekends, the difference is calculated, but the forex exchange does not work on weekends. So, it turns out that for Friday, Saturday, and Sunday, i.e., three days, the commission should be set on Monday. And since the real commission is paid only after 3 days, the formal calculations fall on the night from Wednesday to Thursday.
On different markets, the increased swap can be debited in different ways, but on Forex, the triple size is only on Wednesdays. It is important to take into account the time zone. For some traders, the triple commission is charged on Thursdays due to the time difference.
In conclusion, overnight swaps are a critical component of the forex market, enabling traders to hold positions beyond a trading session. Understanding how overnight swaps work and the factors that influence swap rates can help traders make informed decisions when trading currency pairs.
Traders, If you liked this educational post🎓, give it a boost 🚀 and drop a comment
TRADER'S CREDOThe world of trading is filled with risks, challenges, and opportunities. As traders navigate the ups and downs of the markets, it's essential to have a strong set of principles and beliefs to guide their actions. The Trader's Credo serves as a useful reminder of these core values, helping traders stay focused, disciplined, and committed to continuous growth.
The Trader's Credo
1. I am responsible for my actions : As a trader, I understand that my success or failure depends on my decisions and discipline. I will take full responsibility for my actions and their outcomes.
2. I respect the markets: The markets are my ultimate teacher. I will respect their wisdom, learn from my mistakes, and constantly improve my trading skills.
3. I am committed to continuous learning: The world of trading is ever-changing. I will stay up-to-date with the latest market trends, trading strategies, and technologies to enhance my knowledge and success.
4. I practice discipline and patience: Trading success requires discipline and patience. I will follow my trading plan, manage my emotions, and avoid impulsive decisions.
5. I prioritize risk management: The preservation of capital is paramount. I will never risk more than I can afford to lose and adhere to strict risk management protocols.
6. I embrace accountability: I will be accountable for my decisions and accept the consequences. I will learn from my mistakes and use them as valuable lessons for future success.
7. I focus on the process, not the outcome: Trading success is a journey, not a destination. I will focus on the process, enjoy the learning experience, and trust that my hard work will eventually lead to success.
8. I respect others' opinions: The trading community is filled with diverse perspectives. I will respect others' opinions, engage in constructive discussions, and learn from their insights.
9. I strive for continuous improvement: I will never be satisfied with my current level of knowledge and success. I will always aim to improve and grow as a trader.
10. I am committed to ethical trading: As a trader, I will act with integrity and honesty. I will never manipulate the markets or engage in unethical practices.
Conclusion
The Trader's Credo is a powerful tool for traders looking to develop a strong foundation of principles and values. By adhering to these guiding beliefs, traders can improve their skills, manage risk, and ultimately achieve long-term success in the trading aren
