Understanding Market Structure1) Consolidation
The market enters this phase after a strong movement. Sellers control buyers, which further leads to a downward trend
2) Down trend
Bearish phase - lower lows and lower highs. This is where traders want to go short on breakouts or from levels
3) Distribution
Occurs after a prolonged fall in prices, when buyers gain control of prices, resulting in higher prices
4) Up trend
The bull phase is where you want to be long. See to buy short breakout moves after long rallies have exhausted themselves. Attempts to rally are considered guilty until proven innocent
-------------------
Share your opinion in the comments and support the idea with likes.
Thank you for your support!
Signals

Understanding Market Structure1) Consolidation
The market enters this phase after a strong movement. Sellers control buyers, which further leads to a downward trend
2) Down trend
Bearish phase - lower lows and lower highs. This is where traders want to go short on breakouts or from levels
3) Distribution
Occurs after a prolonged fall in prices, when buyers gain control of prices, resulting in higher prices
4) Up trend
The bull phase is where you want to be long. See to buy short breakout moves after long rallies have exhausted themselves. Attempts to rally are considered guilty until proven innocent
-------------------
Share your opinion in the comments and support the idea with likes.
Thank you for your support!

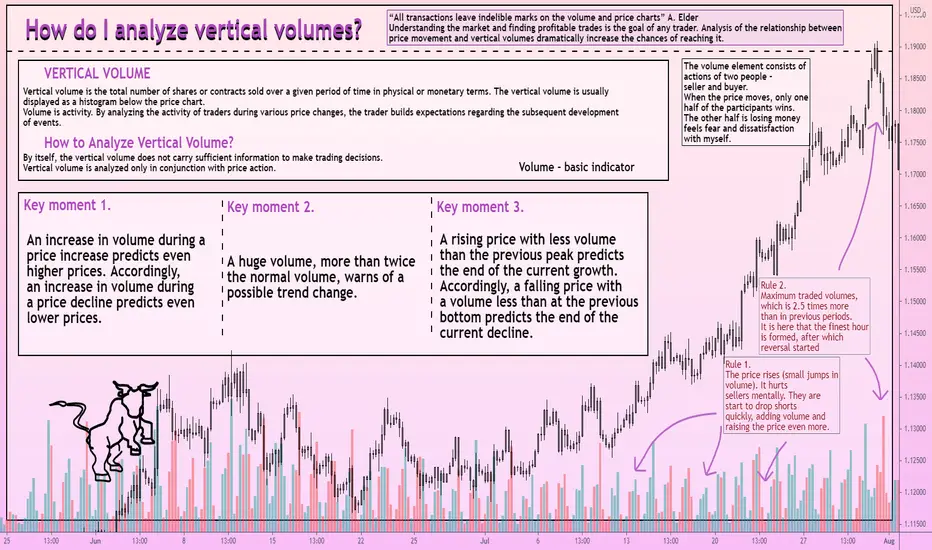
How do I analyze vertical volumes?“All transactions leave indelible marks on the volume and price charts” A. Elder
Understanding the market and finding profitable trades is the goal of any trader. Analysis of the relationship between price movement and vertical volumes dramatically increase the chances of reaching it.
The volume element consists of actions of two people - seller and buyer. When the price moves, only one half of the participants wins. The other half is losing money
feels fear and dissatisfaction with myself.
VERTICAL VOLUME
Vertical volume is the total number of shares or contracts sold over a given period of time in physical or monetary terms. The vertical volume is usually
displayed as a histogram below the price chart.
Volume is activity. By analyzing the activity of traders during various price changes, the trader builds expectations regarding the subsequent development of events.
How to Analyze Vertical Volume?
By itself, the vertical volume does not carry sufficient information to make trading decisions.
Vertical volume is analyzed only in conjunction with price action.
1) An increase in volume during a price increase predicts even higher prices. Accordingly, an increase in volume during a price decline predicts even lower prices.
2) A huge volume, more than twice the normal volume, warns of a possible trend change.
3) A rising price with less volume than the previous peak predicts the end of the current growth. Accordingly, a falling price with a volume less than at the previous bottom predicts the end of the current decline.
Traders, if you like this idea or have your own opinion about it, write in the comments. I will be glad👩💻
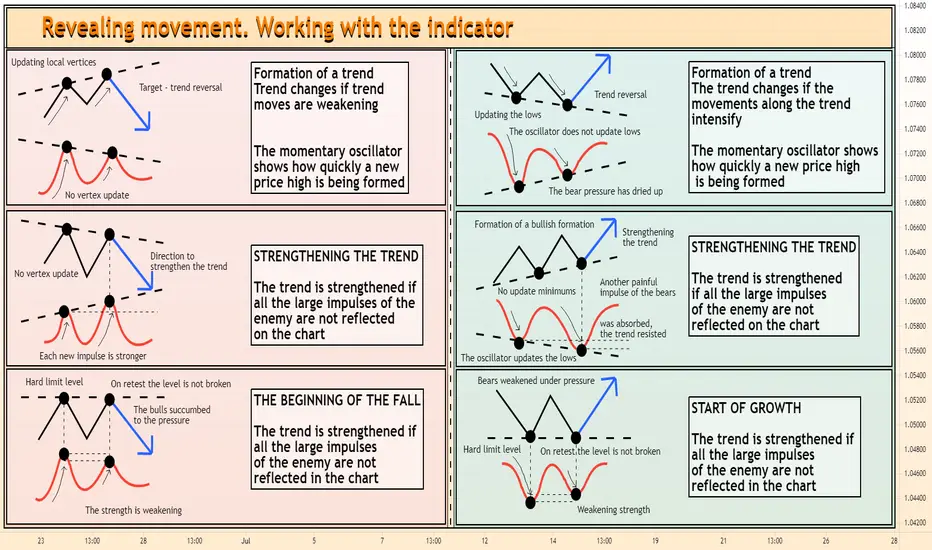
Revealing movement. Working with the indicatorRevealing divergence. Working with the indicator
I analyze the market, absolutely any trader is interested in seeing in advance where the price of a particular currency pair or another asset will move. After all, his profit depends on it. To win, it is important to see Forex divergence on all timeframes
In this article, we will understand the concept of divergence, and also learn how to determine divergence
A divergence or divergence can tell us that the market is ready to go in the opposite direction. In other words, divergence should be considered the moment when the direction of price movement does not coincide with the direction of movement of the Forex indicator. Moreover, this can be observed both in the direction of the trend line and against it. It is better, of course, that the divergence occurs in the direction of the global trend.
-------------------
Share your opinion in the comments and support the idea with likes.
Thank you for your support!
How to use "Auto Trendline and Breakout Alert" IndicatorIn this tutorial, we will learn how to use the "Auto Trendline & Breakout Alert (Linear / Log)" indicator.
Note: You can find it in the scripts section of my profile
Auto Trendline & Breakout Alert(Linear / Log) Full-Version by BobRivera990
Overall Introduction
This indicator is the best tool for breakout traders.
Drawing and evaluating the trend lines of multiple charts in different time frames is a very time-consuming and tedious task. In addition, being aware of breakouts in the shortest possible time requires constant monitoring.
With this tool, you can draw and classify trend lines in a fraction of a second and by placing an alert on any chart, you can receive notifications about breakouts, wherever you are.
The classification of trend lines is done based on the reaction of the price chart to the trend lines and the analysis of the trading volume .
This indicator is designed to reclassify trend lines with each reaction of the price chart. These lines are classified into 6 levels and these levels are distinguished by different colors. Thus, any touching or crossing of the price chart can make a difference.
Features
This indicator is designed for use on both linear and logarithmic scales. It works linearly by default. If you are using a logarithmic chart, enter the settings menu and set the chart scale parameter to “Log”.
The indicator is equipped with the volume status tool to identify and avoid false breakouts. Note that you can't completely avoid false breakouts, but you can minimize risk and loss. I have already published volume status as a separate script.
Several filters are provided to customize alerts. You can limit alerts based on the level and strength of broken trend lines , volume status, and type of breakout (Cross-Over, Cross-Under, or both).
The last breakouts panel gives an overview of the current market situation. You can activate it in the settings menu. the figure below shows the panel:
How to setup
There are many parameters in the settings menu, but two are more important. One is “Chart Scale” and the other is the “Max Operational Range Length".
Set the “chart scale” parameter according to the chart, otherwise the trend lines drawn by the indicator do not match the price chart.
If you are using a linear chart, select the "Linear" option or if you are using a logarithmic chart, select the "Log" option.
Max Operational Range Length Limits the range of the price chart that is processed by the indicator.
By increasing this parameter:
The strength and durability of the trend lines increases.
The number of breakout signals decreases.
The importance of breakout signals increases.
The indicator processing load increases.
The best range for "Max Operational Range" is from 300 to 1200,Change it until you get the best view possible.
Also by changing the "Filter" parameter from 1X to 5X, you can reduce the clutter in the chart.
The following figure shows the results of correct and incorrect settings:
Use it well...

How to make money with BANKING LEVELThese are strong levels, from which many large players enter the international currency exchange. This is the price range that central banks want. This information is not freely available, but it can be found using the technical forecasting method.
It can be described as follows: Banks buy / sell currency on the international currency exchange not for the purpose of speculation, but in order to maintain a balance of real demand and supply of currency
It works like this: central banks are conducting billions of dollars in interventions that can significantly disrupt the balance of power between bears and bulls on the Forex chart. The prices at which the transactions are carried out correspond to the closing prices of the last session.
Accordingly, it is important to navigate to 0.00 London time. To do this, take the last candlestick that closed at the end of the session and look at the level at which it closed. This will be the desired value from which you can work. When the price approaches this level, decisions should be made, since the mark is really very important.
The rule for building bank levels:
1. In the terminal, enable the function of displaying period separators
2. The terminal time must be in London, if your broker has a terminal time and the period separators are different, then you need to find a candle on the HOUR TIME FRAME corresponding to 00:00 London time
3. Draw the CANDLE CLOSING LEVEL along the body of the candle
4. This level will work as an entry point or a point for taking profit, but not on the day it appeared, but only on the next
5. After working out this level, we will delete it so that it does not interfere. We do not make more than 1 entry point at such levels
Traders, if you like this idea or have your own opinion about it, write in the comments. I will be glad👩💻

Risk-free and safe trading Safe is the closing of half of the order when the profit distance is equal to your risk, that is, in such a way that the profit from the closed part of the order is equal to the size of the stop loss loss, if the price movement does not go in our direction.
This is important in order to fix the profit on a part of the order, and set a stop loss equal to the profit on the first part of the order for the rest of the part, then we are in the market without risk!
But here it is possible to move the stop loss to the point of entry into the market after the distance passed by the price equal to the risk, then if the price turns against us and closes by the stop loss, then we will be in profit
In 65-70%, if a technical entry goes to "plus", if you entered correctly, in other cases the deal will be closed by stop loss, but thanks to the SAFE there will be no loss!
These laws are already guaranteed to allow you never to drain your deposit and, as a result, start earning
-------------------
Share your opinion in the comments and support the idea with likes.
Thank you for your support!

The most speculative and important currenciesUSD
Positive points:
-Main reserve currency for global transactions
-Currency of the strongest world economy
- The most important currency in the world
- Considered a safe investment
Negative points:
- Attempts to weaken the US dollar to combat the trade deficit.
- Volatility due to information warfare against Fed countries that stop
using US dollars for international transactions.
GBP
Positive points
-It is one of the most liquid currencies
-10-year bond rate higher than German bonds
-Potential trade agreement between US and UK after Brexit.
Negative points
-Current account deficit.
- Inflation below the target of 2%
- Uncertainty due to the low political settlement of Brexit with the European Union
CAD
Positive points
-USA is one of the main trading partners of Canada.
-Currency pegged to the price of commodities, mainly oil
Negative points
-Interest rate 1.75% below the Fed's interest rate, not profitable for carry trade
-High inflation, which can lead to higher interest rates
- Weakness due to falling oil prices.
- Latent risk: The United States is imposing import duties.
NZD
Positive points
-Australia is their main business partner
-Currency is tied to goods
- tends to increase when there is an inclination to take risks
Negative points
- Impact due to a slowdown in Australian economic growth
- Bearish interest rate cycle since late 2016
EUR
Positive points:
- Belongs to a very powerful economic zone with great potential.
-It is an international reserve currency.
Negative points:
-Inequality of public finance between member countries
- Interventions by the ECB to pump liquidity at a 0.00% interest rate.
-Uncertainty of the trading future amid Brexit
-The threat of a weakening economy
CHF
Positive points
-Strong correlation with gold
-Safe Haven currency in the face of uncertainty and inflation
-Direction for private bank investment
Negative points
-Currently has a negative reference rate of -0.74%
- The economy has very low inflation
JPY
Positive points
-Slight increase in inflation
- This is a currency that strengthens in the face of uncertainty scenarios
Negative points
-Continuous increase of assets in the Bank of Japan's Balance Sheet
-Weakness in carry trade scenarios
-Negative interest rate at 0.10%
AUD
Positive points
-It can be strengthened in the face of inflationary pressures and uncertainties.
-Currency correlated with gold
Negative points
-Constant decrease in the interest rate since the end of 2010
-Weakness in the US-China trade war
-Dropping prices in the real estate market

TYPES OF TRADING ORDERS AND HOW TO USE THEMPending orders
Somewhere you can find the term as "Deferred orders".
These are orders that will be filled in the future, once a certain condition is met.
Most often this condition is reaching a certain market price.
The most popular pending orders are Stop and Limit!
Both types of orders become market orders when the initially set price is reached.
The difference between them is that Stop Orders can be activated at a worse price than the set price, depending on market conditions.
Limit orders cannot be activated at a price lower than the set price, the price must be either equal to the set price or even more advantageous.
Depending on the purposes of the trade, different deferred orders are used.
A breakout of a level is traded with a Stop order
A pullback from a level is traded with Limit order.
The types of Pending Orders are:
Buy Limit;
Sell Limit;
Buy Stop;
Sell Stop;
OTO;
OCO;
and other.
Market order
This is an order where you enter a trade, regardless of buy or sell, which is executed at the current best price.
For example, if you want to buy GBP/USD, you click directly on the corresponding button and the trading platform automatically places the deal on the market.
When you click on the "Sell" or "Buy" button, you actually place a market order.
Keep in mind that depending on market conditions, there may be some difference between the price you see and the price at which the order will be executed.
Stop Forex orders - Buy Stop and Sell Stop
The Stop orders to enter a deal are different from the Stop Loss order to limit the loss!
Buy Stop order is used when you want to buy at a level higher than the current market price.
It is placed higher than the level at which the price is currently.
Sell Stop order is used when you want to sell at a level lower than the current market price.
It is set lower than the current price level.
For example, EUR/USD is currently trading at a price of 1.1860, you think that if it reaches a price of 1.1960 it will continue to move in an uptrend.
In this situation you have two options:
To sit in front of the screen waiting for price to reach 1,1960 so you can buy, or;
To place a Buy Stop order at the 1,1960 level.
However, if you think that the price will fall in the coming periods, instead of staying at the computer and wait for a convenient time to sell, you can place a Sell Stop order at a level lower than the current market price - on the chart 1.1760.
Limit Forex orders / Buy limit and Sell Limit
Buy Limit order is used when you want to buy at a level lower than the current market price.
It is set lower than the current price level.
Sell Limit order is used when you want to sell at a level higher than the current market price.
It is placed higher than the level at which the price is currently.
For example, EUR/USD is currently trading at a price of 1.1860, you think that if it reaches a price of 1.1960 it will bounce off the level and go into a downtrend.
In this situation you have two options:
To sit in front of the screen waiting for price to reach 1,1960 so you can sell, or;
To place a Sell Limit order at the 1,1960 level.
However, if you think that the price will fall in the following periods and then rise, instead of you sitting at the computer and wait for a convenient time to buy, you can place an order to buy a limit below the current market price - on chart 1,1760.
Above is a summary chart of the orders and where they are placed.
Let’s summarise:
Buy Limit - pending buy order placed at a price lower than the current one;
Buy Stop - pending buy order placed at a price higher than the current one;
Sell Limit - pending sell order placed at a price higher than the current one;
Sell Stop - pending sale order placed at a price higher than the current one;
OCO orders / One Cancels The Other
The OCO order is a combination of two orders to enter into a trade.
One order is placed above the current market price and the other below the current market price.
When one of the orders is reached, it is executed and the other one is automatically deleted from the trading platform.
For example, EUR/USD is currently trading at 1.1850.
You expect great volatility in the market and you do not want to miss the movement.
In this case you place an OCO Forex order at the level of 1.1880 (above the market price) in anticipation of an upside move and at the level of 1.1820 (below the market price) in case the price goes down.
When the market reaches 1.1880, you will buy EUR/USD at this level, and the order placed at 1.1820 will be deleted from the trading platform.
OTO orders / One Triggers The Other
OTO allows the trader to place two orders simultaneously, the second one being activated after the first one.
This type of order allows many different combinations.
For example, a buy order can be placed at a pre-set price, above the current one (Buy Stop) and a second order can be placed together with it to limit the loss from the buy order, in case the price goes in the opposite direction.
In this case, the loss limit order will only be activated if the buy order is activated.
The orders described so far are for entering into a trade, but you must also exit the trades.
This is done by using “Stop Loss” and “Take Profit”.
Trailing stop
Trailing stop is an order to limit the loss, which moves along with the market price.
It can be said that this is a moving Stop Loss.
And here is how to do it!
Suppose you want to buy GBP/USD at a price of 1.2820.
You place a trailing stop at a distance of 20 pips at a price of 1.2800.
When the price goes in your direction and reaches the level of 1.2840, then the trailing stop will move by 20 pips or at the level of the entrance to the transaction.
Then if the price reaches the level of 1.2860, then the trailing stop will move to the level of 1.2840.
Keep in mind that if the price returns from 1.2860 to 1.2850, the trailing stop will NOT go down to 1.2830, but it will remain at 1.2840.
If it was to move down back with the price, it makes no sense, because it will never be reached and will not be able to limit the loss of the deal.
And then you will find out first hand what Margin Call and Stop Out is!
Another important feature to keep in mind is that the trailing stop is only active if the trading platform is active.
If the platform is closed, then you do not have a Stop Loss order at all!
Conclusion
These are the most frequently used orders on the Forex market and they are totally enough, there is no need to complicate trading.
Before you start trading live, get familiar with the conditions of the broker regarding the orders.
Make sure that you understand them and that you can use them correctly.
The best teacher remains the practice, therefore, open a demo account and test the capabilities of the platform.
👍 Please support this tutorial with like and comment so we can help more people together.
Thank you in advance! 🙏

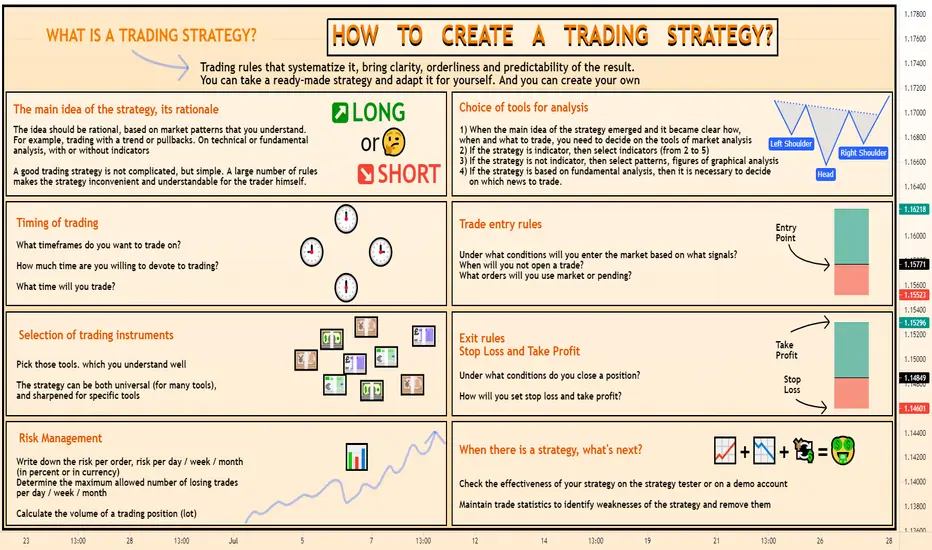
How to create a trading strategy?HOW TO CREATE A TRADING STRATEGY?
WHAT IS A TRADING STRATEGY?
Trading rules that systematize it, bring clarity, orderliness and predictability of the result. You can take a ready-made strategy and adapt it for yourself. And you can create your own
The main idea of the strategy, its rationale
The idea should be rational, based on market patterns that you understand. For example, trading with a trend or pullbacks. On technical or fundamental analysis, with or without indicators
A good trading strategy is not complicated, but simple. A large number of rules makes the strategy inconvenient and understandable for the trader himself.
Timing of trading
What timeframes do you want to trade on?
How much time are you willing to devote to trading?
What time will you trade?
Selection of trading instruments
Pick those tools. which you understand well
The strategy can be both universal (for many tools), and sharpened for specific toolsChoice of tools for analysis
1) When the main idea of the strategy emerged and it became clear how, when and what to trade, you need to decide on the tools of market analysis
2) If the strategy is indicator, then select indicators (from 2 to 5)
3) If the strategy is not indicator, then select patterns, figures of graphical analysis
4) If the strategy is based on fundamental analysis, then it is necessary to decide on which news to trade.
Trade entry rules
Under what conditions will you enter the market based on what signals?
When will you not open a trade?
What orders will you use market or pending?
Exit rules
Stop Loss and Take Profit
Under what conditions do you close a position?
How will you set stop loss and take profit?
Risk Management
Write down the risk per order, risk per day / week / month
(in percent or in currency)
Determine the maximum allowed number of losing trades
per day / week / month
Calculate the volume of a trading position (lot)
When there is a strategy, what's next?
Check the effectiveness of your strategy on the strategy tester or on a demo account
Maintain trade statistics to identify weaknesses of the strategy and remove them
Correlation of price movementTHESE ARE TWO THEORIES. THE FIRST IS ACCORIDNG TO WYCKOFF, THE SECONS IS THE DOW THEORY
1) Accumulation begins with the price stopping and the formation of support, followed by the end of sales, the opposite level is gradually formed - resistance
and the price goes into a sideways movement. It has a name - Accumulative flat or consolidation. Dow says that it is impossible to trade in flat, this is not a place to trade
2) Consolidation ends when there is an update of the tops and someone from the sides - buyers or sellers, starts winning in the market, but it is quite difficult
to break through from the first time and often a large player deceives the players in this way by making a false breakout.
3) Wyckoff's theory mentions retests of the support level, a sequential movement that follows a stop. Assessment of the state of the lower limit of accumulation,
after which the market reverses and moves in the opposite direction to the previous movement. The accumulation is exited and the trend is reversed.
TREND
In essence, a trend is the direction of the predominant movement of indicators. Usually considered in the framework of technical analysis, where the direction
of price movement is implied. Charles Dow noted that in an uptrend, the subsequent peak on the chart should be higher than the previous ones, in a downtrend,
subsequent downturns on the chart should be lower than the previous ones. There are upward, downward and sideways trends. A trend line is often drawn on the chart,
which connects two or more price troughs in an uptrend, and connects two or more price peaks in a downtrend.

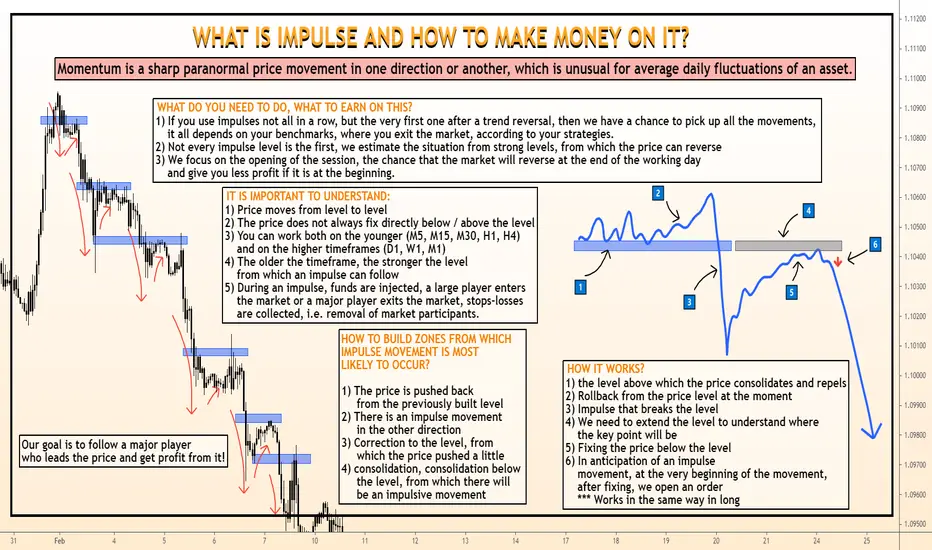
What is impulse and how to make money on it?What is momentum and how to make money on it?
Momentum is a sharp paranormal price movement in one direction or another, unusual for average daily fluctuations of an asset
How to build zones from which impulse movement is most likely to occur?
1) The price is pushed back from the previously built level
2) There is an impulse movement in the other direction
3) Correction to the level, from which the price pushed a little
4) consolidation, consolidation below the level, from which there will be an impulse movement
How it works?
1) the level above which the price consolidates and repels
2) Rollback from the price level at the moment
3) Impulse that breaks the level
4) We need to extend the level to understand where the key point will be
5) Fixing the price below the level
6) In anticipation of an impulse movement, at the very beginning of the movement, after fixing, we open an order
*** Works in the same way in long
What do you need to do, what to earn on this?
1) If you use impulses not all in a row, but the very first one after a trend reversal, then we have a chance to pick up all the movements, it all depends on your benchmarks, where you exit the market, according to your strategies.
2) Not every impulse level is the first, we estimate the situation from strong levels, from which the price can reverse
3) We focus on the opening of the session, the chance that the market will reverse at the end of the working day and give you less profit if it is at the beginning.
It is important to understand:
Price moves from level to level
The price does not always fix directly below / above the level
You can work both on the younger (m5, m15, m30, h1, ch4) and on the higher timeframes (d1, b1, m1)
The older the timeframe, the stronger the level from which an impulse can follow
During an impulse, funds are injected, a large player enters the market or a major player exits the market, stops-losses are collected, i.e. removal of market participants.
Our goal is to follow a major player who leads the price and get profit from it

What is impulse and how to make money on it?What is impulse and how to make money on it?
Momentum is a sharp paranormal price movement in one direction or another, unusual for average daily fluctuations of an asset
How to build zones from which impulse movement is most likely to occur?
1) The price is pushed back from the previously built level
2) There is an impulse movement in the other direction
3) Correction to the level, from which the price pushed a little
4) consolidation, consolidation below the level, from which there will be an impulse movement
How it works?
1) the level above which the price consolidates and repels
2) Rollback from the price level at the moment
3) Impulse that breaks the level
4) We need to extend the level to understand where the key point will be
5) Fixing the price below the level
6) In anticipation of an impulse movement, at the very beginning of the movement, after fixing, we open an order
*** Works in the same way in long
What do you need to do, what to earn on this?
1) If you use impulses not all in a row, but the very first one after a trend reversal, then we have a chance to pick up all the movements, it all depends on your benchmarks, where you exit the market, according to your strategies.
2) Not every impulse level is the first, we estimate the situation from strong levels, from which the price can reverse
3) We focus on the opening of the session, the chance that the market will reverse at the end of the working day and give you less profit if it is at the beginning.
It is important to understand:
Price moves from level to level
The price does not always fix directly below / above the level
You can work both on the younger (m5, m15, m30, h1, ch4) and on the higher timeframes (d1, b1, m1)
The older the timeframe, the stronger the level from which an impulse can follow
During an impulse, funds are injected, a large player enters the market or a major player exits the market, stops-losses are collected, i.e. removal of market participants.
Our goal is to follow a major player who leads the price and get profit from it
Components Of The Most Effective StrategyComponents of the most effective strategy
Things are indicated that can reveal the maximum potential of your strategy, or change it a little so that you are successful.
Theory
Do you have enough knowledge base about the market, terminal, competition, nuances, technical and fundamental analysis, your own capabilities to feel quite comfortable in the market?
Objective
Were you able to define your goal, what would you like to see from yourself in the future? Is it based on a constructive vision of the market?
Economy
Are your resources being used productively? Do you use money management and risk management in your strategy?
Simplicity
Are there things in your strategy that you do not understand or could not make out? If so, get rid of it. The strategy should be as easy and understandable as possible.
Psychology
Are there elements of psychology in your strategy? What are you doing to get rid of the human factor and bring everything into a state of consistency?
Flexibility
Is it possible to move resources within your strategy? Will you be able to quickly respond to the volatility, cyclicality of the markets?
Speed
Is it possible to quickly redirect your "forces" within the strategy? Do fundamental things, undefined responsibilities and forms diminish your ability to act quickly?
Security
Is it clear which information has to be kept secure? Do you spread your plans?
Initiative
Does the strategy allow you not to follow the crowd and stay ahead of the competition?
Accuracy
Are you focusing your efforts in those areas that provide the greatest opportunity?
Commitment
Does everyone feel a part of the initiative and passionate about achieving its goals? Or do just a few people “own” the initiative?

Major fundamental news affecting The PriceFundamental news in the forex market provides the greatest energy for price movement. Only often these movements are unpredictable.
I have a news trading strategy in my feed titled "How to trade The News Correctly" ,
I recommend it to study if you have an aggressive trading style and want to earn even more on news
1)
Employment figures
The most important news event that all speculators and investors are guided by
is non-farm pay. This news event increases several times, at the time of the news
release, the volatility of the main instruments on which traders earn. The NFP
usually comes out on the first Friday of every new month.
2)
Balance figures
An indicator characterizing the difference between the value of
exported / imported goods and services
3)
Speeches and minutes
Last mention of key speeches and minutes such as ...
1) DOMC Statements and Press Conferences
2) Voting on MPC ratings and speeches by the Governor of the Bank of England
3) Press conferences of the ECB and speeches by the President of the ECB
4)
Retail Sale figures
the indicator characterizes the strength of consumer demand. Its growth indicates
an increase in the production of goods, a strengthening of the economy and currency.
Included in the calculation of GDP
5)
Consumer Price Index (CPI)
Reflects the shift in the cost of core consumer goods and services
6)
Expected and Forecasted Figures on the way out news
1) Positively affects the strengthening of the currency when the actual
figures after the release of the news turned out to be better than the predicted ones
2) Badly affect the strengthening of the currency when the actual numbers
are worse than expected
7)
Any kind of news that is spoken during these events has a very strong effect on all
foreign exchange and not only markets. Traders navigate and trade depending on
how they think a certain currency of the respective country can react.
❗ ❗ ❗ Constructiveness in trading: follow the news when trading and try not to open orders for half an hour, at the time of release and after the release of news for half an hour ❗ ❗ ❗

The 8 Universal Rules of Successful TradingUTPs (Universal Trading Principles) are a set of trading rules you must not break. They cover entries, exits, strategies, and risk management. They form the backbone of your trading plan. Repeat these rules everyday, like a mantra, until you can recite them in your sleep. This will make you a successful trader.
1. Don't leave money on the table - I move my SLs to breakeven and lock in profits as the trade goes in my direction. The first rule of trading is to protect my trading capital. Without my capital, I am out of the game and cannot be a trader. So I do everything possible to protect it.
2. I scale in and out of trades - If my trade idea seems to work, I add to my position. If my trade doesn't work and approaches my SL, I am reducing my position. I am ALWAYS adding to working trades and NEVER to losing trades. This is how the most successful traders trade, and this is how I want to trade.
3. Final TPs - My final TP is based on horizontal S/R levels, weekly or monthly highs and lows. I confirm that markets are mostly ranging, i.e. my final TPs are always based on the normal distribution (e.g. weekly or monthly ATR). My TPs need to be REALISTIC.
4. Technicals are used only for entries and exits. The direction of the market is determined by fundamentals. I never trade against the fundamentals.
5. Position sizing - My stop-losses are always based on sound technical levels. My position size depends on the size of the stop-loss and the percentage of my trading account I want to risk on any single trade. I never risk more than 2% on a trade, and cut the risk-per-trade to 1% after a series of three losing trades.
6. Trading is a probability game - I acknowledge that successful trading is about probabilities. I don't know whether my next trade will be a winner, but I do know that I have a good chance to be in profit after the next 10 trades.
7. Trading is as simple as you make it - Fundamentals support my trades, but everything can happen (including a change of fundamentals and sentiment). Risk management prevents higher losses. There are always new opportunities. My goal isn't to be right, but to follow my UTPs.
8. Weekly journal reviews - I don't measure trading success by the profits I've made or the number of winning trades. My success is measured by how strictly I followed my UTPs. To review my trading, I am performing weekly journal reviews and try to identify any trading patterns that have a negative influence on my bottom line.

🎓 EDU 7 of 20: Use the Power of Intermarket Analysis 🔀Intermarket analysis is an often neglected and overlooked type of analysis among traders. However, it's a powerful tool that can help you anticipate future price movements by following the performance of other, closely-related markets.
Intermarket analysis refers to the analysis of other asset classes that can provide valuable and actionable insights into related markets, such as forex.
In this part of our Intermarket analysis lesson, we'll be focusing on a specific asset class that has a very close connection with currencies: the sovereign bond market and yields.
As you already know from my previous educational posts, currencies tend to follow interest rates. With the fall of the Bretton Woods agreement, currencies became freely-floating and capital started to move to places with the highest yields, which meant higher returns for investors.
For example, if Australia has a 3% interest rate and Japan a 1% interest rate, investors could buy AUD to collect a 3% rate and short JPY by paying a 1% rate, leaving them with a net profit of 2%. This is how carry trade work, and the long AUD/JPY was one of the most popular carry trades given the large yield differential between Australia and Japan.
That's why you need to follow yield differentials in your trading. The chart above shows the EUR/USD pair, and the 2-year yield differentials between 2-year German bonds and 2-year US bonds. Notice that we're using German bonds (also known as "bunds"), since Germany is the largest European economy.
To add yield differentials to your chart, simply hit the "+" (compare) above your chart and type in "DE02Y - US02Y" with a space between the symbols. This also works for other currencies. Here is a list of symbols for the major currencies and their respective bond yields: US02Y, CA02Y, GB02Y, DE02Y, JP02Y, AU02Y, and NZ02Y. The currency should be self-explanatory from the symbols (note, we also the German 2-year yield when analyzing CHF.)
Notice how the exchange rate closely followed the differentials in yields. When German yields rose compared to US yields, capital inflows to the euro area increased demand for EUR, which lifted the exchange rate.
Similarly, when US yields rose compared to German yields, capital inflows to the US increased demand for USD, and the EUR/USD pair fell (meaning a stronger USD.)
The dots you see on the chart are the individual bond yields (DE02Y and US02Y), because I like to have a picture of why the yield differential line is rising or falling (i.e., did the line fall because US yields are higher, or because German yields are lower?)
We are using the 2-year yields, because they tend to closely follow the monetary policy stance of the respective central bank. In other words, when the ECB turns hawkish, the DE02Y tends to rise (signaling higher interest rate expectations), which in turn would push the yield differential line higher (and most likely the EUR/USD pair as well.)
In the next part of Intermarket Analysis, we'll take a look at how other markets can impact currencies, like metals, commodities, and energy.
Please hit the "Like" button and follow, so you won't miss future trade ideas and educational posts!

Which trading strategy to chooseWHICH TRADING STRATEGY TO CHOOSE
There are many strategies, which in turn are divided
into several groups. For traders, strategy is their bread. Each trader chooses it for himself depending on his lifestyle, risk tolerance, psychology. I will tell you about 5 MAJOR CATEGORIES according to
which all strategies can be divided.
The first is scalping - a popular style of short term trading among traders. You need to have strong nerves, quick reactions and a cool head to win with this strategy.
Very fast trades with a small profit, but a small profit is recouped due to the number of trades made within the day.
Scalping is an intraday strategy, traders never roll over positions, it is against their system. These are often one to two minute trades; the tick chart or the lowest timeframes are popular.
Scalpers try to catch volatility, which often occurs when there is any fundamental thing. The most liquid instruments are traded. The most important thing a scalper remembers is the spread.
Day traders do not carry over trades overnight, open and close during the day. For them, a trading session is within one day or, if it is an exchange, the intraday time frames established by the regulations.
Working time frames for intraday traders are 5-30 minute intervals.
Within the day, the risks are less when compared with medium-term strategies, therefore, an increase in leverage is acceptable. Profits are obtained only from intraday movements of instruments.
A swing trading strategy is the opening and closing of trading positions based on the momentum of the underlying currency pair, often identified by indicators.
Their trading activity usually focuses on short-term changes in the exchange rate, with all positions being closed within one to four days, so they do indeed hold overnight positions.
The goal of swing trading is to identify a general trend and then profit from swing trading within that trend. Positions are closed within one to four days, so they do hold positions overnight.
The working timeframe is 4 hours and older. Swing traders are able to profit both from the trend and from the corrections, the task is to catch the movements in time.
News traders know that this is a rather risky job. The point is in key news events, the publication of important economic data.
Traders hunt for the volatility that news gives, a kind of energy for movement. They open trades, sometimes simultaneously in both directions, just before the news comes out and try to catch that very movement. Such strategies do not involve opening overnight positions.
Trades are opened as at the time of the news release, a little earlier, so you can open a little later to take advantage of the wide volatility that may occur.
A trend trading strategy has more medium and long term priorities. Includes the use of technical trading analysis to identify patterns, understand the trend, and find places to open a trade.
Open positions only along the trend, against the market in this system, traders do not trade
Working time frames for trend traders are daily, weekly and monthly, on which they conduct technical analysis, often use long-term patterns, as well as fundamental analysis to get ideas and forecasts. Traders of this category do not particularly react to the spread, therefore, they have the opportunity to trade a wider number of currency instruments.
Traders, if you like this idea or have your own opinion about it, write in the comments. I will be glad👩💻

Indicator introduction: Auto Trendline & Breakout AlertNote: This indicator will be published soon
In short, this indicator is a tool designed for different purposes:
1) Automatic drawing of trend lines
2) Classification of trend lines based on the reaction of price chart and trading volume
3) Receiving trend lines breakout alerts
4) Analyzing smaller time frames is time consuming and tedious, but this tool makes it easy. The following figure shows 1-min time frame:
How it works?
Trend lines are classified into 6 levels, of which only 3 are enabled by default.
Level 01 (Red Lines) is the strongest level. Therefore, the breakout of these lines is the most important signal of this indicator.
Volume verification helps you avoid fake Breakouts.
As you can see, both the labels and the table show the status of the trading volume when the lines breakout.
Trading volume is classified into 5 levels:
Over volume (confirmed ✅)
High volume (confirmed ✅)
Neutral
Low volume (potential fake breakout ❌)
Minor volume (potential fake breakout ❌)
This indicator can be used on both logarithmic and linear charts. (Scale in the settings menu can be changed from linear to logarithmic)
Finally, this indicator includes a trend line breakout alert and you can be notified wherever you are. you can add alerts to different charts and enter the market in the best conditions.
If you like it, please leave a comment.

How to trade The News Correctly Trading strategies on news for many traders play an important role, since one news can take a very good movement, it is important to observe the nuances of such strategies.
The essence of the strategy is to catch the movement and make money at the moment of the release of important news, becauseof which, most often, the volatility of the instruments we are interested in increases significantly, and it does not matter from the direction where the price will go.
NUANCES:
1) the entry point is located outside the range, in which the price was moving before the news was released
2) place two identical deals at the same distance in different directions
3) do not forget about stop loss
4) do not forget to set take profit
What a trader can get by trading on the news
1) At high volatility , slippage can be obtained. At such a moment, the trader can get both a larger loss than the planned one, or a smaller profit, and quite the opposite. More often slippage is bad for the trader's account
2) False breakout, which can deceive you and give you a loss
3) Bad work of the broker, usually if you use the services of "Kitchen". they "process" a lot of traders on the news in their favor.
What news is it permissible to trade such a strategy on:
Important news:
🔼 NFP
🔼 Retail Sales
🔼 Trade Balances
🔼 CPI
🔼 FOMC
The movement that a trader can pick up can be up to 50-70 points in some currency pairs.
What currencies and why
🔼 EUR/USD
🔼 GBP/USD
🔼 USD/JPY
These are the most traded currency pairs in the world, gold is not taken into account, the expected movement in these pairs can be up to 50-70 pips.
Important to remember ❗ :
🔼 These are the most aggressive strategies
🔼 You, during the news release, have no advantages, without this it is difficult to win
🔼 And it is best not to trade before and after the news release for at least half an hour.
-------------------
Share your opinion in the comments and support the idea with likes.
Thank you for your support!
