How do YOU trade harmonics?? So guys, there a tons of way to trade harmonic patterns.... in the end most of them fail so how do people trade them successfully...
I myself decided to look into different approaches to trading harmonics. I have looked at tons of charts on different timeframes and i found an approach I was not able to find online anywhere for some reason... (wonder why)
I have never seen a trading strategy that could provide you with this amount of RRR. The risk per trade is absolutely minimum, while the return is maximum.
The process is quite simple, and im sure this is what most of the real traders out there are doing, and probably charging thousands and thousands of dollars for teaching this to people. But its all good!
First you must find a harmonic pattern. This should be easy with all the software out there. (some guy said you take the ''art'' out of trading by doing this, please don't be that guy)
For this approach, price will have to see a retracement greater then 50% of CD in the harmonic pattern.
if price retraces down to the 61.8% this will follow with a pullback to 23.6%. Afterwards price will come down at touch the 23.6%, (sometimes a few pips above or below) to trigger all the pending orders. Price will fight its way up to touch the 127.2% extension, while finding support at fibonacci retracements greater then the initial 23.6% ( it will not go under this level! )
If price retraces down to the 78.6%, it is considered strong and the move is expected to turn at 161.8%
In some cases the move will go much higher, extending up to 4.618% (!!?)
Same approach for bearish situation.
Now the price does not always retrace to those exact levels, but when it does you can be 100% sure that it will happen.
With this approach you will have signals, confirmations and entry points based on pure data!
If you happen to find this approach useful, give the post a like and comment below with your ideas.
God bless
Signals

FTSEMIB, FTSE MIB Index - Potential Breakout on ParabolaINDEX:FTSEMIB
The parabolic support guides us on a possible breakage of this resistance on the Italian index would make very interesting from the point of view of Risk Reward this potential trade since from that level onwards would meet much less resistance giving confidence to buyers to ride a possible trend.
Set alerts!
Stay Tuned!

NSC, Norfolk Southern Corp. - Trend Analysis & PatternsNYSE:NSC
Why do I choose technical analysis for trading?
Because the psychological state of traders / investors is always a representation on a scale between greed and fear, which creates in all markets patterns that repeat themselves for more than a hundred years, and if you are aware of their % profitability, and the difference between the amount of profit compared to the amount of loss, you would know statistically how your account would behave.
And if you would know how to manage your capital in terms of recapitalization and allocation, then I see no reason not to operate in this way.
This is also confirmed by my results with respect to the theory. The % of annual profits, maximum drawdowns and periods of underwater that are extremely aligned with the results of my backtest made right on this type of trading.

A little about my trade - 4 (in vain forgotten the basics ...)Work on timeframes from M1 to H4. The most profitable trade is obtained by M5, M15. At large time intervals, trading is unprofitable, as large stop loss is required.


EURUSD - Clear Trading OpportunityAfter EURUSD retests to the 1.23800 resistance level, it will bounce back off due to insufficient buying momentum. This is a clear trading opportunity: simply enter the trade selling EURUSD when it has reached the resistance level, put your stop loss above the 1.23800 resistance level and take profit a bit above the 1.12500 support level to be safe.

BITCOIN and GOLD! Short term connection that can reveal a lot!You are all familiar with the similarities between Bitcoin (Digital Gold) and Gold on the long term and on a cycle wide scale.
Similarities that have allowed to accurately price Bitcoin's bottom:
Or still see an early entry on the Golden Cross occurence:
Even spot the parabolic extension from the 0.382 Fibonacci level to the 0.618 peak:
What is very interesting is the similar candle action on the short term price movement between the two. Again Gold appears to be leading BTC!
Can it be a coincidence that both store of value assets have broken into a new bull cycle and made their peak at the same time?
Surprisingly Gold is more aggressive trading well above the MA200 and since yesterday even above the MA50. This is also better illustrated by the fact that Gold managed to make a peak on the 5 Fibonacci extension (from the consolidation phase), while Bitcoin managed to peak at 4.236.
This is purely an educational analysis intended to develop the general notion that Bitcoin and Gold (digital store of value and physical store of value) are by nature interlinked.
What are your thoughts on this study? Can Gold show the way to BTC even on a shorter time frame?
As usual let me know in the comments section!!


BITCOIN vs LITECOIN comparison. Bull market leader shift.Just a quick mention on something interesting I stumbled across while constructing my long term LTCBTC strategy.
During the 2015 recovery phase after the bear market, Litecoin started rising aggressively prior to Bitcoin and led cryptos into the start of the new bull market. At some point it pulled back considerably and BTC started gaining momentum and lead the bull market while LTC entered a prolonged consolidation period. BTC made minor pull backs but never "looked back" on its way to a parabolic rise to the 2017 All Time High.
This is a simple comparison intended to illustrate the shift in market dynamics. We see the very same situation taking place now.

Do you believe in Bitcoin Fractals? If so then take your pick!I am going to keep it simple on this one. After all Bitcoin is not a complicated asset, it follows the same patters and cycles again and again (longer term to a greater extent).
So if you are into Fractal Analysis I have something for you that may be of interest. Since the December bottom we have a steady rise. Steady and not aggressive/ parabolic as BTC is still in the Accumulation Phase will most likely stay there for quite some time before it breaks or makes new All Time Highs again.
Steady price action calls for clearer patterns with more standard entry/ exit points. So I attempted to break down this steady rise into 3 Fractals, all having as a common factor the duration, which is approximately 53 days. Assuming the current one (3rd in succession) lasts for 53 days as well, what remains to be calculated is the relative price action within.
If it follows Fractal A then it (Fractal C) should make an equally steady decline of around -22%.
If it follows Fractal B then it (Fractal C) should trade sideways within 4900 and 5500 until its completion.
If I am taking a pick I would go with Fractal A mainly because it (Fractal C) is close to Double Topping around the same time (22 days). Also the rise from their bottoms is more close.
Take your pick and let me know what you think in the comments section!
P.S. For the record (because you may misinterpret my approach), MA analyses and Fractal pull back levels are only suitable for buy on the low, sell on the high to short/ medium term traders. Long term investors (like me) should keep what they already have on their portfolio and stick to adding/ accumulating Bitcoins on those pull backs.
In the meantime, feel free to take a look at some related material on BTC:

Bitcoin Cross is about to happen! See how to trade the pattern!The 1D MA50/ MA200 Cross (Golden Cross) is about to take place and you are still wondering how to trade it?
Well the last time that happened in July 2015 following the previous bear cycle's bottom, Bitcoin pulled back by around -35%. Then the price rebounded towards a Death Cross (1D MA200/ MA50) that made it consolidate before a new (and final) Golden Cross that pushed BTC to new highs.
The Distance between the 1st Golden Cross and the Death Cross was around 62 days and the (D) between the Death Cross and the 2nd Golden Cross 42 days.
I have tried to plot the same pattern into today's chart. The conclusion is yours!
*Bonus the Ichimoku Cloud which plots a path ahead of the Crosses!
It never hurts to look at related material:
The MA cross on the 1W chart
The pull back explained by the RSI

Ethereum buyers shouldn't worry and here is why!Cryptos have a habit of repeating some patterns over and over again. Ethereum is no different.
I took a closer look to Ethereum's bull market and in particularly 3 fractals which all appear to share a similar candle action to ETH's price volatility from October 2018 to date.
Initial price drop, high volatility (consolidation) with an obvious Resistance and then aggressive rise. The exception is Fractal B which consolidated longer (almost twice as long) making a re-test of the initial drop/ low (even slightly breaking) it, before it broke out. It did however increase much more than then other two (around +4,300% as opposed to Fractal A +1,800% and Fractal C +480%.
Assuming that ETHUSD hit the bear cycle's bottom in December, we can expect it to start rising more aggressively on the short term. If I had to make a pick one Fractal of the three to fulfill this scenario that would be Fractal B as in duration it is much more similar to Bitcoin's expected consolidation phase. In that case we have roughly another 175 days of trading between the cycle's bottom ~80 and current Resistance ~ 185.
Do you think ETH bulls need to worry? Hit me with your estimate in the comments section!!

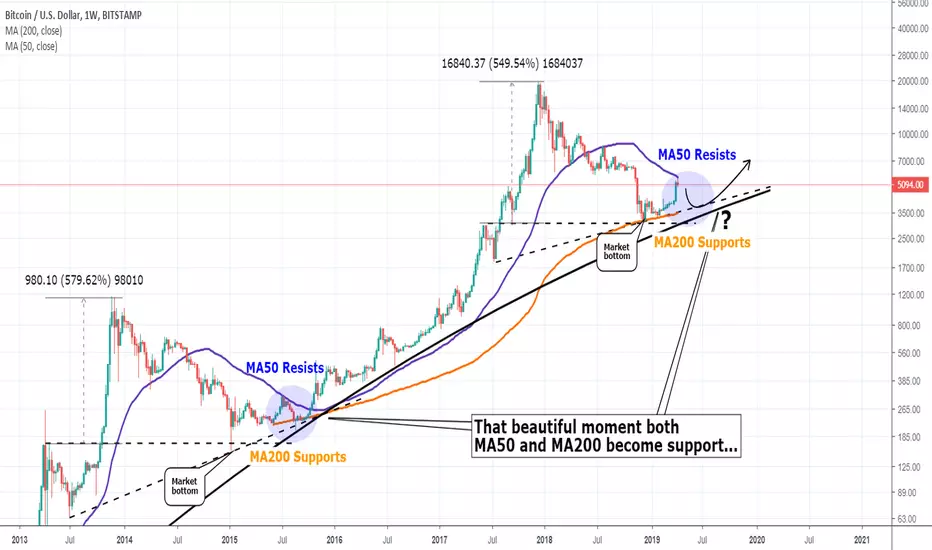
The party is just around the corner on BTC and you are not late!Ok apart from the humorous title, what I want to make clear on this chart is that Bitcoin has entered the final stage before the lift off. Before every low is higher than the previous. Before the new bull cycle essentially begins.
How that happens? Well for starters we can, with a high degree of certainty, say that the bottom is in (priced on December). The reason is clear on the chart particularly on the support offered by the parabola.
So where are we now? Well BTC sits on a tight squeeze within the weekly MA50 (applying Resistance) and the MA200 (applying Support). In the previous cycle the final test of the MA200 signaled the start of the new uptrend. Why? Because the MA50 was crossed emphatically and became a support ever since until the new All Time High. So when these two conditions are met, I expect a non-stop rally to take place.
I would consider the Halving also but I don't want to make the chart too complicated.
After all trading Bitcoin has been and still is pretty simple because every cycle is fairly similar to the previous one and follows a specific set of rules. If you are an investor, wait for that long term buy, forget your investment for 2-3 years, come back and profit. If you are a trader, buy on every pull back during the bull market and sell on every rise during the bear market.
Now why I say this? Because traders can wait for that pull back for the final test of the MA200 to reload longs, as I have been making quite clear on my last analyses (see below), while investors can feel pretty comfortable accumulating more coins on every pull back.
Are you waiting for that magical moment too and start the party??? Let me know in the comments section!!

Binary Options. Trade on the graph of 1 M .Detailed description.Hi Friends! Recently, there have been many questions about my trading system, people are asked to tell in more detail how it works and when to enter into transactions.
In this article I will try to tell you as much as possible about all the main points of my strategy on the items in the style of the answer to the question.
1. Q: what's the strategy ?
Answer: the strategy for binary options consists of two indicators . The main indicator is Binary OPtions Pro Trade №1 (the indicator shows overbought and oversold zones.
you can set an alert to not miss signals )
You will also need another indicator Binary OPtions Pro Trade №2 (this slightly improved stochastic in this case serves as a filter for a more reliable signal)
Example of work on EUR-USD 1M.
2.Question: on what timeframe to trade and what time to use for expiration.
Response: the strategy is designed primarily to trade on 1 m. it is Also possible to use 5 m.
The expiration time is recommended no more than 3 candles (2-3 minutes per 1 m, or 10-15 minutes if after 5M )
3.Q: what is the signal to enter a trade and when to exit?
Answer: If you did everything correctly, two indicators should be opened on the chart: Pro Trade № 1 and Pro Trade № 2.
Sell signal (down)
1.Look at the main indicator № 1
2.wait until the line with points goes beyond the yellow zone and appears on the upper border in the red zone .
3.when the indicator appears, the Red Beam is a signal when you need to pay attention to the second indicator №2
if both lines on No. 2 are also in the red zone and are close to each other or have already done so
this is a great sell signal.
4.We enter the trade when you open a new candle after the candle that gave the signal.
Attention Is Important ! If the candle in the last seconds of riding, has formed a large shadow. better not rush in.
Buy signal.
the situation is similar except that the line should go to the green zone on the indicators №1 and № 2 .( why the extra entry)
4. Q: enter into business as soon as the Red Beam appeared ? and if there are several in a row, what to do?
Answer: (for those who are in the tank) the Beam is not a signal it is a signal for you dear colleague for you to pay attention to the schedule and assess the situation,
if you suddenly busy with something more fun ( so you can configure the signal and you will only not miss)
the signal at the input strictly corresponds to the conditions that I indicated in the answer to question № 3.
5. Q: how do I set up an alert ?
Answer: hover the mouse cursor over the red beam on the display number 1 press the right button to open the selection window the top row add alert .
that would Alert was repeated automatically select the Settings (in bar) of the melody in its sole discretion and ready
now the schedule will alert you at the right time .
6. Q: what should I do if the signal is false ? do I need to use martingale ?
Answer: don't panic, colleague. We're waiting for the next signal . Martingale, Dogon, SK and other nonsense is not recommended .
Only a fixed amount, which in the first stages does not exceed 2% of your Deposit and in the future not more than 5 % . And you will be very happy.
But if you like to make fun of your nervous system, it's all in your hands .
7. Q: how to get the strategy ? the lights are off ?
Answer: If you want to try this strategy. Write to me in private messages, I will give you the opportunity .
These are all the main and most important points pointed out .
I hope you had fun with friends and this information will be useful to someone .
If you have any questions, please contact me in private messages . Good luck !

Importance of key SUPORT and RESISTANCE levelsAs you can see from the chart we have used purple lines to show key support and resistance levels ( levels where price has bounced off in either direction ) Even after the market crash of 2008 the price eventually found key support and resistance levels that had been used years before.
The price respects these levels as thousands of traders will also be watching these levels and therefore they will also set orders for these levels hence why the price keeps respecting and bouncing off these levels.
We believe in keeping trading as simple as you can to save confusion and key support and resistance levels are a key factor in our swing trading style.
If you would like more lessons like this or would like to receive our signals then message us as we offer a 2 weeks FREE trial to our VIP group.

The phenomenal Successful Trading Plan 103 & 104SELF DEVELOPMENT/METHODOLGY/PSCHYOLGOY
The phenomenal Successful Trading Plan 103/04
3. Trade Preparation
By concentrating on getting ready, the exchanging plans for the higher time allotments, the cash administration will dependably keep the proportion altogether. Trade proportion is the quantity of pips one may make versus the quantity for which one has a chance. Trade proportions for swing exchanging the H4 time span can be around +3 to +5 to +1 positive, which is incredible. However, on the D1 and W1 time periods, it can be +5 to as high as +50 to 1 positive.
4. Trading Rules
As with any business, money management, or in the case of trading, trade management, is a crucial element that needs to be addressed in your trading plan. Having a robust trading plan with predetermined trading rules will allow you to act subjectively in response to market changes. Trading is not about winning all the time; it is about effectively managing your trades, whether they are winners or losers. Unfortunately, many come to trading with a gambling mentality and do not exploit the advantages available when managing trades.
Do not risk one cent on the market until you have clearly defined each of your trade management rules.
Following are seven trading rules, which you must determine for each and every trade you make and some potential considerations for each:
1. Entry
2. Initial Stop Loss
3. Position Size
4. Re-entry
5. Trailing Stop Loss
6. Adding (Position Building)
7. Profit Taking Exit Strategies
For each one of these rules, you must have a pre-defined trading plan. You must know when you will enter the trade and execute your entry when the criteria are met. You must know your initial risk for each trade as determined by your initial stop loss before you risk any money on the market. You must plan when you will add to your winning positions and how you plan to exit your winning trades. It is not effective to determine your trading plan while in the trade. Emotional and psychological factors will influence your judgement and affect your decisions
FOLLOW YOUR TRADING PLAN, REMAIN DISCIPLINED AND KEEP LEARNING :)
More elements will follow... Like, share, Comment and follow us to keep updated on our professional trading ideas and education :)

Trading Entry and Exit ChecklistsSELF DEVELOPMENT/METHODOLOGY/PSYCHOLOGY
Trading Entry and Exit checklists
Over the past 18 years of trading, it has been a crucial step in my development to constantly critique myself and my trading strategy. I constantly monitor my performance on a daily, weekly,monthly,quartley and yearly timeframe. Listed below is a small simple example of some of the checklists that i have used in the past prior to entering and exiting a trade.
Entry Rules
1. Is the stop loss placed past the strongest support or resistance line?
2. Am i following my trading rules?
3. The risk/reward is acceptable
4. Have i double checked my entry/stop loss and target position?
5. No news announcements that will affect my trade?
6. Bid/ask spread - Is it in normal range for this pair, this session, this time?
7. AM i risking more then my agreed 1%?
8. Correlation - AM i trading against myself with already open trading trades?
Exit Rules
1. Has the market behaved as predicted? If so stay on track
2. Has the trade reached the support or resistance line?
3. Has the stop been placed too far away? or to close?
4. Am i exiting to early?
5. If unsure of trade exit immediately?
6. If i was impatient and entered trade exit immediately?
7. Is there an upcoming news event that will affect my trade?
8. Is the trade changing directions?
9. Don't take profits to early!! Are you exiting before your target line?
How has yours differed? is it similar?

Bullish Marubozu CandlestickThis is called a Bullish "Marubozu" Candlestick. This candle is considered a weak indicator. Depending on what comes after this candle , this could be a bullish continuation or bearish reversal. This candle usually have no wicks on either end. The color of this candle is either Green or White. Check your charts and search for them everywhere and see what comes after this type of candle.

How to Analyse Chart Patterns (Tutorial 1) - Forex - CryptoHere are 2 very common example of how to analyse the graphs and predict the future movements of the price. Many times the big moves happen thanks to new, but no matter what they respect the graphs.
Second graph is very interesting as you will be able to find it in both BTCUSD and EURUSD, signalling that the pairs are analysed and traded by the same people. These patterns apply to FX, Crypto, Stocks and Indices.
Message me if you have any ideas that you might be interested to discuss or for other advices.
_____________________
A product of T O T O Capital

Strategy for Binary Options profit 510$ for 5 hours trades 18.06Hi Friends ! Once again share their trade statistics according to the strategy "Scalping About" Binary Options.
on Monday, most often I start trading in the late afternoon using for analysis two currency pairs EUR-USD and GBP-USD timeframe 5M trading time from 18: 00 to 23: 00 time zone +7 UTC
Trading result.
EUR-USD
10+ 2-profit was300$
GBP-USD
9+ 3-profit was210$
below are screenshots of trading as well as instructions for the strategy and a link to the script .
If you are interested to try my strategy in business write to me in private messages .
EUR-USD
GBP-USD
Basic instructions for the strategy.
Included in the Deal.
A false Signal and how to act .
link to the script with the description .

trend indicator for Binary Option 80% of profitable trades This trend indicator for binary options shows excellent results both on currency pairs and crypto currencies .
You can work on most currency pairs and on different T. F, but the settings are more adapted For M 5, M15
The indicator shows the price reversal in the form of red and green dots when the candle is closed .
buy signal.
a green/dot should appear on the indicator after the candle closes .
entering a trade at the opening of a new candle the time of the trade is one candle .
sell signal.
a red/dot should appear on the indicator after the candle closes .
entering a trade at the opening of a new candle the time of the trade is one candle .
If you strictly follow the recommendations and work within this strategy, the percentage of positive transactions is about 80 % .That allows you not to use "martingale" and stay in the black with minimal risk.
If you are interested in this indicator for access write to me in private messages ! ( comments rarely looking better to write in private messages )

Scalping strategy for Binary Options 70-80% positive tradesHi Friends ! I decided to show how my strategy works . Quite well shows the turning point of the price .
This is a strategy for Binary Options . Perfect for those who are not much in a hurry and loves to trade on scalping (Strategy as simple and reliable)
The strategy consists of two main scripts and one auxiliary that allows you to use the free version of T. V
You can work on most currency pairs and on different T. f, but the settings are more adapted For t. f M5
Support and resistance levels are drawn and updated automatically, which is very convenient for beginners .
If you strictly follow the recommendations and work within this strategy, the percentage of positive transactions is about 80 % .That allows you not to use "martingale" and stay in the black with minimal risk.
But if you still like the martingale it is usually enough 3 rarely 4 steps. ( I advise you to use martingale only after two months of practice on this strategy )
Below are screenshots with more detailed recommendations .
How to choose the right entry point.
How to act with a false signal .
As an example screenshots with statistics for the last week on the EUR-USD Timeframe 5M.
statistics
14.05
15.05
16.05
17.05
18.05
If you are interested in this strategy to gain access to all three of the necessary script, please contact me in private messages !
( comments rarely looking better to write in private messages )
