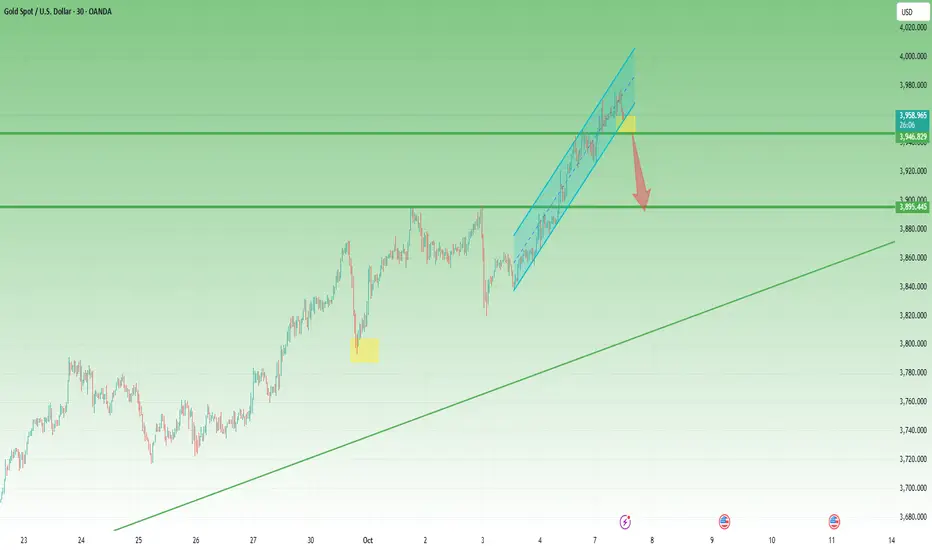
Lingrid | GOLD Weekly Analysis: Momentum Builds for $4000 TestThe price perfectly fulfilled my previous weekly idea . OANDA:XAUUSD continues to demonstrate remarkable strength, with each pullback presenting fresh buying opportunities for astute investors. The market has established itself as a premier risk-off asset, attracting capital flows that sustain its bullish momentum across multiple timeframes.
The technical architecture shows gold trading at $3,886, firmly within its ascending channel that projects toward the psychologically significant $4,000 milestone. The chart illustrates a classic A-B-C movement followed by renewed impulse legs, suggesting the market is building energy for its next major thrust after breaking EQHs. The current positioning near $3,855 sits comfortably above the upward trendline, indicating structural integrity remains intact.
Historical patterns suggest caution at current elevations. September's explosive 12.65% gain created the foundation for this rally, but similar momentum surges have previously preceded meaningful retracements. The daily chart's correction zone around $4,000 - $4,100 combined with the monthly perspective showing gold approaching $4,000 after completing its ABC pattern indicates possible exhaustion. A 9-10% pullback toward the $3,600-$3,650 support zone would mirror previous consolidation behavior and align with the upward trendline support at $3,720.
The equal highs formation and flag pattern suggest institutional profit-taking may be imminent. Smart money would view any decline toward channel support as a strategic reload opportunity before gold's anticipated assault on $4,000 and beyond.
If this idea resonates with you or you have your own opinion, traders, hit the comments. I’m excited to read your thoughts!
Signalservice

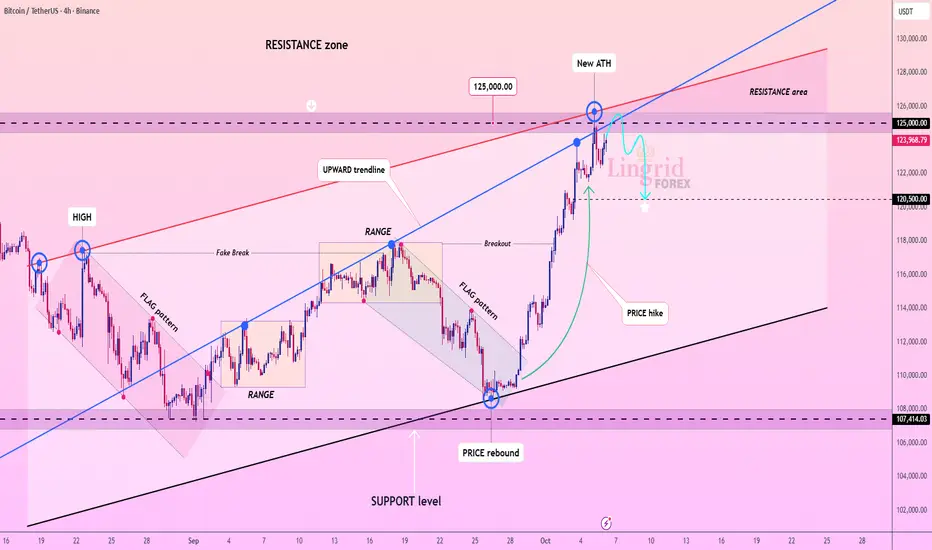
Lingrid | BTCUSDT Round Number Rejection Pullback ExpectedThe price perfectly fulfilled my previous idea . BINANCE:BTCUSDT is facing rejection near the 125,000 resistance after reaching a new all-time high. Price action shows exhaustion at the top boundary of the rising channel with early signs of retracement. A close below 123,000 may confirm a deeper correction toward the 120,000 support zone. Momentum suggests sellers are attempting to take control following the extended bullish rally.
⚠️ Risks:
A sustained move above 125,000 could invalidate the bearish setup.
Strong institutional buying or ETF inflows may renew bullish momentum.
Softer U.S. economic data could weaken the dollar, supporting crypto recovery.
If this idea resonates with you or you have your own opinion, traders, hit the comments. I’m excited to read your thoughts!
USD/CHF: Bears Defending the TrendlineUSD/CHF continues to respect the descending channel structure that has been in place since mid-August.
After a short-term recovery, the price is now retesting the upper trendline resistance and the 0.8000–0.8020 supply zone, where sellers have previously stepped in.
Technical Outlook
Structure: Descending channel – clear series of lower highs.
Resistance zone: 0.8000–0.8020 (channel top + previous rejection zone).
Support zone: 0.7870–0.7840 (recent demand area).
Moving averages: Both 50 and 100 MAs are flattening but still below the resistance, suggesting limited bullish momentum.
Bias: Bearish below 0.8020 — expecting rejection and continuation to the downside.
Fundamental Context
Recent U.S. data has shown mixed inflation numbers, while Swiss CPI remains stable, reducing expectations for any SNB intervention.
The stronger Swiss franc remains supported by safe-haven flows amid global uncertainty.
Unless the U.S. delivers a clear upside surprise in macro data, the pair is likely to remain under pressure in Q4.
Trade Setup (Not Financial Advice)
Entry zone: 0.79700–0.79800
Stop-loss: 0.8020
Targets:
TP1 → 0.7900
TP2 → 0.7845
🧭 A break below 0.7930 would confirm bearish continuation within the channel.

EUR/USD: Bulls Preparing for a Comeback?The pair is hovering just above the 1.1650 support zone, which has acted as a strong demand area multiple times since late June. Price is currently testing this level again, while both moving averages ( 50 & 100 MA ) are slightly above — signaling a potential oversold condition if we see rejection here.
Technical Outlook
Support: 1.1650 (key short-term level).
Resistance: 1.1720 → 1.1800 (MA cluster + previous lower highs).
Bias: Short-term bullish if 1.1650 holds.
Setup: A bullish reaction at this zone could trigger a rebound toward the 1.1750–1.1800 range.
Invalidation: A clean 4H close below 1.1640 would flip bias to bearish continuation.
Fundamental View
Recent U.S. data has shown signs of slowing inflation and consumer activity, which might reduce pressure on the Fed to maintain a hawkish stance. Meanwhile, the ECB’s neutral tone suggests less divergence between the two central banks — a short-term positive for the euro.
If the next U.S. CPI release comes in softer than expected, EUR/USD could easily rally back toward 1.18+.
💡 Trade Idea (Not Financial Advice):
Watch for bullish confirmation near 1.1650–1.1660 with a tight stop below 1.1610.
First target: 1.1750,
Second target: 1.1820.

USDJPY — Bulls in Full Control: Is 152 Next?Bias: Bullish
Timeframe: 4H
1. Technical Overview
USDJPY continues its impressive upward momentum, breaking through several key resistance zones as the pair approaches the 151.00–152.00 psychological level — an area that historically triggered major reversals.
We’re currently witnessing a strong bullish structure supported by the 50 and 100 MA, both trending upward and providing dynamic support. The breakout above 150.00 marked a clear shift in market sentiment, confirming the dominance of buyers.
The next key resistance is located at 151.90–152.20, which was the peak of the last major rally before the Bank of Japan intervened earlier this year. A daily close above this level would open the door to 153.50–154.00, potentially signaling the start of a new medium-term uptrend.
___________________
2. Price Action Analysis
Support zone: 149.50–150.00 — previous resistance now acting as a pivot area.
Resistance zone: 151.90–152.20 — last major high and potential barrier before new highs.
Market structure: Clear sequence of Higher Highs and Higher Lows.
Momentum: Bullish volume expansion, confirming strong participation by institutional buyers.
Price is currently consolidating below the resistance area, forming a potential bullish flag pattern on the 4H chart. A breakout from this mini-structure would confirm continuation to the upside.
___________________
3. Fundamental Context
From a macro perspective, the divergence between Fed and BoJ policies continues to drive this pair upward.
The Federal Reserve maintains a restrictive stance as inflation data remains above target, keeping the USD supported.
The Bank of Japan, meanwhile, sticks to ultra-loose policy and continues yield-curve control, suppressing JPY strength.
Additionally, rising U.S. Treasury yields provide further tailwinds to USDJPY, while Japan’s inflation and wage growth data haven’t shown the strength needed to justify policy tightening.
Unless we see verbal intervention from BoJ officials or a sudden USD correction, the path of least resistance remains to the upside.
___________________
4. Trading Plan (For Reference Only)
Long entry: 150.80 – 151.00 (on retest or small pullback)
Target 1: 151.90
Target 2: 153.50
Stop loss: Below 150.00
Risk-reward ratio: 1:2.5
___________________
5. Summary
USDJPY remains fundamentally and technically bullish. The market shows no immediate signs of exhaustion, and all eyes are now on whether bulls can sustain momentum above the 152.00 threshold — a breakout that could accelerate the rally further.
As always, watch for BoJ rhetoric near these levels — it’s the only real wildcard that can disrupt the current trend.
___________________
Trade safe, plan your entries, and never fight the trend.
— Simon Weber | ICEBERG FOREX SIGNALS

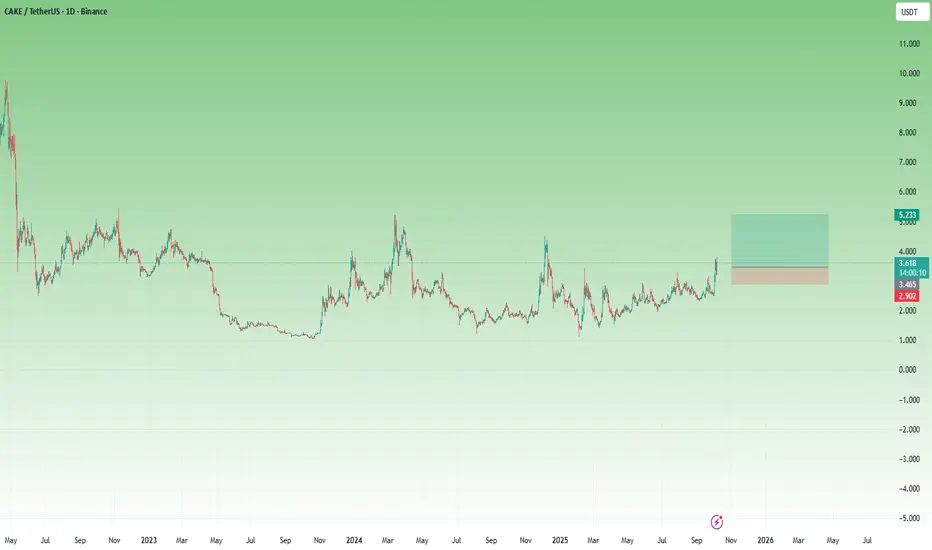
CAKE – Ready for Continuation After a Perfect Breakout RetestAfter the low from April, which aligned almost perfectly with the 2023 bottom, CAKE has shown remarkably constructive price action, steadily forming higher lows and repeatedly pressing against the $3 resistance zone.
Last week, the price finally broke above this major resistance and, in a textbook technical fashion, came back to retest the breakout level before rebounding strongly — confirming buyer commitment.
At the moment, CAKE trades around $3.5, holding well above the former resistance and showing signs of a potential upside continuation.
________________________________________
Key Levels & Outlook
• Support: $3.0 (former resistance, now key support)
• Intermediate target: $5.0
• Extended target: $10.0 (if momentum and broader market sentiment remain strong)
________________________________________
Trading Plan
My preferred strategy is to buy dips against the $3 level, aiming for $5 as a soft target, while keeping a runner for a potential test of $10 if the bullish momentum accelerates.
CAKE has proven resilience — now it’s time to see if it can turn this constructive structure into a sustained breakout.
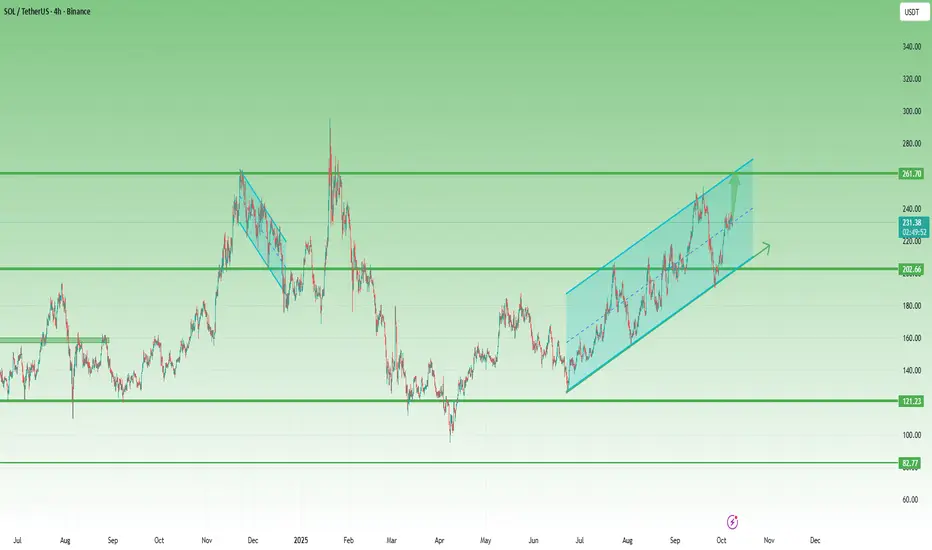
Solana in an Ascending Channel – Bulls Must Hold Above 215After the strong correction from 300 to below 100, Solana finally started to recover. Following an impressive 90% rebound, the price corrected again but managed to form a higher low just above the 120 support zone — a constructive signal for medium-term buyers.
Since then, Solana has been trading inside an ascending channel, showing consistent bullish control with well-defined higher highs and higher lows.
Recently, the market spiked slightly below 200, only to confirm the lower boundary of this channel before bouncing back.
In my previous SOLUSDT analysis, I mentioned that it was imperative for bulls to hold the 200 level to validate the ongoing reversal structure — and that’s exactly what happened. The market respected this support zone perfectly, leading to a 15% advance since then.
At the time of writing, Solana is consolidating near the midline of the ascending channel, suggesting a temporary pause before the next potential leg higher.
If this consolidation breaks to the upside, the next key target for bulls is 260, a confluence resistance formed by the upper boundary of the channel and the November 2024 swing high.
________________________________________
🔹 Summary
• Strong support: 200 (confirmed)
• Ideal bullish threshold: Above 215
• Next resistance: 260 followed by 300
• Structure: Ascending channel – continuation pattern
________________________________________
In conclusion, Solana remains bullish while holding above 200, but ideally, the price should stay above 215 to preserve upside momentum.
A breakout above 240 would likely trigger a test of 260 followed by 300, which becomes very probable— the next key resistance zone. 🚀
Gold: The Higher It Flies, the Louder the Correction WhispersAs explained in my Sunday video, the new all-time high for Gold is not a question of if, but how high it can rise once it firmly breaks above 3900.
Indeed, Gold has continued its unstoppable march, printing ATH after ATH, with the latest one formed during today's Asian session at 3977 — another almost 1,000 pips gained since Friday’s close.
At this point, there are two undeniable facts every trader recognizes:
1. The trend is extremely bullish.
2. A correction is long overdue.
________________________________________
Technical Outlook
The recent rally remains contained within an aggressive rising channel, but the overlapping highs in the last few hours reveal signs of exhaustion.
A confirmation for even a minor correction — and in this case, with Gold moving vertically, a 500-pip retracement would count as minor — would come with a break below the 3955–3850 zone.
Such a move would likely open the door for a retest of the 3900 area, which now serves as a key support.
________________________________________
Trading Plan
At the time of writing, I’m holding a short position, fluctuating near entry, with small alternating gains and losses.
While I do expect a pullback, I also keep in mind Keynes’s timeless reminder:
“The market can remain irrational longer than you can remain solvent.”
That’s why my stop loss is tight, and my focus is on discipline over prediction.
Lingrid | GOLD Persistent Bullish Trajectory ContinuesThe price perfectly fulfilled my previous idea . OANDA:XAUUSD is holding firm above 3900 after setting a new ATH near 3980 within the upward channel. Price action confirms bullish structure, with higher lows and trend continuation signals. A rejection support zone near 3920 could open the path for a retest of the 4000 psychological resistance. Momentum structure suggests bulls remain in control while targeting the upper boundary of the channel near 4000.
⚠️ Risks:
A breakdown below 3920 could trigger correction toward 3819.
Stronger USD remarks may limit upside potential.
Weakening global demand data could dampen gold’s bullish momentum.
If this idea resonates with you or you have your own opinion, traders, hit the comments. I’m excited to read your thoughts!

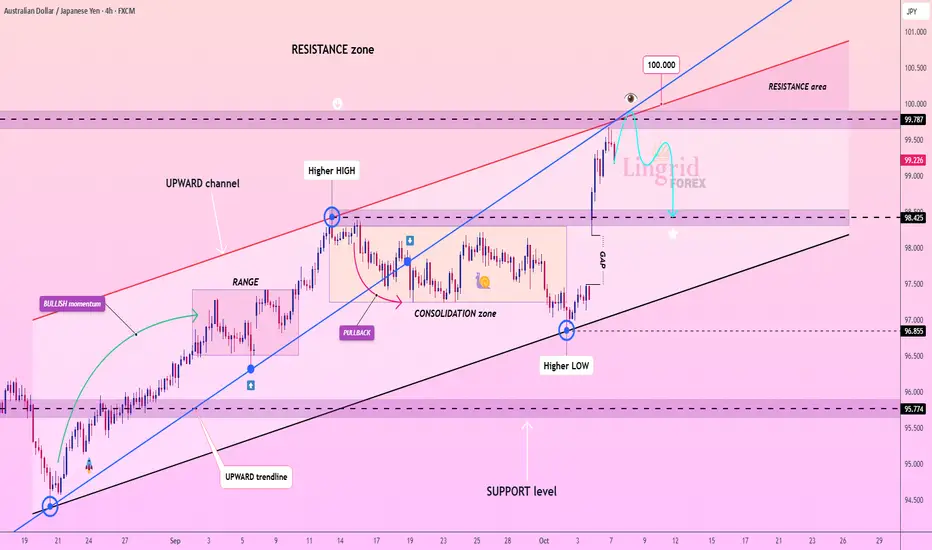
Lingrid | AUDJPY Overbought Correction: Short at Key ResistanceThe price perfectly fulfilled my previous idea . FX:AUDJPY is testing the 99.80 resistance area after a sharp rebound from the 97.50 consolidation zone. Price action shows a clear higher-low formation within the upward channel, with projection signaling a possible correction phase. If price fails to sustain above 97.80, a retracement toward 98.425 remains probable. The market may filled the big gap below. Broader structure suggests a maturing bullish leg that could face resistance near the 100.000 psychological level.
⚠️ Risks:
A breakout above 100.000 could invalidate the short-term correction outlook.
Unexpected Bank of Japan or RBA policy comments may trigger volatility.
Stronger global risk sentiment might support continued yen weakness.
If this idea resonates with you or you have your own opinion, traders, hit the comments. I’m excited to read your thoughts!
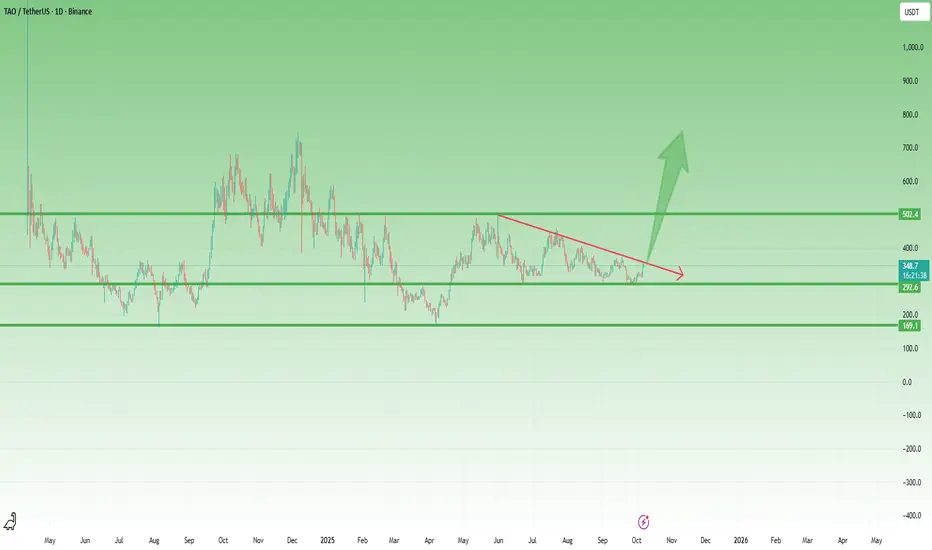
TAO – Constructive Recovery and Key Levels AheadTAO made a significant low in April, just like most crypto assets. Interestingly, this low is perfectly aligned with the one from August 2024, suggesting a strong structural base in the market. From that point, price started to rise in a very constructive and orderly manner, confirming a shift in sentiment.
After the initial rally, TAO touched the 500 zone, a key psychological and technical level. As expected, the market corrected from there, dropping just below 300. What’s notable is that the recent low sits precisely around this 300 area, now acting as a strong support level.
At the time of writing, the price is around 350, currently testing the falling trendline from previous highs. If we see a confirmed breakout above this line, I expect acceleration to the upside, with an initial and conservative target around 500.
However, if momentum continues to build, the next significant resistance lies near the 700+ area, which could translate into a 100% gain from current levels — a solid move if the trend structure holds.
Lingrid | LINKUSDT Market Structure Break Long OpportunityBINANCE:LINKUSDT is stabilizing above the 22.00 upward trendline after forming a bottom near 20.00 support. Price action shows a clear recovery structure following a range consolidation, with the projection suggesting a move toward 25.50. As long as 22.00 holds, bullish continuation remains likely within the upward trend. Momentum context implies accumulation before a potential breakout into the resistance zone around 27.50.
⚠️ Risks:
A close below 22.00 may trigger another test of the 19.80 support.
Weakness in broader altcoin sentiment could limit upside.
Sudden Bitcoin volatility might distort the setup’s bullish structure.
If this idea resonates with you or you have your own opinion, traders, hit the comments. I’m excited to read your thoughts!

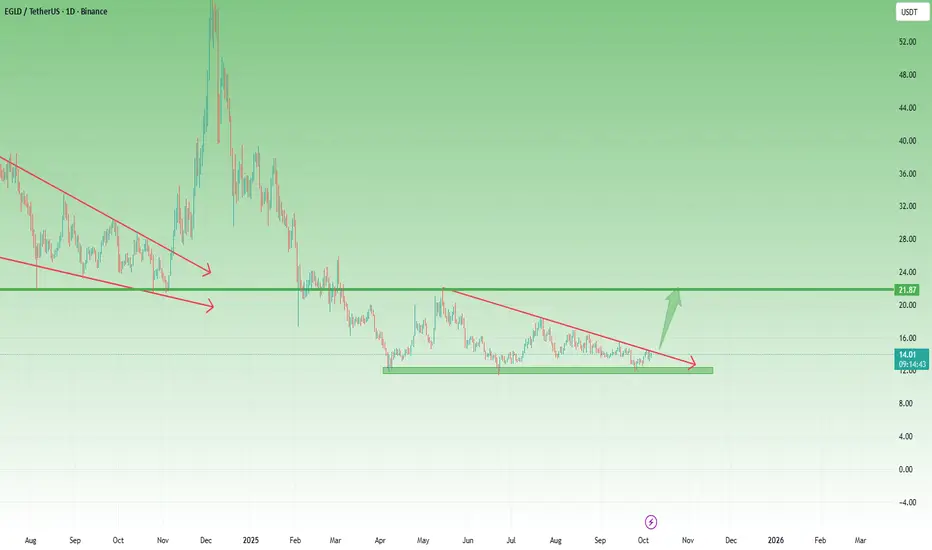
EGLD – Third Touch at $12 Support Could Ignite a Major ReversalEGLD has been on my radar for quite some time...
After forming a major low in April and rallying back toward the $22 zone, the coin pulled back again — effectively confirming that level as strong support.
By the end of September, price revisited the $12 area for the third time, and once again buyers stepped in decisively, triggering a solid rebound. Now, EGLD trades around $14, sitting just below a falling trendline that has capped upside momentum for months.
________________________________________
Technical Outlook
• Support: $12 (triple-tested, major demand zone)
• Resistance: Falling trendline around $14–15
• Soft target: $22 (key resistance and prior reversal area)
________________________________________
My Trading View
Given the strength of this repeated support and the contracting structure, I believe this trendline resistance is likely to break soon. If momentum follows through, EGLD could accelerate sharply to the upside, mirroring past explosive moves.
The setup remains constructive — buying dips above $12 could offer a strong risk–reward opportunity heading into the next leg higher.
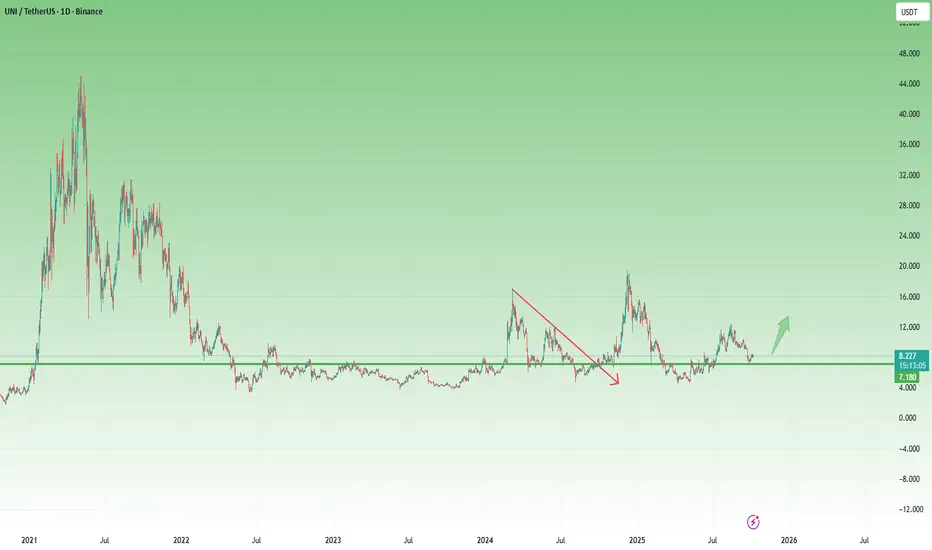
Uniswap Holding above $7 — Bullish Setup AheadAfter the massive 90% drop from its 2021 peak, Uniswap has been consolidating within a wide range. Each attempt to break higher has so far been followed by a return toward the lower end of the structure — a clear sign of prolonged accumulation.
What’s particularly interesting is how the $7 zone has consistently acted as a median level. Every time price dipped below it, UNI found demand and reversed back up. Recently, a solid support base has been confirmed around $5, further strengthening the bullish technical structure.
With the majority of altcoins now positioned for potential upward continuation, Uniswap could also be preparing for a significant leg higher, with a medium-term target around $14 per coin.
However, negation of this bullish setup would come with a clear breakdown below the $7 zone, which could open the way for a retest of the $5 support once again.
From a trading perspective, this setup offers an attractive 1:5 risk-to-reward ratio, making it an opportunity worth keeping on the radar — provided the $7 level holds.
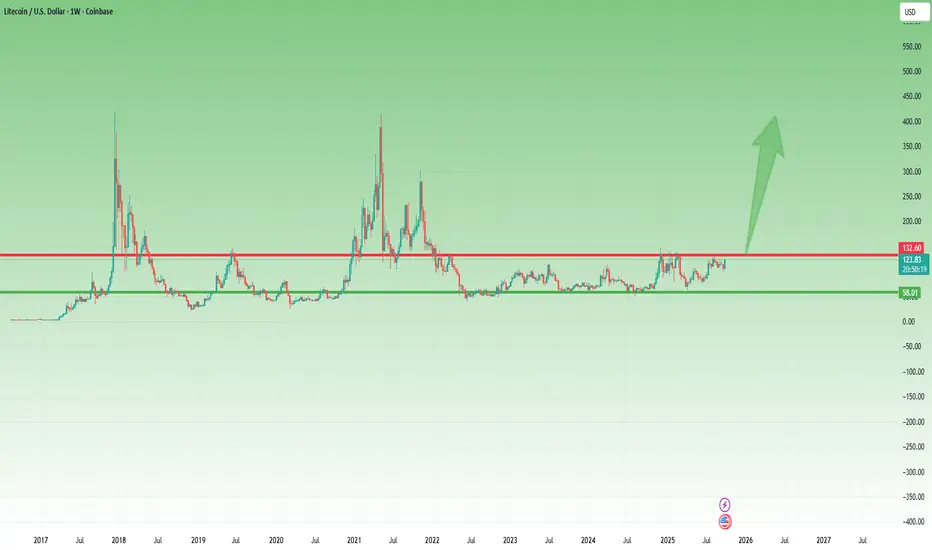
Litecoin Ready to Explode After 3 Years of SleepIn recent years, with the flood of new crypto projects, Litecoin has quietly faded into the background.
Since the local low in May 2022, the price action has been rather lethargic, contained within a well-defined range between 60 and 130 USD.
However, since April 2025, something interesting has been happening — Litecoin seems to be waking up, quietly and almost secretly, as if not to attract too much attention.
From that point onward, LTC/USD has been steadily printing higher lows, and if we zoom out to the longer-term chart, the structure looks remarkably clean — almost textbook — for a potential breakout setup.
Even recently, after another touch of the resistance zone, the correction that followed took the form of a bullish flag, and last week’s strong engulfing candle practically erased an entire month of pullback, now pressing once again against the key resistance level.
In my opinion, it’s time for this cryptocurrency to wake up.
A clear break above 130 would be a strong technical confirmation of that view.
While Litecoin might not deliver the “10x hype” potential that newer tokens promise, it has consistently proven to be one of the most stable and resilient assets in the crypto space.
After three years of accumulation, a breakout could easily trigger an explosive move to the upside.
📈 I’m personally buying Litecoin, with a target around 300 USD in the medium term.
Sometimes, the coins everyone forgets about are the ones that surprise the most. 🚀
Lingrid | ADAUSDT Next Rally Phase Bull ContinuationBINANCE:ADAUSDT is stabilizing above the 0.8135 upward trendline after a pullback from resistance. Price action shows a sequence of lower highs capped by the red trendline, while the blue arrow projection signals potential breakout toward 0.9385. As long as 0.8135 holds, bullish continuation toward 0.9385 remains favored. Momentum structure suggests buyers are preparing to challenge the resistance zone near 1.0212.
⚠️ Risks:
A breakdown below 0.8135 could shift bias back to the 0.7412 support.
Broader crypto market weakness may cap upside momentum.
Unexpected macroeconomic or regulatory news could trigger volatility against the setup
If this idea resonates with you or you have your own opinion, traders, hit the comments. I’m excited to read your thoughts!

ICP: False Break, Bullish Reversal in PlaySince the low from early April, ICP has traded within a well-defined range between $4.5 and $6.0.
Recently, the price broke below the range support, reaching as low as $4.0, but this move lacked follow-through. Instead, ICP quickly rebounded — a classic false break signal.
This rebound also resulted in a break above the descending trendline that started in mid-August, giving the chart a decisively bullish tone.
At this stage, all signals point toward further upside continuation, with the upper boundary near $6.0 as the first natural target.
However, considering that false breaks in one direction often lead to real breaks in the opposite, there’s a strong possibility that ICP could break above $6.0 in the medium term, potentially accelerating toward the key $10.0 zone.
________________________________________
✅ Key Takeaways:
• Range: $4.5 – $6.0
• False break below $4.0 reversed quickly
• Trendline from August broken to the upside
• Bullish outlook → targets $6.0 and possibly $10.0

Lingrid | GOLD NFP Positioning Trend Extension SetupOANDA:XAUUSD is holding its structure inside the upward channel, recently rebounding from the trendline support near 3845. Price action is developing higher lows with bullish momentum, while the breakout of equal highs signals strength toward 3923. Holding above 3844 keeps the bias intact for continuation toward the resistance zone. Further upside momentum could push price into the 3940–3960 target area within the channel.
⚠️ Risks:
A drop back under 3845 may trigger a deeper correction.
Strong NFP data could pressure gold.
Geopolitical risk fading could reduce safe-haven demand.
If this idea resonates with you or you have your own opinion, traders, hit the comments. I’m excited to read your thoughts!

Lingrid | CADJPY Oversold Bounce Long OpportunityFX:CADJPY has bounced off the 105.25 bottom after the recent selloff and is now reclaiming ground inside the channel. Price action is forming a recovery structure with the upward projection aiming toward 106.50–107.00 as the next resistance zone. Holding above the 105.60–105.80 area is key for the bullish outlook to remain valid. If momentum continues, a broader reversal toward 107.90 resistance could unfold.
⚠️ Risks:
Failure to hold above 105.60–105.80 would weaken bullish momentum.
Strong JPY demand from risk-off sentiment or BoJ intervention could cap upside.
Weak CAD fundamentals such as lower oil prices could trigger renewed selling.
If this idea resonates with you or you have your own opinion, traders, hit the comments. I’m excited to read your thoughts!

Lingrid | TONUSDT Pullback Sell Downtrend ContinuationOKX:TONUSDT remains trapped in a well-defined downward channel, making lower highs and sustaining bearish pressure. After a sharp drop from the consolidation zone, price rebounded but is now facing resistance at 2.85, where sellers are likely to re-enter. As long as the market trades below the 3.00 psychological barrier and downward trendline, the bias remains bearish. A move toward 2.62 support and possibly the buying area below 2.55 is favored if rejection holds.
⚠️ Risks:
Break above 3.00 would shift momentum and threaten bearish continuation.
Failure to hold 2.62 could accelerate losses toward 2.40.
Macro shifts in BTC/ETH may cause sudden reversals in CRYPTOCAP:TON trend.
If this idea resonates with you or you have your own opinion, traders, hit the comments. I’m excited to read your thoughts!

Hellena | Oil (4H): SHORT to support area of 60 (Wave 3).The price is still not reaching the target of 60. I decided to make a new forecast, slightly changing the labeling of waves, or rather their importance.
At this stage, as before, I think that the price will reach the area of the level 60 in the middle wave “3”.
This movement is the development of the big corrective wave “C”. In general, the plan remains the same.
Manage your capital correctly and competently! Only enter trades based on reliable patterns!

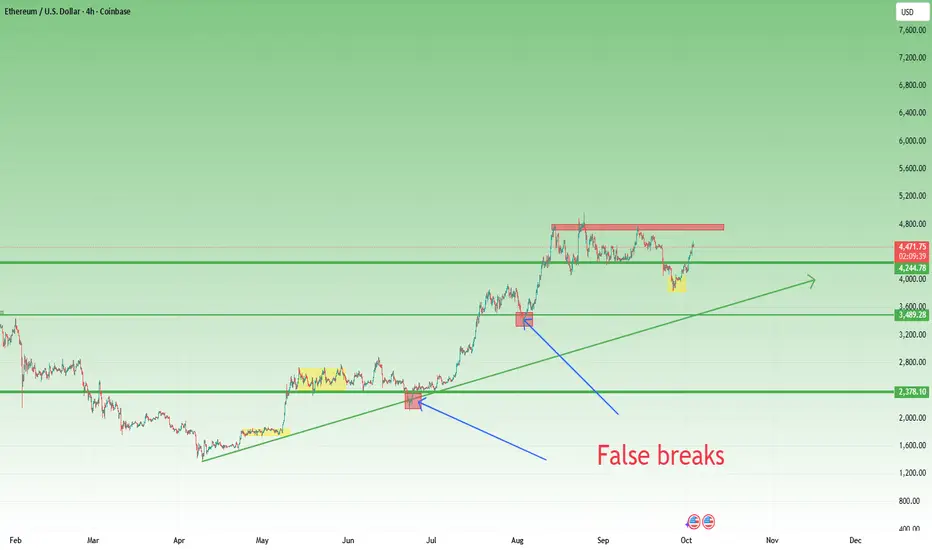
Ethereum: Bulls in Control, But Time for a BreatherIn my previous ETH analysis, I pointed out the high probability of a false breakdown under the 4100 technical support and the 4000 psychological level.
The reasoning was simple: during the strong bull leg from 1350 to 4900 (since April), ETH had already shown this type of price action twice.
That call proved correct. ETH reversed higher, hit my 4400 target, and even pushed further, printing highs close to 4600.
Now, after a nearly 15% rise since last Friday, the market may be due for a pause — a chance to consolidate or correct part of the gains.
________________________________________
Technical View
• Support: 4300 is the key level. As long as this holds, bulls remain in control.
• Resistance: Immediate pressure sits near 4600, the recent top.
• Structure: The trend remains strong and healthy, but after such a rapid move, short-term cooling is normal.
________________________________________
Trading Plan
The strategy remains simple: buy dips against 4300.
As long as that support is intact, ETH’s bull case stays firmly alive. 🚀
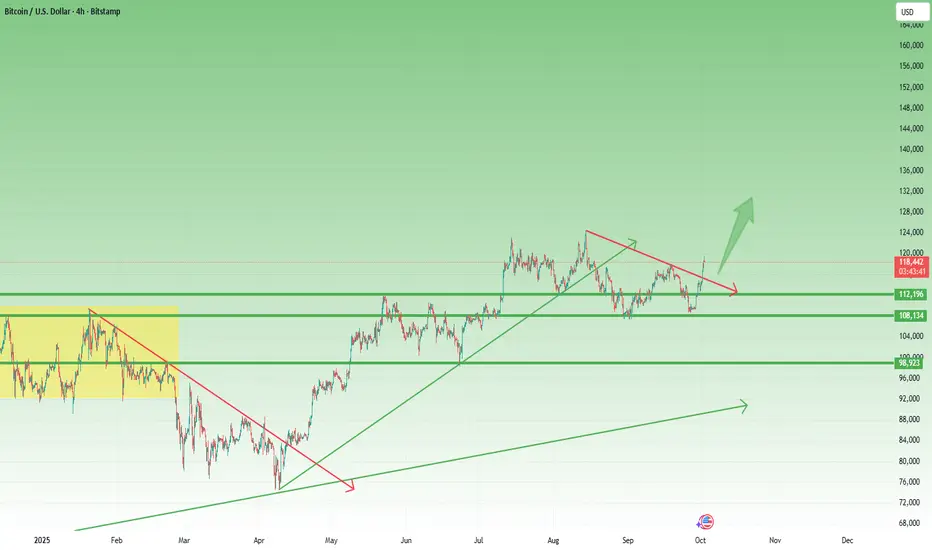
Bitcoin: Third Time’s a Charm at 120k?Two days ago, in my last BTC analysis, I mentioned that bulls had to defend 112k at all costs. Losing it would have opened the gates toward 100k.
Fortunately for the bullish camp, the defense worked. Bitcoin didn’t just hold the line—it pushed higher and broke through the 115k resistance, which had been reinforced by a falling trendline.
Now, with price trading around 118,600, the market is once again staring at the critical 120k barrier.
________________________________________
Why 120k Is So Important
• BTC has already tested this level twice this year, only to be rejected both times.
• Each failure sparked corrections, making 120k not just a number but a milestone for sentiment and structure.
• If bulls can finally conquer and hold above it, the door to new all-time highs swings open.
________________________________________
Technical Structure
• 108k: A solid support.
• 112k: The battleground of the past few months—resistance, support, resistance, etc is now reconquered.
• Trendline Break: The falling trendline gave way, giving bulls the momentum they needed.
The chart is building constructively, with strong supports.
________________________________________
Third Time’s a Charm?
Markets don’t often give three chances at the same key level. The third test usually decides the story.
My stance: buy dips. As long as 112k remains intact, I expect BTC to break 120k and head toward a new ATH.
So, will 120k finally fall on the third attempt? My conviction is stronger than before. 🚀