Lingrid | SHIBUSDT Possible Monthly Support RetestBINANCE:SHIBUSDT rejected resistance at 0.00001361 and extended its bearish momentum back into the 0.00001230 support zone. Price action is forming a corrective structure inside the channel after a failed breakout attempt. If the 0.00001230 level gives way, downside targets align with the 0.00001100 where there is buying area below. The broader momentum shows sellers in control as long as resistance caps rallies.
⚠️ Risks:
A sudden bounce above 0.00001231 could trigger a squeeze toward 0.00001360.
Broader crypto market recovery could reduce bearish pressure.
Increased whale accumulation near 0.00001100 may limit downside extension.
If this idea resonates with you or you have your own opinion, traders, hit the comments. I’m excited to read your thoughts!
Signalservice

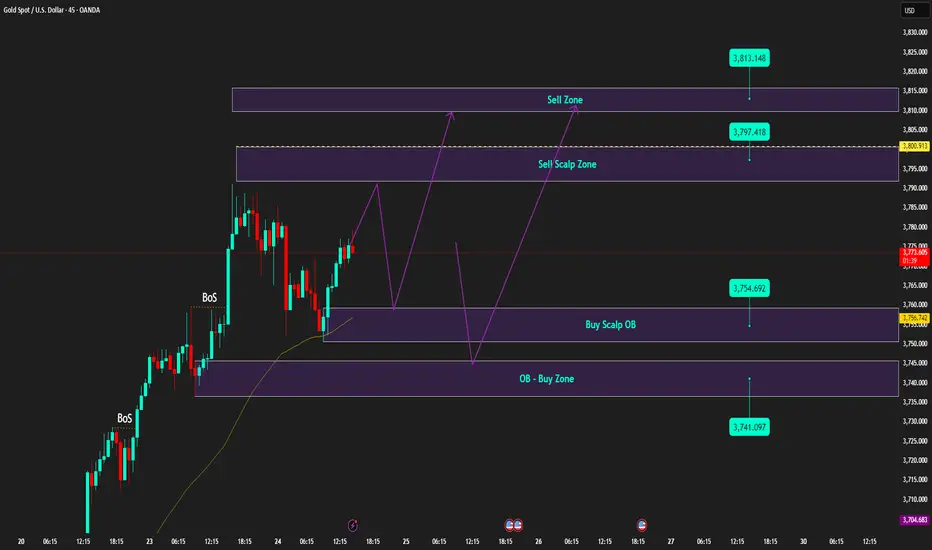
Gold shakes violently | Priority Buy on dip to support🟡 XAU/USD – 24/09 | Captain Vincent ⚓
🔎 Captain’s Log – Context & News
Geopolitics : Trump unexpectedly supported Ukraine reclaiming full territory and called on NATO to be tougher on Russia → defensive sentiment returned, supporting Gold.
US Economy : Housing data due today, no FED speeches.
Earlier: Weak US PMI + dovish FED tone → no momentum for a prolonged downtrend.
Price Action : Gold dropped more than 20 points overnight, then quickly rebounded to 3,76x → likely profit-taking pressure at higher levels.
⏩ Captain’s Summary : Main trend stays bullish, but the voyage will remain choppy as Gold absorbs profit-taking near resistance.
📈 Captain’s Chart – Technical Analysis (M45)
Golden Harbor (Support / Buy Zone)
Buy Scalp OB: 3,754 – 3,757
OB Harbor: 3,741 – 3,744
Storm Breaker (Resistance / Sell Zone)
Sell Scalp Zone: 3,797 – 3,800
Higher Sell Zone: 3,813 – 3,815
Market Structure
After the deep drop, Gold rebounded and held above 3,76x.
Bullish trend remains intact, but waves of volatility may occur near higher resistance zones.
🎯 Captain’s Map – Trade Plan
✅ Buy (priority)
Buy Scalp OB
Entry: 3,754 – 3,757
SL: 3,747
TP: 3,762 – 3,767 – 3,772 – 3,777 – 3,782
Buy Zone OB
Entry: 3,741 – 3,744
SL: 3,732
TP: 3,749 – 3,754 – 3,759 – 3,764 – 3,769
⚡ Sell (short scalp – lower RR)
Sell Scalp Zone
Entry: 3,797 – 3,800
SL: 3,806
TP: 3,795 – 3,790 – 3,785 – 3,780 – 3,775
Higher Sell Zone
Entry: 3,813 – 3,815
SL: 3,823
TP: 3,810 – 3,805 – 3,800 – 3,795 – 3,790
⚓ Captain’s Note
“The Golden ship rocked violently overnight but still anchored firmly at Golden Harbor 🏝️ (3,754 – 3,741) . Profit-taking waves may still rise at Storm Breaker 🌊 (3,797 – 3,815) , suitable for short Quick Boarding 🚤 scalps. Yet the main voyage continues north – Buy the Dip remains the compass to follow the strong winds.”
📢 If you find the Captain’s Log useful, don’t forget to Follow for the latest signals.
💬 Got your own view on Gold? Share it in the comments and join the crew discussion!
BABA Alibaba Group Holding Limited Options Ahead of EarningsIf you haven`t bought the dip on BABA:
Now analyzing the options chain and the chart patterns of BABA Alibaba Group Holding Limited prior to the earnings report this week,
I would consider purchasing the 135usd strike price Calls with
an expiration date of 2025-9-19,
for a premium of approximately $14.25.
If these options prove to be profitable prior to the earnings release, I would sell at least half of them.

Lingrid | GOLD Rally Targeting $3800 Resistance Level ?The price perfectly fulfilled my previous idea . OANDA:XAUUSD is pressing higher after breaking out of its consolidation channel and reclaiming the 3750 level. The market structure is supported by an upward trendline with successive higher highs confirming bullish momentum. As long as price holds above 3728, a push toward the 3800 resistance zone remains likely. The broader trend continues to favor buyers with gold eyeing new all-time highs.
⚠️ Risks:
A drop back below 3728 would weaken the breakout and open the way for a retest of 3700 support.
Stronger USD from Fed Chair Powell comments could cap upside momentum.
Profit-taking near the 3800 psychological level may trigger short-term volatility.
If this idea resonates with you or you have your own opinion, traders, hit the comments. I’m excited to read your thoughts!

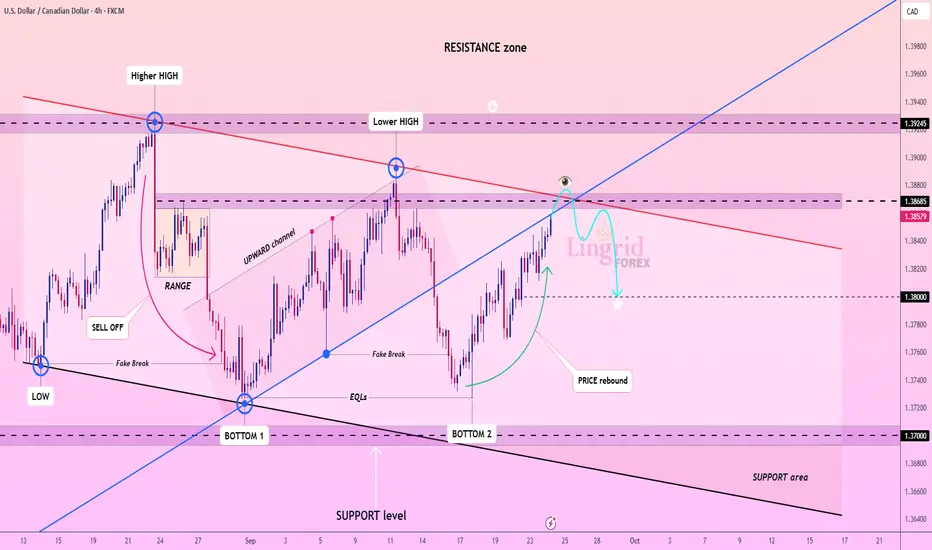
Lingrid | USDCAD Short at Resistance Following Rejection SignalThe price perfectly fulfilled my previous idea . FX:USDCAD rebounded strongly from the double bottom around 1.3700 and is now climbing within an upward channel. The structure shows lower highs capped by the red resistance trendline, while buyers attempt to sustain momentum toward 1.3868–1.3924 resistance. If price fails to break and hold above 1.3868, a rejection could send it back toward 1.3800 support. Broader context suggests a corrective upswing inside a larger resistance zone where sellers remain active.
⚠️ Risks:
A clean breakout above 1.3924 would invalidate the sell bias and extend the bullish leg.
Strong USD momentum from macroeconomic data could fuel further upside.
Failure of the 1.3800 support could trigger deeper volatility spikes.
If this idea resonates with you or you have your own opinion, traders, hit the comments. I’m excited to read your thoughts!
Lingrid | AVAXUSDT Trend Resumption Pattern Building ?The price perfectly fulfilled my previous idea . BINANCE:AVAXUSDT rebounded from the upward trendline after rejecting support near 33.20, reclaiming bullish structure. Price action shows an earlier impulse leg followed by a corrective move and a fake break before price regained momentum. As long as price sustains above 33.00, buyers may push toward the 37.00 resistance zone and higher. Overall, momentum favors continuation higher with the upward trendline acting as dynamic support.
⚠️ Risks:
Failure to hold above 33.00 could trigger a deeper retracement toward 30.50 support.
Broader market weakness or risk-off sentiment could weigh on bullish follow-through.
A strong rejection near 37.00 may signal exhaustion and invite profit-taking.
If this idea resonates with you or you have your own opinion, traders, hit the comments. I’m excited to read your thoughts!

Gold | 30min Double Top | GTradingMethodHello Traders,
I’ve entered a short position on gold based on a potential double top formation on the 30-minute chart.
🔎 Market Overview:
This pattern often signals weakening bullish momentum and potential reversal pressure. While gold has been strong recently, the short-term setup suggests an opportunity for a tactical short if the pattern confirms.
📊 Trade Plan:
Risk/Reward: 3.6
Entry: 3,757.0
Stop Loss: 3,766.6
Take Profit 1 (50%): 3,729
Take Profit 2 (50%): 3,713
🙏 Thanks for checking out my post!
Make sure to follow me to catch the next idea and please share your thoughts — I’d love to hear them.
📌 Please note:
This is not financial advice. This content is to track my trading journey and for educational purposes only.

Lingrid | AUDJPY Momentum Slowdown Bull SignalFX:AUDJPY is consolidating inside a downward channel after repeated rejections at the 98.3 resistance zone. The chart shows a compression channel within the broader bearish trendline, with liquidity resting below the 97.1 area. A rebound from the current liquidity pocket could fuel a short-term move toward 97.7 before facing resistance again. Broader structure remains bullish unless price can sustain below the downward trendline.
⚠️ Risks:
A clean break below 97.1 may drag price toward the deeper 96.7 support area.
Stronger JPY from risk-off flows could accelerate downside pressure.
Unexpected shifts in Australian economic data could disrupt the technical setup.
If this idea resonates with you or you have your own opinion, traders, hit the comments. I’m excited to read your thoughts!

Lingrid | SOLUSDT Pullback Opens Long OpportunityThe price perfectly fulfilled my previous idea . BINANCE:SOLUSDT is retracing from the 250 resistance zone after forming a double top structure. 4H chart highlights an upward channel intersecting with a downward trendline, creating a key confluence around 200–210. If price rebounds from this zone, buyers could retest 230 and potentially extend higher. The broader bullish structure remains intact as long as the 200 support holds, keeping upside momentum in play.
⚠️ Risks:
A breakdown below 200 may shift bias back to the 165 support area.
Broader crypto market weakness could suppress bullish continuation.
Macro headwinds like stronger USD or risk-off sentiment could pressure $SOL.
If this idea resonates with you or you have your own opinion, traders, hit the comments. I’m excited to read your thoughts!

Bitcoin Long Trade Signal, Buying with the Whales at 110KI noticed large buy orders from market whales and strong buying momentum accumulating around the 110,000 level.
The current drop supports demand accumulation at the same area.
I will enter a long position from 110,000 with quick targets.
Here’s my personal trade plan:
✅ Entry 1: Buy from 110K
✅ Entry 2: If price dips, add another buy at 107K
🎯 Target 1: 111,100
🎯 Target 2: 112,000
Stop-loss: For both entries, a daily close below 107K
Please note:
This is not financial advice – I’m only sharing my personal trades.
Always do your own research before taking action.
👍 Don’t forget to like if you found this useful, and feel free to follow me for more analysis of this kind.
Best of luck 🌹

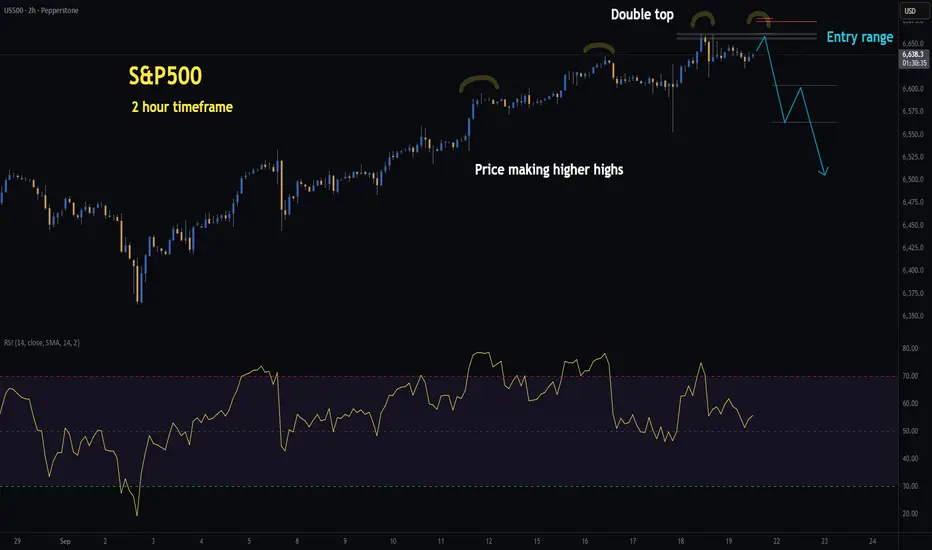
US500 | H2 Double Top | GTradingMethodHello Traders, I hope you’ve all had a profitable week!
🧐 Market overview:
The US500 has pushed into new highs since the FOMC and remains in an uptrend. However, price is advancing on weakening momentum — higher highs in price while RSI prints lower highs, a classic case of negative divergence. My system is flagging this as a potential double top setup on the 2H timeframe, but I am still waiting for confirmation before entering a short.
Interestingly, while my system highlights bearish risk, there are also bullish signals worth noting:
- Daily CMF money flow shows no negative divergence.
- Daily MACD remains on a buy signal.
- The recent rate cut adds further liquidity and stimulus to markets.
📊 My trade plan:
Risk/Reward: 3.6 – 4.5
Entry: 6,655.6 – 6,661.8
Stop Loss: 6,674.8 – 6,678.6
Take Profit 1 (50%): 6,604
Take Profit 2 (50%): 6,563
The entry and stop ranges vary depending on where the setup confirms within the zone.
Tip:
Divergences often act as early warning signs of trend exhaustion, but they work best when combined with pattern confirmation (like a double top) rather than traded in isolation.
🙏 Thanks for checking out my post!
Make sure to follow me to catch the next idea and keen to hear if you are trading the US500? :)
Please note: This is not financial advice. This content is to track my trading journey and for educational purposes only.
Lingrid | EURUSD Channel Breakout Setup BuildingThe price perfectly fulfilled my previous idea . BINANCE:BTCUSDT slipped after a rejection near 1.19 and is now leaning on former support turned resistance around 1.1777. The structure shows a break of the local upward trendline and a drift toward the mid-range, with an A-B-C style pullback developing inside the broader channel. If sellers keep price capped beneath 1.1777, bears can press for 1.1678, with a deeper extension only if that shelf gives way. Momentum has rotated lower, and unless the pattern reclaims the trendline, the path of least resistance stays down.
⚠️ Risks:
A quick reclaim of the broken trendline and sustained close above 1.1777 would invalidate the bearish setup.
Eurozone data upside surprises or a softer U.S. dollar post-data could spark a squeeze higher.
Unexpected dovish signals from the Fed may flip flows back into EUR and break the range to the upside.
If this idea resonates with you or you have your own opinion, traders, hit the comments. I’m excited to read your thoughts!

Gold | H8 Double Top | GTradingMethodHello Traders, good morning!
Gold has been pushing into new highs, but I’ve taken a small short position this morning. The reason? A potential double top is forming on the 8-hour timeframe.
Negative RSI divergence is present — price is making higher highs, while RSI is printing lower highs. This signals weakening buying momentum.
Volume on the second top is lower than the first, which adds further confluence for a possible reversal.
I am aware that this is most likely a controversial position as most people will be long gold.
However, the risk reward favors shorts at these levels and I willing to take a small position against the trend. Only time will tell.
📊 Trade Plan:
Risk/Reward: 3.6
Entry: 3,698.5
Stop Loss: 3,732.5
Take Profit 1 (50%): 3,597
Take Profit 2 (50%): 3,549.8
GTradingMethod Tip:
When trading reversal patterns, I always look for multiple layers of confluence — structure (like a double top), momentum (RSI divergence), and volume. This helps filter out weak setups.
🙏 Thanks for checking out my post!
Where do you think gold is headed today?
Please note:
This is not financial advice. This content is to track my trading journey and for educational purposes only.

Lingrid | GOLD Weekly Analysis: Sideways Shuffle Before Next RunOANDA:XAUUSD attempted an upward break this week but encountered resistance near the $3,700 level, retreating as the market enters a consolidation phase. 4H chart reveals gold trading within an ascending channel, testing the upper resistance zone around $3,700 after a significant rally from the August bottom.
Price action suggests a healthy pullback within the broader uptrend. The upward trendline remains intact, providing dynamic support around $3,630, while the PWL (Previous Week Low) acts as immediate support. This sideways action appears to be profit-taking rather than a trend reversal, as gold consolidates recent gains before potentially targeting the ATH zone again.
Key factors supporting long-term bullish sentiment include persistent geopolitical tensions, central bank gold accumulation, and currency debasement concerns. The ascending channel structure suggests any weakness toward the PWL support zone could present attractive entry opportunities for patient buyers.
An expansion - contraction market phase aligns with typical consolidation patterns following sharp advances. Gold's ability to hold above the trendline will be crucial. A break below would signal deeper correction toward the channel midpoint, while a decisive move above current resistance opens the path to new highs towards $3,800. The overall structure remains constructive for gold's longer-term trajectory despite near-term choppiness.
If this idea resonates with you or you have your own opinion, traders, hit the comments. I’m excited to read your thoughts!

Lingrid | BTCUSDT Pullback Provides Buying OpportunityBINANCE:BTCUSDT has broken down from its range after rejecting the 117k resistance and forming a clear lower high. The sharp selloff has brought price back toward the 111k support zone, which aligns with the Fibonacci golden pocket. Holding above this area could trigger a short-term rebound, but the structure remains fragile. If 111k fails, the next key support sits at 108k, pointing to deeper downside risk.
⚠️ Risks:
A breakdown under 110k confirms bearish continuation toward 108k.
Market sentiment around Fed policy could accelerate volatility.
Only a sustained break back above 116k would negate the bearish setup.
If this idea resonates with you or you have your own opinion, traders, hit the comments. I’m excited to read your thoughts!

Lingrid | HYPEUSDT Pullback Pattern Long OpportunityThe price perfectly fulfilled my previous idea . KUCOIN:HYPEUSDT is holding above 55 after rebounding from the 53.5 support zone and respecting the upward trendline. The chart shows strong bullish momentum, with buyers eyeing the 60 resistance level, which also aligns with the upper boundary of the resistance zone. A breakout above 60 would open the path toward the 64–66 target area inside the broader channel. As long as 53.5 holds as support, the bias remains to the upside.
⚠️ Risks:
A breakdown below 53.5 could trigger a correction toward 47.8.
Crypto market volatility driven by Bitcoin dominance shifts may impact momentum.
Failure to sustain volume near 60 could cause rejection and consolidation back inside the channel.
If this idea resonates with you or you have your own opinion, traders, hit the comments. I’m excited to read your thoughts!

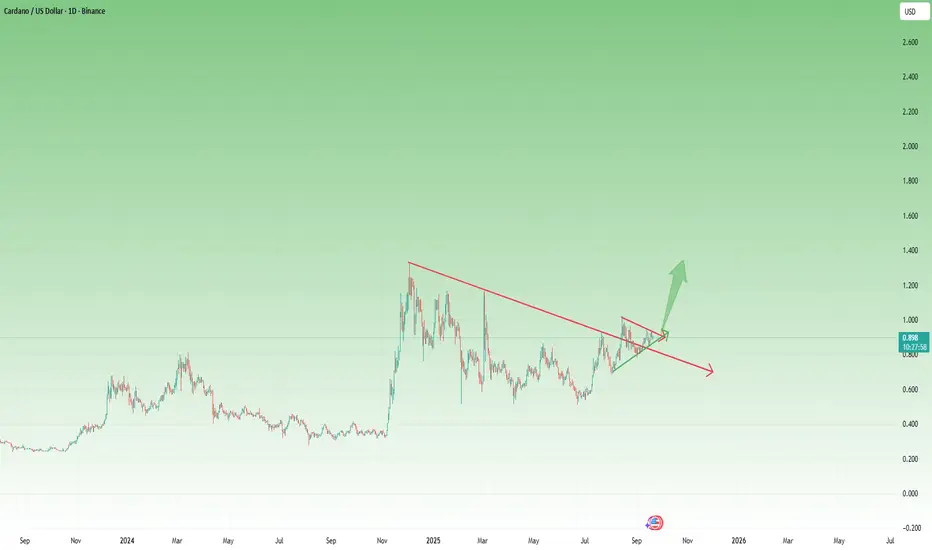
ADAUSD – Symmetrical Triangle Points to Upside BreakoutAs highlighted in my previous ADA analysis, I’ve maintained a bullish bias, recommending buys below 0.80 USD. Since then, price has indeed revisited the 0.80 support zone and rebounded strongly.
More importantly, since mid-August, ADA has been consolidating within a symmetrical triangle. Technically, this is a continuation pattern, and given that the broader trend from 0.50 (mid-June) has been constructive to the upside, probabilities favor an eventual bullish breakout.
Key Levels & Plan:
✅ Bullish bias remains intact above 0.80 USD
⚡ Breakout confirmation above 0.95 USD (recent resistance)
🎯 Upside target: 1.30 USD – a reasonable and achievable objective if momentum extends
Conclusion: Until proven otherwise, ADA’s structure suggests an upside continuation once resistance gives way. A breakout above 0.95 would serve as the clear green light for further gains. 🚀
Ethereum Elliott Wave Buy Setup: Targets 4550 and 4600Ethereum Daily Update (Elliott Wave Setup)
Based on my daily monitoring of Ethereum and according to the Elliott Wave count (which I’ll share shortly with the full analysis), I see a long opportunity forming.
Here’s my personal trade plan:
✅ Entry 1: Buy from current price 4450 / 4445
✅ Entry 2: If price dips, add another buy at 4400
🎯 Target 1: 4550
🎯 Target 2: 4600
Stop-loss: For both entries, a daily close below 4350
Please note:
This is not financial advice – I’m only sharing my personal trades.
Always do your own research before taking action.
👍 Don’t forget to like if you found this useful, and feel free to follow me for more analysis of this kind.
Best of luck 🌹

ICPUSD – Trading the Range with PrecisionSince December last year, ICP has been in a persistent downtrend, sliding from 15 USD to below 5 USD. Sellers have clearly dominated the longer-term picture.
However, after establishing April’s low, the market transitioned into a well-defined sideways range between 4.5 and 6.2 USD. This type of consolidation after a heavy decline often signals a pause – and can present trading opportunities within the boundaries.
Right now, ICPUSD is once again testing the bottom of this range near 4.5. From a tactical perspective, this creates a favorable setup: by entering long positions at the range low, we can aim for the upper boundary with a 1:3.5 risk-to-reward ratio.
Trading Plan:
• ✅ Favor long positions near 4.5 USD
• 🛑 Place a tight stop-loss just below range support
• 🎯 First target: 6.0 – 6.2 USD, the upper range resistance
Conclusion: Until ICPUSD breaks decisively below support, the range remains intact. I favor buying dips with disciplined risk management, targeting the 6 USD area for a clean swing trade setup. 🚀

XAGUSD Holds 41.40 Strong – Bulls Ready for 43 AgainAs I’ve often highlighted in my previous Silver outlooks, OANDA:XAGUSD usually offers cleaner technical setups than Gold, with less “noise” and fewer manipulation spikes. This time is no exception.
After touching the 43.00 zone, Silver entered a corrective phase, sliding down to 41.40 – a key confluence support. Price tested this level no less than four times, and each time buyers stepped in, eventually pushing the market higher.
Much like in Gold, this drop from the highs should not be mistaken for a trend reversal. Instead, it’s a healthy correction inside a strong uptrend. Based on the price action, we can now argue that the correction is likely complete.
📊 Trading plan:
• My strategy is to buy dips, ideally around the 41.80 zone.
• First target remains the 43.00 resistance area.
• Invalidation (negation) comes only with a daily close below 41.50.
In short, Silver has shown resilience at support, and unless 41.50 breaks, I stay with the bulls. 🚀

Lingrid | DOGEUSDT Bull Run Retracement PlayThe price perfectly fulfilled my previous idea . BINANCE:DOGEUSDT has shown strong bullish momentum, breaking through a triangle pattern and extending toward the 0.3080 resistance zone. After topping out, price pulled back into the upward trendline, where buyers are attempting to re-establish control. Holding above 0.2600 keeps the bullish structure valid, with potential for another test of 0.3000 and higher levels. The broader trend remains constructive as long as higher lows are maintained.
⚠️ Risks:
A breakdown below 0.2600 could shift momentum and expose 0.2015 support.
Weakness in overall crypto sentiment may cap DOGE’s upside.
Sudden volatility from BTC dominance shifts could pressure DOGE short term.
If this idea resonates with you or you have your own opinion, traders, hit the comments. I’m excited to read your thoughts!

Lingrid | USDCAD Sideways Market Long Opportunity FX:USDCAD has been trading within a clear sideways channel after facing strong rejection from the resistance zone near 1.3925. Price has since formed a lower high and dipped into the 1.3764–1.3693 support region, where buyers are attempting to stabilize. A bounce from this demand area could fuel a recovery toward 1.3850, but the broader structure remains corrective unless price clears above the descending trendline.
⚠️ Risks:
A sustained break below 1.3765 would expose 1.3700 and the deeper support area.
Stronger crude oil prices could strengthen the CAD and weigh on USDCAD.
Unexpected hawkish Fed comments may disrupt the short-term rebound scenario.
If this idea resonates with you or you have your own opinion, traders, hit the comments. I’m excited to read your thoughts!

BTC Trade Idea: Short from 117,850 at previous resistance level
Bitcoin is currently at a previous resistance level 117,500 where the price has bounced down before.
Personally, I will enter a short trade from the current price with a tight stop-loss.
✅ My Personal Strategy:
Entry: Sell from current price 117,850
🎯 Target 1: 116,000
🎯 Target 2: 115,500
Stop Lose : Daily close above the resistance level 117,500
Please note:
This is not financial advice – I’m only sharing my personal trades.
Always do your own research before taking action.
👍 Don’t forget to like if you found this useful, and feel free to follow me for more analysis of this kind.
Best of luck 🌹
