XAUUSD – Bulls Fighting BackAs expected and explained in Friday’s analysis, Gold dipped under 3335, and during today's Asian session, opened with a slide to 3323.
However, shortly after, bulls stepped in, and in the following 5 hours the price climbed strongly, reaching the important resistance at 3360, before entering a normal correction.
At this moment, the correction from 3410 could be complete, and a confirmed break above 3360 would bring the first confirmation for a new bullish leg.
Another factor supporting this view is that the resistance of the falling wedge has already been broken to the upside – a constructive technical signal.
📌 Trading Plan:
I will look to buy dips, anticipating a break above 3360, with targets toward the 3400 handle.
⚠️ A new local low would temporarily pause this bullish scenario.🚀
Disclosure: I am part of TradeNation's Influencer program and receive a monthly fee for using their TradingView charts in my analyses and educational articles.
Signalservice

XAUUSD: The decline has stopped, continue to buyAs the talks between Trump and Putin achieved results on Saturday, risk aversion decreased, gold fell rapidly at the opening, and after briefly breaking through 3330, it found support again and rebounded strongly, reaching a high of 3358. Subsequently, the price of gold entered a slow decline, mainly because the market was waiting for the results of the talks between Trump, Zelensky and several European leaders, which was the main factor affecting the subsequent rise and fall of gold prices.
Personally, I think it is unlikely that this meeting will completely resolve the situation between Russia and Ukraine. Since it cannot be resolved, the geopolitical risks still exist, and the market's risk aversion is unlikely to decline, so gold will continue to rise.
Today's focus is on 3340. If support is found, consider buying.
🏆Trade setup:
📈Buy at 3340
✅Target 1 - 3355
✅Target 2 - 3370
🛑Stop Loss - 3330
📣If you have different opinions, please leave a message below to discuss

GBPUSD – DAILY FORECAST Q3 | W34 | D18 | Y25📊 GBPUSD – DAILY FORECAST
Q3 | W34 | D18 | Y25
Daily Forecast 🔍📅
Here’s a short diagnosis of the current chart setup 🧠📈
Higher time frame order blocks have been identified — these are our patient points of interest 🎯🧭.
It’s crucial to wait for a confirmed break of structure 🧱✅ before forming a directional bias.
This keeps us disciplined and aligned with what price action is truly telling us.
📈 Risk Management Protocols
🔑 Core principles:
Max 1% risk per trade
Only execute at pre-identified levels
Use alerts, not emotion
Stick to your RR plan — minimum 1:2
🧠 You’re not paid for how many trades you take, you’re paid for how well you manage risk.
🧠 Weekly FRGNT Insight
"Trade what the market gives, not what your ego wants."
Stay mechanical. Stay focused. Let the probabilities work.
FX:GBPUSD

Lingrid | GOLD Weekly Market Outlook: Pullback Tests Swap ZoneOANDA:XAUUSD has pulled back from recent highs, currently around $3,335 after touching peak levels near $3,450. The pullback appears to be testing key support structures within a broader consolidation phase following the earlier breakout attempt.
4H chart shows a complex technical picture with gold trapped between the resistance zone around $3,450 and critical support near $3,270. The recent price action shows characteristics of an A-B-C corrective pullback within a compression channel, with a potential wedge formation visible in the latest consolidation phase.
Key technical levels include the downward trendline acting as dynamic resistance and the ascending support line providing a floor around current levels. The recent low near $3,270 suggests institutional players may be testing liquidity zones before establishing larger positions. Market participants should monitor the $3,310 swap zone level closely, as a break below could signal deeper retracement toward the $3,280 zone. Conversely, reclaiming the $3,380 resistance would suggest renewed bullish momentum targeting the upper resistance area.
The current consolidation phase represents a healthy pause after the previous advance, with buyers likely to emerge on any significant dip toward major support levels. Volume and momentum indicators will be crucial in determining whether this pullback represents a temporary correction or a more significant trend shift.
If this idea resonates with you or you have your own opinion, traders, hit the comments. I’m excited to read your thoughts!

Lingrid | EURUSD Bullish Potential From Support ZoneFX:EURUSD is consolidating within an upward channel after forming a higher high against resistance. The structure shows an impulse leg followed by a pullback into the trendline, respecting both horizontal and diagonal support zones. As long as the 1.1650 – 1.1660 support area holds, price has room to rebound toward the upper boundary of resistance. Overall, momentum remains bullish with higher lows confirming the broader upward pattern.
📉 Key Levels:
Buy trigger: Rejection of 1.1650.
Buy zone: 1.1650–1.1660 support area near trendline.
Target: 1.17155 resistance.
Invalidation: Break below 1.1600 would negate the bullish setup.
💡 Risks:
A false break above 1.1715 could trap buyers and reverse back into consolidation.
Strong USD macro data could strengthen the dollar and weigh on EURUSD.
Momentum divergence on shorter timeframes may indicate weakening bullish pressure.
If this idea resonates with you or you have your own opinion, traders, hit the comments. I’m excited to read your thoughts!

Lingrid | BTCUSD Consolidation Phase Following Double TopBINANCE:BTCUSDT is consolidating above the swap zone after rejecting resistance around 123,280, following a strong upward impulse. The structure shows two tops forming near the resistance zone, suggesting temporary exhaustion before continuation. As long as price holds above 112,000 (swap and upward trendline support), the bullish setup remains valid. Momentum favors further continuation toward the resistance, aligning with the broader upward channel.
📉 Key Levels:
Buy trigger: Break and hold above 114,000 resistance area.
Buy zone: 112,800 – 112,000 (swap and trendline support).
Target: 123,280.
Invalidation: Break below 112,000 support.
💡 Risks:
Failure to hold above swap support at 112,000 could trigger deeper correction.
Repeated rejection near the resistance zone may shift momentum bearish.
Maco events (Fed policy, liquidity risk) could disrupt bullish continuation.
If this idea resonates with you or you have your own opinion, traders, hit the comments. I’m excited to read your thoughts!

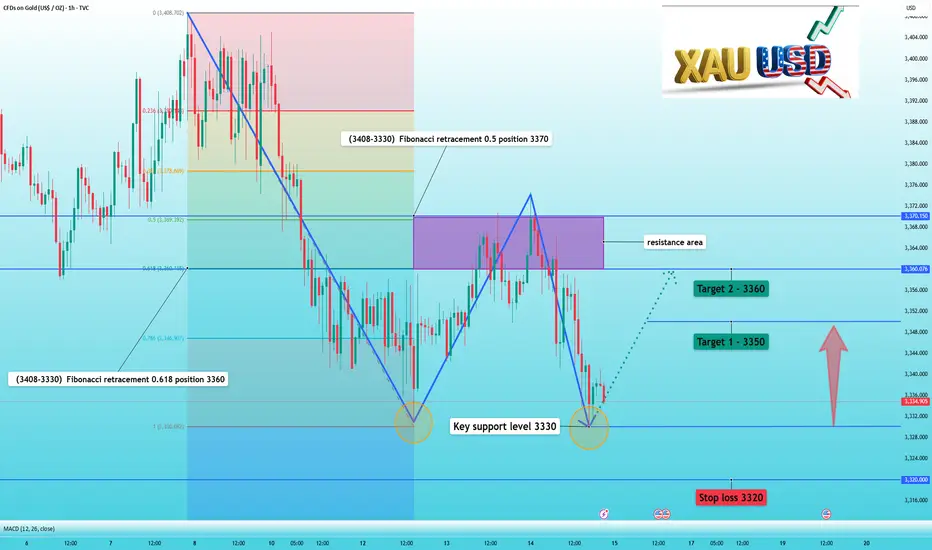
XAUUSD: 3330 becomes the key, buy if it doesn’t fall belowIn the previous article, we successfully predicted that gold prices would fall if they failed to break through 3370. This proved to be the case, with gold prices ultimately falling to our ultimate target of 3330.
From the 1-hour chart, it's clear that 3330 is a key support level. Gold prices rebounded from the decline on the 12th precisely at this level. Now that gold has stabilized after hitting 3330 again, will it rebound again?
I personally believe that a rebound around 3330 will occur, but the strength will not be too strong. It's important to be prepared to cash in on your gains.
🏆Trade setup is as follows:
📈Buy near 3330
✅Target 1 - 3350
✅Target 2 - 3360
🛑Stop loss 3320
📣If you have different opinions, please leave a message below to discuss
Lingrid | USDCAD Potential Resistance Zone RetestFX:USDCAD is pulling back from the higher high near 1.3820 after testing the resistance zone, with price still holding above the upward trendline. A retest of the 1.3784–1.3780 zone could invite buyers back for another push toward the 1.3819 target. Maintaining higher lows along the trendline keeps the bullish bias intact. The structure suggests a possible continuation of the impulse leg toward resistance.
📉 Key Levels
Buy trigger: Rejection of 1.3785
Buy zone: 1.3784 – 1.3780
Target: 1.3819
Invalidation: Close below 1.3765
💡 Risks
Failure to hold 1.3785 trendline support
Weak breakout above 1.3819 leading to rejection
Strength in CAD from macroeconomic news
If this idea resonates with you or you have your own opinion, traders, hit the comments. I’m excited to read your thoughts!

Lingrid | ADAUSDT The price perfectly fulfilled my previous idea . BINANCE:ADAUSDT recently rebounded from the upward trendline after testing the breakout area, showing signs of renewed bullish momentum. The structure reveals a sequence of higher lows and higher highs, supported by a sustained upward channel. As long as the 0.8500 support zone holds, the market could push toward the 1.0150 resistance area. Momentum remains positive, aligning with the prevailing bullish channel structure.
📉 Key Levels:
Buy trigger: Hold above 0.8500.
Buy zone: 0.8500–0.8400.
Target: 1.0150.
Invalidation: Break below 0.8400.
💡 Risks:
Failure to hold the 0.8400 support could shift momentum to the downside.
Broader crypto market weakness may cap upside moves.
Potential profit-taking near the resistance zone could trigger short-term pullbacks.
If this idea resonates with you or you have your own opinion, traders, hit the comments. I’m excited to read your thoughts!

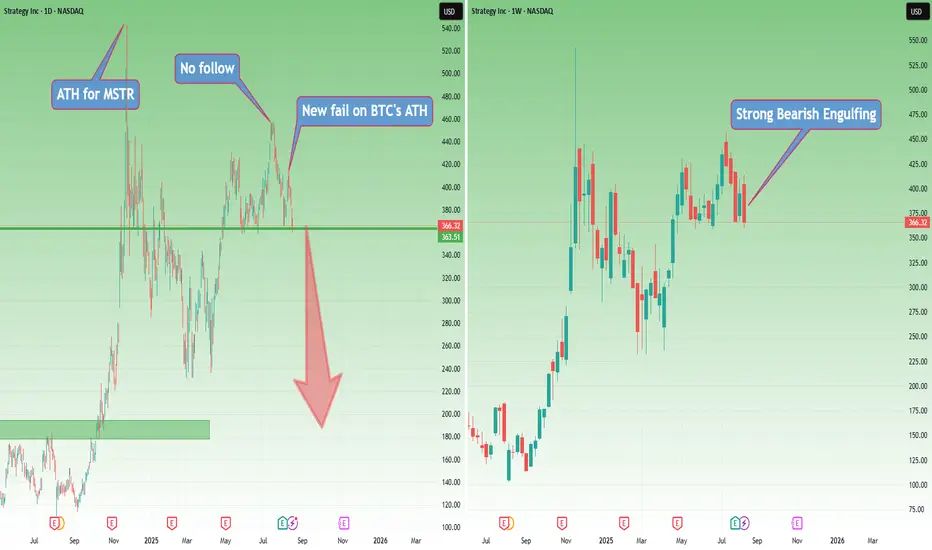
MSTR: A Giant with Feet of ClayExactly two weeks ago, I wrote an article with a rhetorical question: “Why should you buy Strategy if you want exposure to BTC?” and argued that MSTR could fall—and fall hard.
Two days ago, BTC printed a new ATH. That move was visible in MSTR as well; however, we’ve got a lower high and a new fail for the stock.
Even more, this fail has formed the right shoulder of an H&S pattern.
On the weekly chart, there’s a strong bearish engulfing that ended exactly at the neckline of the pattern.
This type of price action is far from bullish, regardless of what one may want to dream of.
BTC is above confluence support. If it breaks this level, Strategy will fall even harder.
In my last post, out of 12 comments, 5 were hate comments—because “how can I say such enormities, that Strategy could fall.”
The answer is simple: the chart doesn’t look good at all.
Even if BTC reverses from this support, in my opinion the reflection in MSTR will be minimal.
And anyway, I trade what I see, not what Saylor sells me.
That being said, a drop of BTC under confluence support will most probably lead to a break below the neckline for Strategy. And if BTC delivers a meaningful correction, Strategy will fall like a giant with feet of clay that it is.
3330 Under Pressure – New York Could Decide the MoveYesterday’s Move
Yesterday, after the initial rejection from the 3370 resistance zone, Gold broke below the 3350 confluence support and tumbled toward the 3330 key support. Since then, the price has been consolidating, with low volatility — largely due to the European bank holiday.
Key Question
Has the market gathered enough energy for another leg down, or will buyers manage to defend 3330?
Why a Bearish Continuation Is Possible
- The 3330 zone is now being tested repeatedly, showing weakening buying interest
- A confirmed break under 3330 would open the way toward the 3280 support zone.
Trading Plan
I will watch for a clear break under 3330 during the New York session, aiming for a move toward 3280. Any long position becomes interesting only if we get a daily close above 3360.
Final Note
The market still needs to confirm — patience is key.
Disclosure: I am part of TradeNation's Influencer program and receive a monthly fee for using their TradingView charts in my analyses and educational articles.

Lingrid | GOLD Key Support Zone In Range-Bound MarketOANDA:XAUUSD is approaching the confluence of the downward trendline and the 3,315 support, forming a potential bullish reversal setup. The structure suggests a base-building phase after the recent correction, aligning with the 61.8% golden zone of the prior swing. A decisive push above 3,340 would confirm momentum toward the 3,400 target. Sustaining this move would keep bulls in control, aiming for a retest of the broader resistance zone.
📉 Key Levels
Buy trigger: Break and close above 3,340
Buy zone: 3,317–3,325
Target: 3,400
Invalidation: Below 3,300
💡 Risks
Failure to break 3,340 resistance could trigger another pullback.
Strong USD data may limit upside potential (PPI, Unemployment data).
Broader downtrend context still in play unless major resistance is breached.
If this idea resonates with you or you have your own opinion, traders, hit the comments. I’m excited to read your thoughts!

Lingrid | BNBUSDT Buying Opportunity Following Pullbacks The price perfectly fulfilled my previous idea . BINANCE:BNBUSDT is pulling back toward the upward trendline support after forming a higher low, keeping the bullish structure intact. Price action suggests buyers may step in near the 814 zone, aiming for a rebound toward 915 resistance within the channel. Holding above 800 would maintain the second impulse leg toward the projected 920 target. Momentum continuation aligns with the overall uptrend trajectory.
📉 Key Levels
Buy trigger: Break above 860
Buy zone: 814 – 850
Target: 915 – 920
Invalidation: Close below 800
💡 Risks
Failure to hold trendline support at 800
Weak breakout above 860 leading to a bull trap
Increased selling pressure near 915 resistance
If this idea resonates with you or you have your own opinion, traders, hit the comments. I’m excited to read your thoughts!

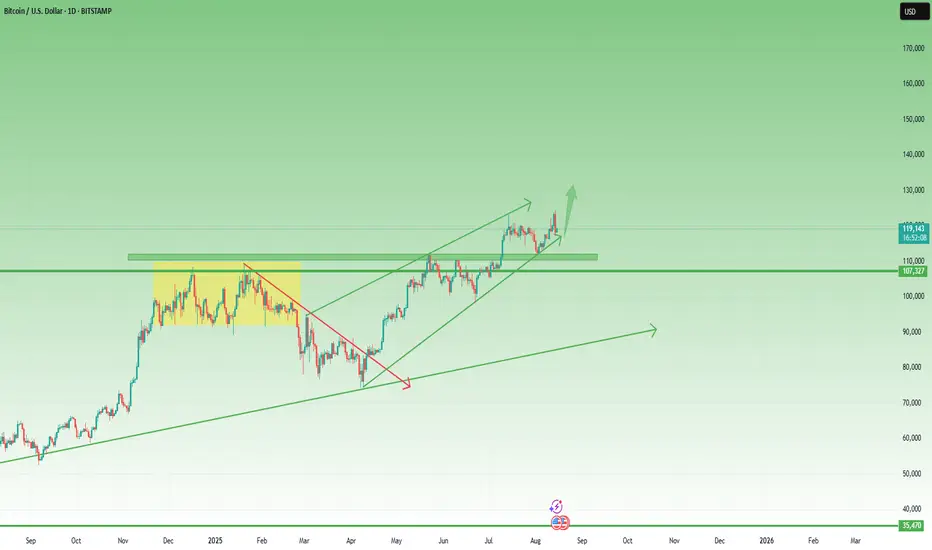
This BTC Pullback Doesn’t Break the Bullish StructureYesterday, BTC dropped around 5% from its freshly printed intraday ATH, reaching a low of 117,300. Should bulls be worried?
In my view, this drop can’t be seen as more than just a correction — while it was indeed quite deep, the overall structure remains fully intact.
Price is still comfortably above the ascending trendline that started in April, and even higher than the nearest horizontal support.
Bottom line: As long as BTC stays above the 110–112k zone, there’s no real reason for concern.
For short-term traders, this dip could even be seen as a buying opportunity — anticipating a push towards a new ATH above 125k. 🚀
Gold 3360-3370 short position perfect profitOur strategy of short selling based on the resistance level of 3360-3370 was very successful. The gold price reached the target position of 3340, with a profit margin of 200-300 points. Congratulations to those friends who followed the strategy and made a lot of money.
🔥🔥🔥Keep an eye on the support range of 3330-3340. If gold still fails to break below 3330, it could rebound again.
But once it falls below 3330, it is likely to run towards the 3300 integer mark.
Therefore, the gains and losses of 3330 are very important, and it is also the next trading window.
How to seize the opportunity and arrange long or short positions according to the situation. I wish you good luck!
📣If you have different opinions, please leave a message below to discuss

Gold: From Bullish Bias to Bearish Shift- N.Y UpdateIn this morning's analysis, I mentioned that Gold was still in bullish territory, but the line in the sand was the 3350–3355 zone.
In fact, I bought at that level — but given the choppy price action and the sharp rejection from the 3375 resistance, I kept the position size small. Good thing I did, as the stop loss was eventually hit.
With price now falling below the 3350 zone and showing what can be categorized as a strong reversal from resistance, the odds have shifted decisively to the bearish side.
Trading plan: Any rally above the 3350 zone should now be viewed as an opportunity to sell into strength. 🚀
Disclosure: I am part of TradeNation's Influencer program and receive a monthly fee for using their TradingView charts in my analyses and educational articles.

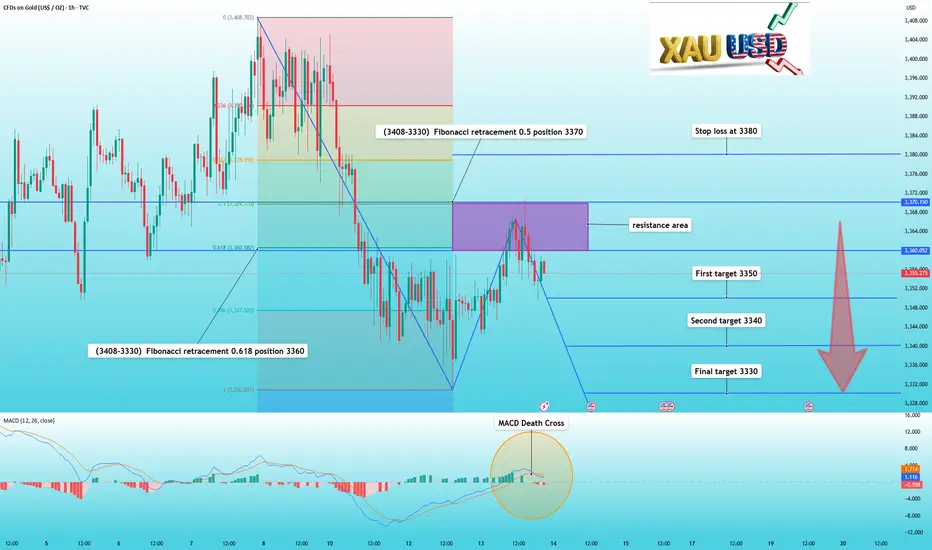
Gold pulls back as expected, you can continue to sellIn my previous trading strategy, I reiterated my view that gold prices would continue to fall if they couldn't break through 3370 in the short term.
And indeed, gold's performance behaved as expected. After hitting 3370, it fell again, reaching a low of 3350.
Technically, the current correction in gold prices hasn't concluded. The Fibonacci retracement indicator for the 3408-3330 trend shows that 3370 is at 0.5, and 3360 is at 0.618, representing resistance. Meanwhile, the MACD indicator has formed a death cross.
Therefore, we do not need to make any changes to our trading strategy. As long as 3370 is not effectively broken, we can continue to short based on the resistance range.
Trade setup is as follows:
Sell near the 3360-3370 area
First target 3350
Second target 3340
Final target 3330
Stop loss at 3380
📣If you have different opinions, please leave a message below to discuss
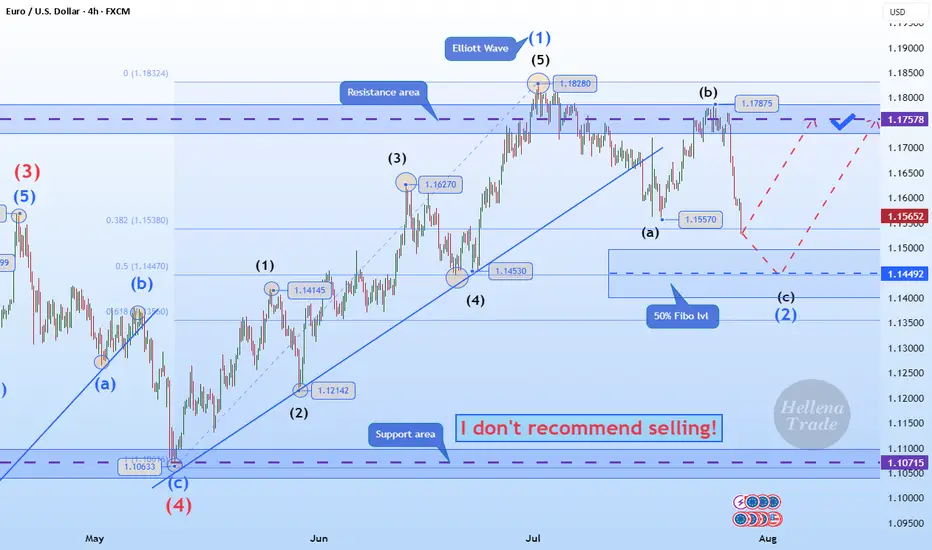
Hellena | EUR/USD (4H): LONG to the resistance area 1.17578.Colleagues, the price has made a strong downward movement, which can only mean one thing: the correction is not complete.
This means that the latest upward movement is wave “1” of medium order.
Therefore, I now expect the correction to end in wave “2” at the 50% Fibonacci level and thean upward movement to continue to at least the resistance level of 1.17578.
It is quite possible that after updating the level of 1.15570, the price will immediately begin an upward movement — this is a more risky option for entering a position.
Manage your capital correctly and competently! Only enter trades based on reliable patterns!
Lingrid | GBPCAD Shorting Opportunity Near Monthly High ZoneThe price perfectly fulfilled my previous idea . FX:GBPCAD has reached the July high and testing the resistance zone, where sellers previously stepped in. The structure shows an extended bullish impulse meeting the channel border and horizontal supply barrier. A rejection here could trigger a retracement toward 1.8551, provided momentum shifts in favor of sellers. If bearish pressure accelerates, deeper downside toward the support base could follow.
📉 Key Levels
Sell trigger: Rejection and close below 1.8650
Sell zone: 1.8757 – 1.8700
Target: 1.8551
Invalidation: 1.8757
💡 Risks
Breakout above the July high invalidating the short setup.
Continued CAD weakness from economic data or oil price drops.
Short-term bullish momentum overpowering early sell entries.
If this idea resonates with you or you have your own opinion, traders, hit the comments. I’m excited to read your thoughts!

Lingrid | SUIUSDT Expansion Trade OpportunityBINANCE:SUIUSDT is rebounding from the breakout point after holding above the 3.70 support zone. Price action is moving within an upward channel, supported by higher lows and recent breakout momentum. As long as 3.70 holds, buyers may attempt a move toward the 4.80 resistance area. Momentum remains aligned with the broader bullish structure targeting the channel’s upper boundary.
📉 Key Levels
Buy trigger: Break above 4.44
Buy zone: 3.70–3.80
Target: 4.80
Invalidation: Below 3.50
💡 Risks
Failure to sustain above 3.70 could trigger deeper retracement.
Rejection at 4.40 resistance may stall momentum.
Broader market weakness impacting altcoin sentiment.
If this idea resonates with you or you have your own opinion, traders, hit the comments. I’m excited to read your thoughts!

EUR/JPY – Lower High in the Making?As explained in my JPY Index analysis , alongside GBP/JPY, EUR/JPY is another strong candidate for a meaningful drop.
From the chart: after reaching a high near 174 — close to the 2024 ATH — the pair had its first leg down. When price dipped to the 170 psychological level, bulls stepped in, attempting a push to new highs.
However, at 173, it was the bears’ turn. The pair reversed again, potentially forming a lower high.
I believe we are in the early stage of a stronger drop, and in my view, rallies around 172 should be sold. The downside target is around 166.50, with this scenario negated on a break above the recent high. 🚀
Disclosure: I am part of TradeNation's Influencer program and receive a monthly fee for using their TradingView charts in my analyses and educational articles.

JPY Index – At a Critical JunctureLast month, I pointed out that the JPY Index was sitting in a very important support zone, making pairs like GBP/JPY and EUR/JPY worth keeping on traders’ radar.
Indeed, the index rebounded, which translated into a drop for both EUR/JPY and GBP/JPY. After the initial bounce, the index returned to test that zone once more.
What’s interesting now is that if the index continues higher, it will also break above the falling trendline. This could trigger an acceleration — and for GBP/JPY and EUR/JPY, that could mean a 500-pip drop.
JPY pairs should definitely be closely monitored from this point on. 🚀

Lingrid | BTCUSDT Trendline Breakout - Upside Surge Potential The price perfectly fulfilled my previous idea . BINANCE:BTCUSDT is pushing higher after reclaiming the 120,000 support zone and breaking out of the corrective structure. The trend shows higher lows, maintaining the integrity of the upward channel and pointing toward the 130,000 resistance area. Holding above 120,000 strengthens bullish momentum and keeps the breakout potential alive. The next upside target aligns with the channel’s upper boundary.
📉 Key Levels
Buy trigger: Break and hold above 120,000
Buy zone: 116,000–120,000
Target: 130,000
Invalidation: Drop below 114,850
💡 Risks
Rejection at 122,000 could cause deeper pullback
Macro market weakness may reduce bullish momentum
Failure to hold 120,000 risks retesting lower channel support
If this idea resonates with you or you have your own opinion, traders, hit the comments. I’m excited to read your thoughts!
