Lingrid | TONUSDT Pullback Trading OpportunityThe price perfectly fulfilled my previous idea . OKX:TONUSDT rejected from resistance and began to slide, confirming a bearish reaction from the upper boundary. The structure shows a consolidation breakdown followed by lower highs forming beneath the trendline. A drop below 2.00 could accelerate toward 1.88–1.79 as the market resumes its downward phase. Bearish momentum remains dominant while the pattern points toward a continuation of the sell-off.
⚠️ Risks:
A sudden BTC rally could lift the broader crypto market and delay further decline.
Strong buying pressure near the 1.90 zone might trigger a temporary rebound.
Unexpected positive TON ecosystem news could invalidate the bearish setup.
If this idea resonates with you or you have your own opinion, traders, hit the comments. I’m excited to read your thoughts!
Signalservice

Hellena | Oil (4H): LONG to resistance area 64.8.Colleagues, in fact, I have not changed the wave markup, but I have a slightly different view on the near-term price movement plan.
In the last forecast I emphasized that the target is the area of 58.9, but now it looks more likely that the completion of wave “C” in a complex correction (resistance area 64.8). Then I will consider the long-awaited downward movement again.
Manage your capital correctly and competently! Only enter trades based on reliable patterns!

Lingrid | ZECUSDT Short-Term Pullback After Bull TrapBINANCE:ZECUSDT is pressing into the 520–525 resistance band after a strong run within the upward channel, where liquidity above prior highs could invite a quick wick. Price action shows a steady sequence of higher highs/higher lows riding the rising trendline, but fake break setup may occur. If price holds above 498–502 after any sweep, a continuation toward 523–530 remains in play; a rejection and close back below 498 would open a rotation toward 475–460. Momentum stays bullish short-term, yet proximity to a major supply cluster argues for fade-risk before continuation.
⚠️ Risks:
Broad crypto pullback or BTC dominance spike rotating capital out of mid-caps.
Loss of the 498–500 trendline cluster, invalidating the local higher-low structure.
Negative macro headlines or hot U.S. inflation prints dampening risk appetite.
If this idea resonates with you or you have your own opinion, traders, hit the comments. I’m excited to read your thoughts!

Lingrid | GOLD Trend Continuation Pattern FormedOANDA:XAUUSD continues consolidating inside a broad descending channel after a failed attempt to break above 4050 resistance. Price action shows multiple rejections from the upper boundary while forming lower highs — a signal that sellers remain active. The focus now shifts toward the 3900 level as the next downside test, with a possible rebound near this zone before further direction develops. Momentum remains neutral-to-bearish unless bulls reclaim the 4060–4080 range.
⚠️ Risks:
Strong U.S. employment data this week could boost USD strength and extend downside pressure.
Rising Treasury yields may suppress gold’s short-term recovery potential.
Unexpected geopolitical tensions could trigger safe-haven inflows, distorting the bearish setup.
If this idea resonates with you or you have your own opinion, traders, hit the comments. I’m excited to read your thoughts!

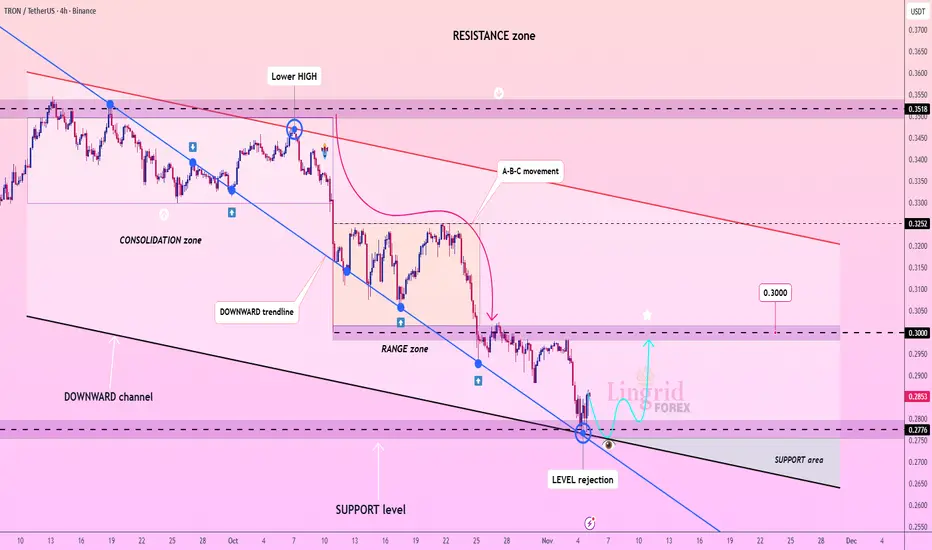
Lingrid | TRXUSDT Correction Rally Following DropThe price perfectly fulfilled my previous idea . BINANCE:TRXUSDT is showing early signs of reversal after rejecting the support level near 0.2770. Price action remains within a clear downward channel, but buyers have managed to defend the lower boundary, creating a possible short-term rebound setup. A sustained move above 0.2900 could open a path toward the 0.3000 resistance zone, where sellers are expected to return. This structure hints at a corrective phase before the broader bearish trend resumes.
⚠️ Risks:
Stronger-than-expected U.S. job data or inflation could boost the USD and pressure TRX lower.
Bitcoin volatility spikes may undermine altcoin recovery momentum.
Failure to hold the 0.2770 level could invalidate the short-term rebound setup.
If this idea resonates with you or you have your own opinion, traders, hit the comments. I’m excited to read your thoughts!
Another Volatile Day for Gold: Is the Next Leg Down Loading?Yesterday was just another volatile session for Gold...
After testing the waters above $4,000, price reversed sharply during the New York session, dropping to around $3,930.
A brief consolidation followed, and by the time of writing, Gold already rebounded toward $3,970, reclaiming the $3,960 support area.
Despite this recovery, the overall structure remains bearish — as long as price fails to stabilize above $4,000, sellers maintain control.
📉 Outlook:
I continue to expect another leg down, with $3,915 as my next focus, followed by the recent low around $3,885.

GBPUSD: Bearish Structure Points to 1.3000 NextAround two weeks ago, I mentioned that GBPUSD could fall toward the 1.32 support, and indeed, the pair reached that level on Wednesday.
Since then, GBPUSD even broke below 1.32 and is now trading around 1.3140, raising the big question — will it fall further to test 1.3000?
In my view, yes, it will.
The structure remains bearish, and since mid-September, every rally has been sold into, forming a clear lower highs – lower lows pattern.
So, in conclusion, rallies above 1.32 should be sold, with a target at 1.3000, as mentioned earlier. 🚀

Ethereum Recovery Stalls — $3K Retest on the Horizon?After the flash crash on October 10th, ETH recovered quite well — but as mentioned at that time, for a full recovery and return to a bullish tone, the price needed to reclaim the $4,300 resistance.
That never happened...
After a second attempt on Monday, the price is now back below $4,000, testing the recent short-term support zone.
Looking at the broader structure since early August, the market has turned decisively bearish, showing two clear phases of distribution.
As previously noted, the price continues to press against the confluence support, and I expect a breakdown to occur soon.
If that happens, ETH could fall toward the $3,000 area to retest the major support level that dates back to 2024.

BTC Analysis — Support or Trap? The 106–107k Zone Under PressureIn my previous BTC analysis — right before the flash crash — I mentioned that I was struggling to maintain my bullish stance, and that only a break back above 118k would restore confidence. In fact, I leaned toward a bearish bias, and the recent price action has confirmed those concerns.
The market has repeatedly failed to reclaim the 118k zone, continuing to drift lower toward 106–107k support.
As I’ve explained multiple times, when I see this kind of movement — price coming back to the same support again and again — it’s hard to believe that the market is doing it so we can all buy and profit.
Usually, this pattern acts as a trap, luring in buyers before a final breakdown.
That’s the scenario I’m watching once again.
Technical Levels:
- Resistance: 118k (major cap)
- Support: 106–107k (key zone)
- Interim level: 100k (psychological)
- Target on breakdown: 90k
My selling zone is between 113–115k, as I expect any bounce into this area to meet renewed selling pressure.

Gold Accumulates on Support, 3,952 USD is the Gateway for a New🔍 Market Context
Gold is oscillating within a symmetrical triangle pattern , reflecting price compression and waiting for a breakout signal.
Buyers still maintain a short-term bullish structure, but the series of lower highs indicates increasing selling pressure.
The 3,959–3,964 USD zone is currently the “balance point” — if this area is breached, the downtrend could extend to the lower liquidity zone around 3,929–3,921 USD .
💎 Key Technical Zones
• Resistance Zone: 4,020 – 4,040 USD → the main resistance area of the triangle, where strong reactions are likely.
• Support Zone: 3,959 – 3,964 USD → the support area maintaining the bullish structure.
• Liquidity Zone: 3,929 – 3,921 USD → low liquidity area, potential to attract price stop sweeps before reversing.
🎯 Trading Scenarios
1️⃣ BUY Setup – Prioritize when price holds above support
• Entry: 3,959 – 3,964 USD
• Stop Loss: 3,940 USD
• Take Profit:
– TP1: 3,985
– TP2: 4,020
– TP3: 4,040
– TP4: 4,096
✳️ “Buy the discount” – Buy at the trendline convergence support area when confirmation signals appear (rejection or bullish ChoCH).
2️⃣ SELL Setup – Scenario if support breaks
• Entry: 3,950 – 3,955 USD (after candle closes below support zone)
• Stop Loss: 3,970 USD
• Take Profit:
– TP1: 3,935
– TP2: 3,925
– TP3: 3,912
✳️ “Sell the breakdown” – Sell when support is clearly breached, targeting the lowest liquidity zone (3,921 USD).
💬 Summary
Gold is in a phase of accumulation before major volatility .
If it holds above the 3,952 USD zone → prioritize BUY following the bullish structure .
If it breaks below 3,952 USD → SELL following the breakout towards the Liquidity Zone.
The scenario will be clearly confirmed when the current symmetrical triangle is broken.
💡 Today's Tagline:
“Liquidity defines direction — follow where the money hides.”
⏰ Timeframe: 1H
📅 Updated: 11/04/2025
✍️ Analysis by: Captain Vincent

Gold Approaches 3960 Support After Failing at 4030Yesterday, I highlighted that Gold appeared slightly bullish, forming an ascending triangle with resistance around the 4030 zone. Early in the day, Gold did indeed rise and tested this resistance again. However, after the futures market opened, momentum started to fade, and the price began fluctuating around the 4000 level.
As we entered the Asian session, the bears took control, and Gold is now testing the 3970 level, approaching the key 3960 support, which aligns with yesterday's low.
If we see a break below this support, the next key levels to watch are 3915, a zone where Gold experienced significant reactions last week, and even 3890.
On the flip side, any stabilization above the 4000 level could shift the bias back to bullish.
Key Points:
- Downside: Break below 3960 opens 3915 and potentially 3890.
- Upside: Only stabilization above 4000 would suggest a bullish shift.
🚀 Let's see if Gold can make a move today, but remember, volatility remains extremely high and 3-400 pips means nothing for Gold nowadays

Silver Turns Bearish Again – Watch 47.50 Support CloselyPretty similar to Gold, Silver also failed to break above resistance yesterday and started to roll back down.
A few hours ago, the price touched short-term support and is now seeing a minor rebound.
However, the structure has clearly turned bearish, with lower highs confirming momentum exhaustion.
If 47.50 support breaks, a visit to 45.50 becomes highly probable — and even a test of the psychological 45.00 level shouldn’t be ruled out.
My strategy is to sell rallies, ideally near intraday resistance, following the medium-term bearish bias.

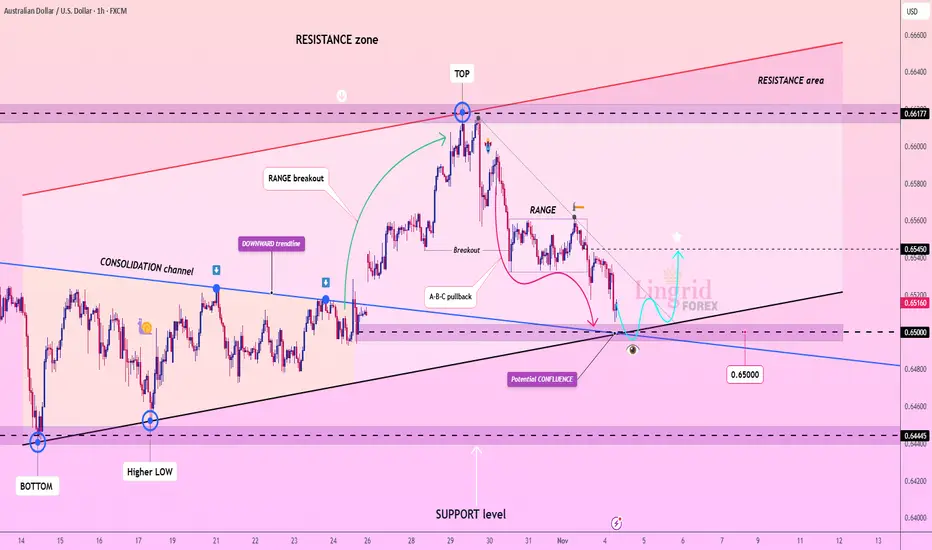
Lingrid | AUDUSD Psychological Support Long OpportunityThe price perfectly fulfilled my previous idea . FX:AUDUSD is testing the confluence support near 0.6500 after retracing from the 0.6617 resistance zone. Price action forms an A-B-C pullback pattern within a consolidation channel, suggesting the potential for a short-term rebound. Holding above 0.6500 could attract buyers aiming for 0.6545 resistance. Broader momentum supports a mild bullish recovery as long as this level remains intact.
⚠️ Risks:
Unexpected hawkish tone from the Federal Reserve could strengthen USD and cap recovery.
Weak Australian trade or employment data may renew downside pressure.
A sharp drop in commodity prices could undermine AUD sentiment.
If this idea resonates with you or you have your own opinion, traders, hit the comments. I’m excited to read your thoughts!
Hellena | Oil (4H): SHORT to support area of 59.00.Colleagues, the situation is complicated, but I still expect the price to renew the local low of 56.40.
It looks like the price is forming a complex compound correction (WXY) and I think that for now it is worth looking at the 59.00 area as the nearest most likely level.
Ideally, I would like to see the completion of wave “C” in the area of 64.80.
Fundamental context
According to the latest IEA report, the global oil market remains under pressure as supply continues to outpace demand. For 2025, production is expected to rise by around 3 million barrels per day, while demand growth is forecast at only 0.7 million barrels. This imbalance increases the risk of oversupply and inventory buildup across key regions.
Manage your capital correctly and competently! Only enter trades based on reliable patterns!

Lingrid | GOLD Weekly Market Outlook. Rally’s End or Reset?OANDA:XAUUSD explosive October rally — crowned by a historic monthly candle that shattered resistance and ignited euphoria — has now entered its reckoning phase. What looked like unstoppable momentum is now revealing signs of exhaustion. The sharp, volume-fueled drop toward $4,000 isn’t just a “healthy correction” — it’s the first real test of whether this bull can withstand gravity. And right now, the charts are whispering: "it may go down south".
The 4H chart reveals a classic “impulse leg” followed by an aggressive A-B-C correction — and we’re still in the “C” leg. But here’s the twist: if price breaks below $3,850 with conviction, the entire bullish structure collapses. That would open the door to a much deeper pullback — potentially down to $3,700 or even $3,600, targeting prior support zones and retesting the long-term upward channel’s lower boundary.
The monthly chart confirms the big picture: gold is in a powerful uptrend, but also in overbought territory after a vertical spike. The October candle closed above its open — a sign of strength, yes — but also a potential exhaustion signal since it formed a pinbar pattern. When markets rise too fast, they often fall harder.
In essence, gold is no longer climbing — it’s consolidating under pressure. The bull hasn’t died, but it’s breathing heavily. For us, this means one thing: sell the rips, buy the dips only if structure holds. The path of least resistance may now be downward. We should wait for confirmations.
If this idea resonates with you or you have your own opinion, traders, hit the comments. I’m excited to read your thoughts!

Lingrid | EURUSD Key Support Zone Hold Brief Bull MoveThe price perfectly fulfilled my previous idea . FX:EURUSD is approaching the key psychological level near 1.1500, signaling a short-term bullish move may occur within the broader downtrend. Price action shows a potential A-B-C recovery structure forming above the support zone, supported by early buying pressure from lower levels. If momentum continues, the pair could retest the 1.1610–1.1710 resistance range before facing renewed selling interest. Overall, buyers might attempt a corrective rebound toward the upper boundary of the descending channel.
⚠️ Risks:
NFP data could cap the rebound and resume downside momentum.
Upcoming Unemployment Rate and PCE may increase volatility..
A breakdown below 1.1500 would invalidate the short-term bullish scenario.
If this idea resonates with you or you have your own opinion, traders, hit the comments. I’m excited to read your thoughts!

DXY Analysis — Bulls at 100: Continuation or Correction?In my latest DXY analyses, I mentioned that the index could reverse and push higher, with the 100 figure acting as a key zone to watch for bulls.
Indeed, on Friday the index climbed right into this area and is now showing signs of minor consolidation.
The key question now:
👉 Will the DXY manage to continue above this critical level, or is it time for a pause?
In my view, a correction is looming for the index. Even if we see a short-term spike above 100, I expect it to be unsustainable.
For the near future, DXY could remain in a range-trading environment, with 100 as resistance and 97.50 as support.

Lingrid | BTCUSDT Support Break Bear Trend ContinuationBINANCE:BTCUSDT is trading inside a broad descending formation after rejecting from the upper resistance band near 116K. Price action has been forming lower highs while respecting the downward trendline and consolidating between 110K. As long as this zone holds, a short-term recovery toward 110K may occur before renewed selling pressure returns. Overall momentum remains bearish, with a potential drop toward the 102K–95K support area.
⚠️ Risks:
Unexpected strength in U.S. economic data could increase volatility and delay downside continuation.
ETF inflows resuming could strengthen spot demand.
Failure of price to stay below 110K would invalidate the bearish outlook.
If this idea resonates with you or you have your own opinion, traders, hit the comments. I’m excited to read your thoughts!

Gold Congestion: Clear Levels, Unclear DirectionAfter forming a local low at 3887 last week — a level perfectly aligned with the October ATH area — OANDA:XAUUSD started to recover from the recent 5k pips decline, retesting the 4050 resistance zone, which previously acted as strong support.
Since mid-last week, price action has entered a consolidation phase. Despite high intraday volatility, the structure is beginning to compress into a clear congestion pattern.
This range, roughly 1k pips wide, provides traders with well-defined reference points:
- Support: 3950–3960 zone – a break below this area would likely reopen the path toward the recent 3887 low.
- Resistance: 4040–4050 zone – a confirmed breakout above could trigger a continuation toward 4150.
At this stage, I am slightly bullish, given the sharp rejections from 3920 last week and the emerging ascending triangle structure, which often precedes upward continuation.
Still, confirmation is required — the market must decide whether this congestion is accumulation or distribution.

Lingrid | LINKUSDT Follow Through Pattern FormingBINANCE:LINKUSDT price action shows continued rejection from the descending trendline inside a well-defined downward channel. The structure remains bearish, with lower highs forming under resistance near $18.00. As long as this rejection holds, price could revisit the support area toward $15.00 before potential stabilization. Overall momentum aligns with a continuation of the broader downtrend.
⚠️ Risks:
Unexpected dovish shift in Fed tone boosting overall crypto sentiment
Strong BTC recovery above $120K improving altcoin structure
Short-term liquidity spikes causing false breakouts above $18.00
If this idea resonates with you or you have your own opinion, traders, hit the comments. I’m excited to read your thoughts!

Lingrid | TONUSDT Key Confluence Support Long OpportunityThe price perfectly fulfilled my previous idea . OKX:TONUSDT is retesting the key confluence area near 2.13 after multiple higher lows formed along the ascending support trendline. Price action shows compression within a narrowing structure, hinting at potential breakout momentum building up. A confirmed bounce from this support may lift price toward 2.28, aligning with short-term resistance and the upper boundary of the range. Overall bias stays bullish as long as the 2.10–2.13 support cluster holds firm.
⚠️ Risks:
Failure to hold the 2.10 support zone could invalidate the bullish scenario.
Increased volatility ahead of macro data releases could cause short-term whipsaws.
Weak momentum or low trading volume may limit the breakout’s sustainability.
If this idea resonates with you or you have your own opinion, traders, hit the comments. I’m excited to read your thoughts!

XAUUSD: Bulls vs. Resistance — 4050 Decides the Next MoveIn yesterday’s analysis, I mentioned that after the reversal from the 3920 support zone, Gold (XAUUSD) could continue higher toward the 4050 resistance area.
Indeed, that target has been reached, followed by a 600-pip leg down overnight.
At the moment, the price is resuming its upward move and is trading back above $4,000, around 4025.
Going forward, I expect volatility to remain high. If the bulls fail to sustain the price above 4050, another leg to the downside could follow.
For now, I’m out of the market, waiting to see whether we’ll get another test of 4050 — and more importantly, how the price reacts in that zone. 🚀

The Yo-Yo Market: Gold Swings Wildly but Goes NowhereRecently, Gold’s volatility has been extreme — with over 1,000+ pip swings up and down. Yet, despite all the loud noise , if we look closer, nothing truly significant has happened since the drop from the 4400 zone to below 4,000.
For most retail traders using stop losses, this type of environment has been extremely challenging — whipsaws in both directions.
However, if we step back and filter out the noise, a clearer structure begins to appear:
________________________________________
🔍 Key Observations
1. Normal Correction Behavior
The sharp drop from the all-time high actually stopped right at the previous ATH from early October — a very common technical behavior, where price retraces into prior calendar-based resistance zones.
2. Below 4K, But Not Broken
Although Gold is currently trading below 4,000, the move under that level is not yet a confirmed breakdown.
3. Strong Rebounds from 3920
Yesterday, price bounced aggressively from the 3920 zone, and this exact reaction repeated twice overnight — showing that buyers are still defending this area.
4. Correction Within the Golden Zone
Despite the dramatic fall, the current retracement sits just above the 61.8% Fibonacci level of the strong bullish leg from late August — technically, a textbook “golden zone” correction.
________________________________________
🎯 Trading Outlook
If we connect all the dots, Gold appears to be finishing a much-needed correction rather than starting a downtrend.
• Short term:
Resistance is found around 3975–3980. A clean break above could open the way to 4030.
• Medium term:
If Gold manages to stabilize above 4,000, the next upside targets are 4050, and possibly 4150 as we move into November.
________________________________________
⚖️ Final Thoughts
Yes, volatility is high — but beneath the surface, Gold is simply completing a natural corrective phase.
As long as 3900-3920 zone holds, the medium-term focus shifts back toward 4150.
🚀
