GBPUSD: waiting for impulse🛠 Technical Analysis: On the H4 chart, GBPUSD is compressing into a tight wedge/pennant right under the 1.3500–1.3536 resistance zone, signaling a potential volatility expansion. Price is losing momentum near the upper structure while the SMA50/100 sit overhead, acting as dynamic resistance. The key trigger is a confirmed breakdown below 1.3425, which would validate the bearish continuation scenario from the local pattern. If sellers take control, the next downside extension is aimed toward the lower marked support area near 1.3204.
———————————————
❗️ Trade Parameters (SELL)
———————————————
➡️ Entry Point: Sell on a confirmed breakdown and close below 1.34255
🎯 Take Profit: 1.32041
🔴 Stop Loss: 1.35362
⚠️ Disclaimer: This is a potential trade idea based on current analysis; market conditions and price direction are subject to change based on news factors and volatility.
Silver

Gold Bullish ContinuationHello Fellow Traders,
We're checking out Gold (XAU/USD) today.
Gold has been in a sideways range for the past few days, even after big news like CPI and PPI. Today we have US Unemployment Claims coming out in the NY session.
Price hit the Previous Day Low earlier, then broke above the 4620 area. We're seeing a Market Structure Shift (MSS) forming a Breaker Block and an FVG, plus a 4-hour Inverse Fair Value Gap (iFVG).
My expectation: Gold will pull back to the marked Breaker and FVG zone for a retest (discount area), then push higher — likely taking out the Previous Day High and grabbing the Buy-side Liquidity as marked.
This move is most likely after the jobless claims data releases. So, wait for the news, watch the reaction, and look for a good spot to enter longs with confirmation.
Always respect your risk — use small position sizes and protect your capital first!
Happy trading! Follow for more simple, clean ideas. What's your take on Gold post-claims? Dip to buy or straight continuation? Comment below!
#Gold #XAUUSD #JoblessClaims #TechnicalAnalysis #SMC #ICT #Forex #Commodities

Can Silver Extend Its Rally Into 2026? - Watch This Week's CloseCan silver extend its rally into 2026? How should investors manage the increase in volatility as silver margins rise?
As long as the US dollar remains in a downtrend, precious metals are likely to continue their bullish trend.
Mirco Silver Futures
Ticker: SIL
Minimum fluctuation:
0.005 per troy ounce = $5.00
Disclaimer:
• What presented here is not a recommendation, please consult your licensed broker.
• Our mission is to create lateral thinking skills for every investor and trader, knowing when to take a calculated risk with market uncertainty and a bolder risk when opportunity arises.
CME Real-time Market Data help identify trading set-ups in real-time and express my market views. If you have futures in your trading portfolio, you can check out on CME Group data plans available that suit your trading needs www.tradingview.com

Silver Bears Finally Make Their Mark Silver has been a tough market to watch, offering little in the way of a pullback as it surged to fresh record highs. As impressive as the move has been, trends like this inevitably roll over at some point — and we may have just seen an important first step from bears.
Today’s bearish range is already around 8% and looks set to close with at least a bearish outside day, with the potential for a bearish engulfing candle.
The 1-hour chart shows a clean break of the bullish trendline. While prices are now curling higher after a period of consolidation, several resistance levels loom — including the monthly pivot point, the broken trendline, and the $90 handle.
Bears could look to fade rallies into these resistance zones, in anticipation of another leg lower.
Matt Simpson, Market Analyst at City Index

Stop!Loss|Market View: USDJPY🙌 Stop!Loss team welcomes you❗️
In this post, we're going to talk about the near-term outlook for the USDJPY currency pair☝️
Potential trade setup:
🔔Entry level: 158.494
💰TP: 161.784
⛔️SL: 156.801
"Market View" - a brief analysis of trading instruments, covering the most important aspects of the FOREX market.
👇 In the comments 👇 you can type the trading instrument you'd like to analyze, and we'll talk about it in our next posts.
💬 Description: The resistance area of 158 has been broken, as previously noted. Buying remains the priority today, and all previous buy trades for this currency pair are active. Furthermore, given the current test of the 158 area, additional buying can be considered, with primary targets at 162 and 163. Level 164 is also considered a medium-term target. Entry points can be sought as close to current prices as possible.
Thanks for your support 🚀
Profits for all ✅

136 Years of SPX vs. Silver – What Should You Do in 2026?This chart shows the S&P 500 / Silver ratio (SPX/Silver) going all the way back to 1890 – a 136-year view of how U.S. equities have performed relative to silver.
The equity data before 1926 is reconstructed from the work of Alfred Cowles and later Robert Shiller; the modern S&P 500 index was created in 1957 and its predecessor, the S&P 90, began in 1926.
Silver prices are taken from long-term historical series that track spot prices back to the early 1900s.
So this ratio is not just a chart – it’s a 136-year financial history of stocks vs. hard money.
🌍 What the World Lived Through (1890–2026)
During this period, the world went through:
1914–1918: First World War
1929: U.S. stock market crash
1930s: Great Depression
1936–1939: Spanish Civil War
1939–1945: Second World War
1950: Korean War
1970s: Oil crises and inflation shock
1982: Worst U.S. recession in 40 years
1987: Black Monday crash
1995–2001: Dot-Com bubble
2008: Global Financial Crisis
2020: Covid crash
And yet, through all of this, the SPX/Silver ratio has moved in very large cycles, telling us when:
Paper assets (stocks) dominate, and
Hard money (silver) swings back with a vengeance.
🧮 The Five Big SPX/Silver Cycles
Using your key levels from the chart, here are the most important turning points:
1️⃣ 1930s – Great Depression Mean Reversion
April 1, 1930: SPX/Silver ≈ 70
April 1, 1935: SPX/Silver ≈ 12.5
Move in the ratio:
Drop: 82.1% from 70 → 12.5
Relative performance: 70 / 12.5 = 5.6×
👉 Silver outperformed the S&P by about 5.6x over that 5-year window.
2️⃣ 1970s – End of the Bretton Woods System / Stagflation
Oct 1, 1971: SPX/Silver ≈ 76
Oct 1, 1974: SPX/Silver ≈ 12.5
Move in the ratio:
Drop: 83.6% from 76 → 12.5
Relative performance: 76 / 12.5 ≈ 6.1×
👉 In the early 1970s inflation shock, silver outperformed stocks by ~6x.
3️⃣ 1980 – The Silver Mania Bottom in the Ratio
Jan 1, 1980: SPX/Silver ≈ 2.34
This is the lowest level in history.
From there, the next major top was:
Aug 1, 2000: SPX/Silver ≈ 310
The highest level in history.
Move in the ratio:
From 2.34 → 310 = ~132× increase
Silver massively underperformed; stocks dominated the next 20 years.
This is the mirror image: buying silver at the 1980 mania top and holding vs. SPX was catastrophic.
4️⃣ 2000–2011 – Tech Bubble to GFC to Silver Boom
Aug 1, 2000: SPX/Silver ≈ 310 (all-time high)
Aug 1, 2011: SPX/Silver ≈ 26
Move in the ratio:
Drop: 91.6% from 310 → 26
Relative performance: 310 / 26 ≈ 11.9×
👉 From 2000 to 2011, silver outperformed the S&P by almost 12x.
This captures the tech bust + GFC + big silver bull into 2011.
5️⃣ 2024–2025 – Our Current Cycle
Feb 1, 2024: SPX/Silver ≈ 225
Jan 14, 2025: SPX/Silver ≈ 76
Move in the ratio so far:
Drop: 66.2% from 225 → 76
Relative performance: 225 / 76 ≈ 3.0×
👉 In less than a year, silver has already outperformed the S&P by ~3x.
Note something extremely important:
📌 The 70–76 zone has acted as a key “ceiling” (resistance) for the SPX/Silver ratio between 1930 and 1991 – for about 61 years.
In previous cycles, when the ratio was rising into the 70–76 zone, it marked the end of stock outperformance and the start of a huge silver cycle.
Today, the ratio is falling down into 76 from above, which means we are in the middle of a silver outperformance phase, not at the start.
----------------------------------------------------------------------
👨👩👦 Maurice, Robert and Richard in January 1991
The chart tells a powerful story:
👨👩👦 Maurice buys silver on Jan 14, 1991 and holds until Jan 14, 2026.
👨👩👦 Robert buys the S&P 500 on the same date and holds until Jan 14, 2026.
👨👩👦 Richard buys the S&P 500 with 50% of his money and silver with the rest 50% on the same date and holds until Jan 14, 2026.
Because the ratio in 1991 and 2026 is the same, Maurice, Robert and Richard end up with roughly the same dollar value (ignoring fees and taxes). Over 35 years, their returns are similar despite choosing completely different assets.
-------------------------------------
👨👩👦 Now we meet Richard in January 2026.
He looks at this 136-year chart and has to decide:
I already have some money both in the SPX and Silver.
“Should I rebalance or stay 50% - 50% for the next 5-10 years?”
Today (Ratio ≈ 75)
Richard should take some profit from Silver and move into SPX:
📌 Recommended Allocation:
60% SPX
40% Silver
Why?
Because:
Ratio is sitting at previous resistance zone (70–76)
Short-term SPX might outperform in a relief rally
Silver has already made a historic move against SPX
Protective rebalancing reduces risk of a sharp mean-reversion
This is called risk-adjusted rebalancing.
Not selling silver completely — just trimming it.
If Ratio drops to 50:
➡️ Move to 70% SPX / 30% Silver
If Ratio drops to 31–26:
➡️ Move to 80% SPX / 20–25% Silver
If Ratio drops to 31–26:
➡️ Move to 80% SPX / 20% Silver
If Ratio drops to below 25:
➡️He has a story to tell to his grandchildren...

Silver $92: The "Boring" Rock That Crushed The Nasdaq (210% 1Y) "Wait... Silver did WHAT?" 🤯
I put the Thinking Face emoji on the chart for a reason. It represents 90% of the market right now. While everyone was busy arguing about Nvidia and Bitcoin, the "boring" gray rock quietly went vertical to $92.00.
If you were watching the Nasdaq, you missed the real show. This isn't just a rally, folks. It’s a Capital Rotation. The "Smart Money" stopped buying paper lottery tickets and started buying heavy metal.
Why is this happening?
1. Silver is the new "Tech Stock" ⚡
Forget grandma's silverware. You want to build AI Data Centers? You need Silver (it's the best conductor on Earth). You want to build Solar Panels? You need Silver. Basically, if you want the "Future," you have to buy the metal that powers it. We are running out of the essential ingredient for the tech revolution.
2. We Forgot to Dig 📉
For the last 10 years, nobody wanted to build silver mines. It wasn't "cool." Well, now demand is exploding, and guess what? You can't 3D print a silver mine. We are in a massive supply deficit. The only way to fix it is higher prices. Much higher.
3. The "Panic" Bid 🛡️
Let's be real—the world got a little crazy in 2025. When billionaires and Central Banks get nervous about currencies, they don't buy bonds anymore. They buy hard assets. Silver is just Gold on steroids.
The Chart:
Institutional "God Mode" Look at those colored lines (Moving Averages). They are fanned out like a royal flush.
Green Line (20 MA): Holding.
Purple Line (50 MA): Holding.
Orange Line (200 MA): Miles away.
This is what "Up Only" looks like when the big boys are accumulating.
The Verdict The "Thinking Emoji" is for the bears who are still waiting for a dip that never comes. Don't be confused. This is just what happens when Industrial Scarcity meets Unlimited Money.
Disclaimer: Just one trader's view on the madness. Not financial advice.
Are you team "Tech Stocks" or team "Heavy Metal" for 2026?
Fight it out in the comments. 👇

Silver is flashing a warning it hasn’t shown in decadesToday the price crossed $90 per ounce while the monthly RSI the 92 level. Higher than 2011, when silver topped out near RSI 82 and then fell by ~80%
The only other time we’ve seen this level was 1980… followed by a ~90% crash
History doesn’t repeat perfectly, but it does rhyme
So the real question is: what makes this time different?

Silver Is Consolidating, Likely Looking For More UpsideHey guys, today I am looking at silver,
as you know it made a blow-off top back in December, during the Christmas and holiday period, near 85, from where we then saw a sharp pullback of around 14–15% in just a few days. After that decline, the market stabilized around 70, and this kind of stabilization and choppy price action is very normal after a fast move higher followed by a sharp reversal lower. The next phase is usually consolidation, so for now we can see a relatively limited range, roughly between 70 and 84.
From an Elliott wave perspective, it looks like silver is pausing for wave four. Wave four can take different forms, it can be a flat, a triangle, or a more complex combination. Based on the most recent substructure, especially on the 4-hour time frame, a triangle looks quite likely, which means we could still be missing a few legs before the market eventually resumes higher.
The first key support area for a triangle is around 72.70, which also matches this week’s opening area and a small gap left behind, making it an interesting near-term support. Below that, a deeper and more important support zone comes in around 69–67. This lower area would matter if we see more liquidation and extended sideways action, and it could later provide a very attractive rebound zone.
Overall, this still looks like a healthy pause within an uptrend, with potential for one more push higher in the first one to two months of 2026. The key invalidation level for this view is 54.43, since the market should not trade back into that area. Even a move closer to the 61.8% retracement near 62.35 would already raise concerns that this is not a wave four of the degree we are tracking. For now, price is still well above those levels, so patience is needed, allowing the market to settle and consolidate before the next directional move, all within the broader bullish trend visible on the daily and weekly charts.
Thank you for your support
Grega

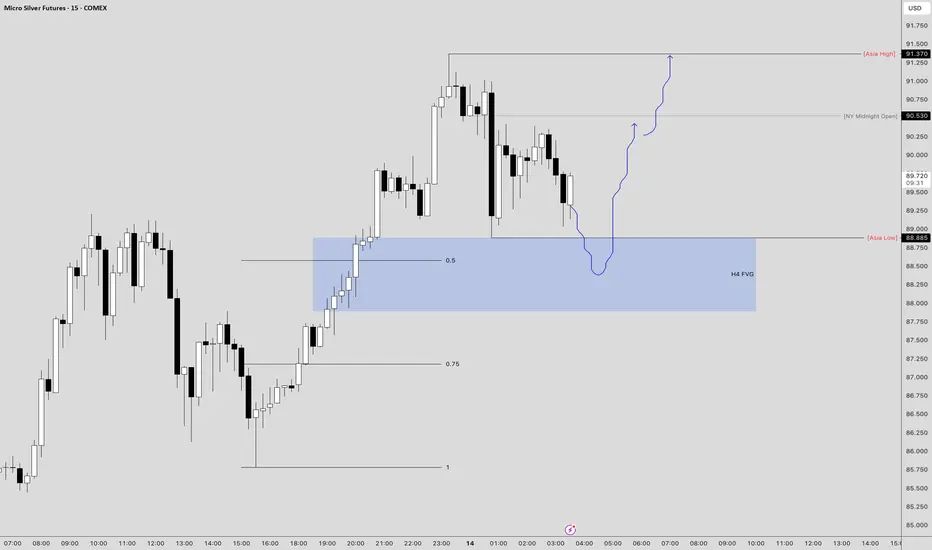
#SILVER Intraday Potential Bullish IdeaI will Look for opportunity in the lower tf after the price delivered into H4 FVG.
Silver Buy Trading Opportunity SpottedH1 - Strong bullish move
No opposite signs
Until the two support zones hold I expect bullish continuation
👉 If you enjoy this analysis, please Like, Follow, and Support the profile! Your engagement motivates us to share more quality setups.

Silver - Looking To Buy PullbacksH1 - Strong bullish move.
Currently it looks like a pullback is happening.
Until the two Fibonacci support zones hold I expect the price to move higher further.
If you enjoy this idea, don’t forget to LIKE 👍, FOLLOW ✅, SHARE 🙌, and COMMENT ✍! Drop your thoughts and charts below to keep the discussion going. Your support helps keep this content free and reach more people! 🚀
--------------------------------------------------------------------------------------------------------

Silver - Just Like in the Books?The move we’re watching runs from early September 2022 to the end of 2025.
We completed three strong upward waves and finished around 84 .
But the main phase of the uptrend actually started in March 2020.
So far, we’ve drawn waves 1 , 2 , and 3 , and now we’re forming the 4th corrective wave.
Since things are moving fast, we won’t focus too much on direction — just the main ideas and key levels.
First scenario:
Wave 2 of the larger move looks like a zig-zag, so in this correction we expect to see a flat.
This means a return to around 84 (slightly above or below), then back down, and then the next main move starts. The sizes of waves 2 and 4 could be roughly equal, around 12 .
Also, wave 1 may be equal in size to wave 5 , which is around 18 .
Another point: since this is a commodity, wave 5 could be bigger than all the others and reach well above 90 .
This is clearly visible on the smaller timeframe.
Second scenario:
A deeper correction of wave 3 is possible.
Potential levels: 68 -> 62 -> 58 -> 50
Only after that, the price moves upward toward 90+ .
Summary:
We could rise to 90 or higher.
We could correct down to 50
We’ve marked the main directions and target levels.
It’s a bit complex, but this example is similar to classic textbook patterns.
The key point — you’re now prepared for different possible outcomes.
---
Please subscribe and leave a comment.
You’ll get new information faster than anyone else.
---

Silver remains a buy-on-dips market? Silver is pushing higher again after US core CPI surprised to the downside. This has pulled US yields and the dollar lower, and that combination is supporting precious metals.
Other fundamental tailwinds are still in place too. Geopolitical tension in Venezuela and Iran continue and DOJ pressure on Jerome Powell at the Fed are helping keep a floor price.
The next near-term risk is tomorrow’s US Supreme Court decision on President Trump’s tariffs. If tariffs are struck down, it could trigger profit taking in silver and gold after a strong run. That said, Trump officials have already flagged alternative routes to reintroduce tariffs, so any initial move could be dip buying opportunities.
The first area to watch on dips is the prior breakout and consolidation zone around 86.00 to 86.50. If buyers defend that region, it keeps the near-term structure intact and leaves room for another attempt at 89.11, with a clean break opening the door to a psychological test of 90.00.
If the pullback deepens, the next support band sits around 84.00 to 85.00, where price previously paused before accelerating higher.

Jan 14 Major Volatility Event Update - Thank youI wanted to give everyone an update related to my thinking.
I'm not expecting this Jan 14 volatility event to be more than a 3-5% pullback event. I know that may seem huge for some of you, but it really is not that big.
What I really do expect is this event changes how the markets develop forward objectives for Q1 and Q2 2026.
I've tried to explain my actions and expectations in this video for all of you to review.
Remember, I'm just a trader like all of you. I use my tools and research to try to make the best decisions.
Overall, as I've learned, it is all about protecting capital and positioning for the best opportunities. If you are wrong, you take your lumps, learn, and try to do better next time. If you are right, you try to replicate that winning process.
As I mentioned before. Last year, I had a great year trading. I'm not going to go into details - but I'm very happy.
I'm looking to do even better this year.
As I continue to share more videos, remember one thing (please), I'm just sharing my thoughts. if you don't like my content - go find someone else you trust.
This is all about trying to make the best decisions.
Get some.

Stop!Loss|Market View: GBPUSD🙌 Stop!Loss team welcomes you❗️
In this post, we're going to talk about the near-term outlook for the GBPUSD currency pair☝️
Potential trade setup:
🔔Entry level: 1.33592
💰TP: 1.32129
⛔️SL: 1.34390
"Market View" - a brief analysis of trading instruments, covering the most important aspects of the FOREX market.
👇 In the comments 👇 you can type the trading instrument you'd like to analyze, and we'll talk about it in our next posts.
💬 Description: Following the release of US CPI data, the pound's situation began to closely resemble that of the euro. The likelihood that the trend has reversed to a downtrend is high. The price is expected to approach the 1.33800 area, where the POC level of the previous upward movement (ascending channel) is located. At this support area, accumulation and a subsequent downward breakout towards 1.32000 are expected. A decline to 1.31000 is also possible.
Thanks for your support 🚀
Profits for all ✅

SILVER BEST PLACE TO SELL FROM|SHORT
Hello, Friends!
We are going short on the SILVER with the target of 7,986.4 level, because the pair is overbought and will soon hit the resistance line above. We deduced the overbought condition from the price being near to the upper BB band. However, we should use low risk here because the 1W TF is green and gives us a counter-signal.
Disclosure: I am part of Trade Nation's Influencer program and receive a monthly fee for using their TradingView charts in my analysis.
✅LIKE AND COMMENT MY IDEAS✅

SILVER - Over Extended. Time to Book. SILVER - what a ride over last two years. Is it time to book and take the moolah home? I am planning to BOOK and wait for a big dip.
Disclaimer: This is not trading advice. Learning this and following it. Do your own research and use your own judgement before taking any action.

XAUUSD (GOLD) 4H – Risk/Reward 2.54 Tradertilki Analysis My friends, greetings,
I have prepared an XAUUSD-Gold analysis for you.
🔴 Entry Level: 4585.0
🔴 Stop Level: 4640.0
🟢 TP1: 4561.0
🟢 TP2: 4530.0
🟢 TP3: 4442.0
📊 Risk/Reward Ratio: 2.54
This analysis carries some risk, but since it has a good risk-reward ratio, I wanted to give it a try.
Let’s see together how it will turn out.
My friends, I share these analyses thanks to each like I receive from you. Your likes motivate me, and I truly appreciate all my friends who support me with their likes.❤️

XAUUSD: corrective setup🛠 Technical Analysis: On the H4 chart, Gold is showing a potential corrective setup after the recent swing high area. Price is hovering near the 4,560–4,580 zone, and a confirmed breakdown would signal that sellers are taking control. The SMA cluster (50/100) remains below price, but the downside scenario targets the next key demand area around 4,351, where structure support aligns with the broader trend support. If bearish momentum accelerates, the next major support zone near 3,900 becomes the medium-term objective.
———————————————
❗️ Trade Parameters (SELL)
———————————————
➡️ Entry Point: Sell on a confirmed breakout of 4,560
🎯 Take Profit: 4,351.15 (main target), extended target near 3,900
🔴 Stop Loss: Approx. 4,688.57
⚠️ Disclaimer: This is a potential trade idea based on current analysis; market conditions and price direction are subject to change based on news factors and volatility.

Fundamental Note: GOLD 12 Jan 2026Gold is printing the first major record high of 2026 as markets rush into safe havens on a sharp spike in geopolitical risk and US policy uncertainty. Protests in Iran are a key catalyst today: traders are pricing higher tail-risk around regional escalation and potential energy supply disruptions (Strait of Hormuz risk), which typically lifts gold’s risk-premium. The Venezuela situation remains in the background after last week’s US action, adding to “geopolitics bid” conditions even as expectations of Venezuela export normalization can cap oil’s upside. On the macro side, fresh concerns about Fed independence (and political pressure around the Fed) weakened the USD and reinforced demand for non-yielding hedges. The construction backdrop is mixed-but-cooling (UK construction recession signals, soft housing activity), which supports the idea of slower growth/inflation ahead — a setup that can keep real yields contained and indirectly favor gold. In metals, “supply vs demand” is diverging: mined gold supply is strong (WGC notes 2025 mine output tracking a record), but physical availability can still feel tight regionally — China’s premiums recently widened while India’s retail demand softened at elevated prices.
Bottom line: today’s price action is being driven more by risk-premium and USD dynamics than by jewelry demand, with volatility likely to stay elevated while headlines remain hot.
🟢 Bullish factors:
1. Safe-haven demand on Iran unrest / escalation risk.
2. Venezuela geopolitics keeps risk-premium supported even if oil stays range-bound.
3. Fed-independence concerns + softer USD boost non-yielding hedges.
4. Regional physical tightness signals (China premiums) despite high global prices.
🔴 Bearish factors:
1. If geopolitics cools quickly, the “risk-premium” can unwind fast.
2. Record-high prices strain retail demand (notably India), increasing pullback risk.
3. Any rebound in US real yields / USD would pressure gold from these highs.
🎯 Expected targets: Bullish bias while above 4,550–4,520, with upside toward 4,650–4,750 if risk headlines persist. A volatility-driven pullback could retest 4,500–4,450; a deeper risk-off-to-risk-on flip would expose 4,350–4,300 as the next support zone.

Silver and the 1980 Blow-Off Fractal – An Analytical NoteFrom a structural perspective, the long-term silver chart exhibits similarities to the 1970s–1980 cycle when evaluated through fractal behavior and Fibonacci extensions. Rather than serving as a price analogue, the historical comparison functions as a framework for understanding market phases: accumulation, acceleration, and terminal expansion.
The 1980 silver peak occurred within a macroeconomic environment defined by persistent inflation, negative real interest rates, fiscal expansion, and a delayed but ultimately aggressive monetary policy response. In contrast, the current cycle operates in a structurally different yet directionally comparable regime. Elevated sovereign debt levels, long-term fiscal deficits, and a policy bias toward financial stability have constrained the ability of central banks to maintain restrictive real rates for extended periods.
This monetary backdrop supports a regime of higher volatility in real assets, even as policy transmission remains uneven. Following a prolonged consolidation, silver has transitioned into an impulsive advance with rising momentum and shallower pullbacks—features consistent with late-cycle behavior observed in the historical fractal.
Fibonacci extensions derived from the secular low and the 2011 high define zones of structural relevance rather than directional targets. The former peak near the 1.0 extension represents a key equilibrium area, while higher extensions—particularly the 4.236 level—align with regions of increased instability and volatility in the 1980 analogue. In that cycle, price acceptance above such levels was brief and followed by rapid mean reversion.
Overall, the projection should be interpreted as a conditional analytical framework. It integrates price structure with macro and monetary context to highlight zones of rising instability, not deterministic outcomes, as silver potentially transitions from trend continuation toward terminal dynamics.

