Education Excerpt: Simple Moving AverageSimple Moving Average
The origin of inventing the Simple Moving Average (MA) is not clear. Although, some of the first documented cases of its use date as far back as the early 20th century. Implementation of moving averages in technical analysis is one of the most successful methods of identifying trends. Moving averages are simply constant period averages - usually of prices, that are calculated for each successive period interval. The result of calculation is then plotted on the chart as a smooth line that represents successive average prices. Thus, the calculation of the moving average dampens fluctuations of price of an asset, making it easier to spot an underlying trend. Though use of the moving average goes beyond identifying trends. Support, resistance and price extremes can be anticipated by correct interpretation of the moving average.
Crossover
Generally, when the moving average with a lower period interval crosses above the moving average with a higher period interval it is considered a bullish signal. On the other hand, when the moving average with a longer period interval crosses above the moving average with a lower period interval it is considered a bearish signal. These crossovers can serve as specific buy and sell signals in markets that are trending. However, moving average crossovers tend to produce many false signals in non-trending markets. Furthermore, these same crossovers can act as support or resistance levels.
Illustration 1.01
Picture above depicts daily graph of PepsiCo (Ticker:PEP) with 20-day SMA (blue) and 35-day SMA (red). With implementation of these two moving averages it is easily observable that prevailing trend is bullish. Crossovers between these two simple moving averages reveal where trend began (10th February 2017) and where it ended (7th July 2017). In addition to that analyst can identify price extremes when price deviates too far from its 20-day SMA.
Length of the period
Different lengths of moving average directly translate to the amount of data used in the calculation. Including more data in the calculation of the moving average makes each data per time interval relatively less important. Therefore, a large change in one particular data would not have as large an impact on the overall result of the calculation in comparison to if the moving average with a shorter period was employed. Hence, the longer moving average produces less false signals at the cost of revealing underlying trend sooner rather than later. Usually, the use of two moving averages with different period intervals is encouraged as opposed to use of a single moving average. This comes from the premise that when two moving averages with different period intervals are plotted on a chart, they tend to show two separate lines converging and diverging.
Illustration 1.02
Picture above depicts daily graph of XAUUSD with 3-day SMA (blue) and 6-day SMA (red). Viewer can see that 3-day SMA copies price move more agressively than 6-day SMA.
Illustration 1.03
Picture above depicts exactly same graph as is showed in Illustration 1.02. However, length of SMAs differs. Blue line represents 10-day SMA while red line represents 20-day SMA. It is clear that when length of SMAs was extended then SMAs produced less mechanical signals (crossovers) as opposed to SMAs used in Illustration 1.02.
Calculation
The calculation of the moving average usually involves use of the close price. Normally, 10, 20, 50, 100 or 200 periods are used and the calculation is conducted by creating the arithmetic mean of a dataset.
SMA = (A1 + A2 + An) : n
A = average in period n
n = number of time periods
Illustration 1.04
Picture above shows daily graph of Coca Cola (Ticker:KO). In this particular example trend was neutral and it is visible that crossovers between two simple averages produced many false signals.
Disclaimer: This content is just excerpt from full paper that will be published later. It serves educational purpose only.
Simple

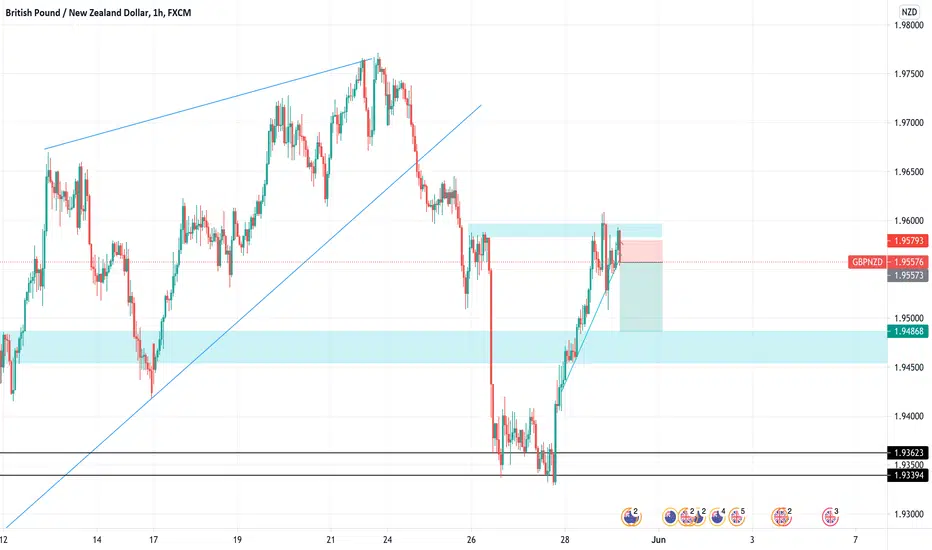
the calm before the stormim thinking down but will ultimately trade with the break, looking for 2/1 trades

Short xauusdSee chart in h1.
Strong resistance.
Go to trigger time frame.
Trigger line $$$ break $$$ pullback $$$ target

price at important levelWe take a look at a simple analysisNZDCHF of price is trending in a descending channel and has reached the bottom of the channel. we would be looking for a bullish reversals with a buy to the upper line of the descending channel, but if price breaks support on the other hand we would be entering sells on retest and rejection of price to previous support levels OANDA:NZDCHF
BEST OF LUCK
LIKE SUPPORT ND COMMENT THANK YOU

GBPJPY FOR SELLSLooking for gbpjpy to come into this bearish ict orderblock and attack the swing low as a future target

TrendyTrades: SNAP AnalysisCan we just take a moment to stop and appreciate these beautiful technicals. TrendyChartsAnalysis combines clean charts with accurate technicals.

Potential Short Coming Into Rate Decision Looking for nzdusd to break triangle to the downside , we expect the RBNZ to keep rate the same disappointing the markets


EURJPY [SHORT] Channel TradeStraightforward trade waiting for rejection on the price action of the previous support.

Potential Sell On AUD/USD. Easy Call.Wait for retest of old support and further move down to the next zone.


USDCHF Swing Short- Rejections from 0.9 psych level
- Daily highs
- downtrend
- Bearish dollar fundamentals

EURUSD Swing Long- Uptrend
- 1.217 strong support
- Bullish EUR fundamentals
- Waiting on wick back into zone for entry


GBPAUD Swing Short- Daily Highs
- Trend Structure
- Bullish Iron Ore Fundamentals
(AUD Exports)
- Waiting on:
Double top
Head and shoulders
for entry confirmation.


Continuation of A DonwtrendThe price shows a good rejection from 0.382 Fib retracement and good chance it will proceed further down to touch the trendline.
Conservative traders, wait for another confirmation by a resistance with beautiful candles in the 5 mins or 15 mins tf.
No more than 0.5% risk per trade, control risk management very strictly.

A Nice Clear Chance to Ride the Channel The market has been moving in a very nice way in the long run particularly in the rising wedge pattern. It made a new high recently and there is a high probability that it will travel down for some time now, my personal taste says 76.5 at least.
A chance to take short ASAP as soon as the market opens because a resistance has been formed and this is a nice entry to travel the down move.
Never risk more than 0.5% risk on the trade, let the risk to reward do its job.

A short time ranging market.As you can see the market is ranging in a small zone for sometime and it just met with the supply zone, which means that it will have highest chances to move to the demand zone now.
It has started fhe move and it maybe taken as a late entry but there is a chance.
Apply strict risk management, no more than 0.5% on the trade.

A beautiful trade.A textbook trade out in the real world.
Price has been moving in a good upper channel for some time and it has reached the resistance trend line for the channel.
An extremely good chance that the price will travel down to the supporting trend line.
The stop loss is placed very tightly, if by chance it gets taken out, enter again when it retests at the above (near the blue rectangle).
However, if you wanna play conservative, go with the blue line that I drew as a small trendline, when the price touches that, look for a retest and nice bearish candle, and enter the trade with a good stop loss above the resistance level.
Never risk more than 0,5% on a single trade and stop-loss to entry when 2 RR achieved.
Nothing is guaranteed in trading but finding high possibility setups with a good probability of the trade working out may just do the job.

High Risk Quick Short SetupThis is a high-risk setup, proceed with caution.
A conservative trader would wait for a retest before placing a buy order but in order to buy we wait for a dip - that is what we are doing, travelling the dip.
It may dip or continue up without a dip, but it's a good chance it will.
The price is respecting the supply line multiple times earlier, not much juice left but still a good sell for high risk setup.
Only 0.5% risk per trade, minimize risk by putting stop loss to entry at 1.5 RR.
High chance of Short Price has been ranging for a good time in the wide 4H time frame.
Price got rejected from the supply line.
There is a out of trend pattern waiting for a possible retesting (Red line).
There is a rising wedge in the 1 hour time frame with good rejections. (Blue line).
To top it all, a nice bearish engulfing candle coming from top.
Please proceed with proper risk, no more than 0.5% risk in the trade. It may do a short retest and be up back to your stop loss, careful there.

DOGE; SimpleHere we have a box.
With it comes goals Doge must achieve.
1 - Break downwards trendline.
2 - Consolidate in box(lower half/purple)
3 - break halfway point
4 - consolidate in top half of box
5 - break out of box
Here is what the objective would look like based off the -64% dip in April.
A law that DOGE follows is a simple one.
When we grow, the boxes double; this includes time.
The last box phase in April took around 11 days.
Expect this one to last twice as long; 22 days.
-WARNING-
Doge needs to complete objective number 1 first though.
If not, we might be on our way to the 200 daily EMA.
There's a lot more to discuss but for now,
let's see what happens!
