EURGBP Long Setup as ECB-Growth Outlook Supports EuroToday, I’d like to share a trading opportunity on the EURGBP pair( OANDA:EURGBP ), so stay with me!
Let’s start with a brief fundamental overview. EUR is likely to rise against GBP as the ECB may keep the rate unchanged, and euro growth may appear stronger compared to GBP, which is likely to decline or depreciate slowly.
Currently, EURGBP is hovering near a support zone(0.8664 GBP-0.8651 GBP).
From an Elliott Wave perspective, it seems that EURGBP has completed a zigzag corrective pattern(ABC/5-3-5), and we can now anticipate the next bullish wave.
I expect EURGBP to soon begin an upward trend and target the resistance zone. If that resistance zone(0.8698 GBP-0.8688 GBP) is broken, we can look for further upward movement toward the resistance lines.
First Target: 0.8697 GBP
Second Target: 0.87105 GBP
Stop Loss(SL): 0.8649 GBP(Worst)
Points may shift as the market evolves
Do you think EURGBP can resume its upward trend?
💡 Please respect each other's opinions and express agreement or disagreement politely.
📌Euro/British Pound Analysis (EURGBP), 4-hour time frame.
🛑 Always set a Stop Loss(SL) for every position you open.
✅ This is just my idea; I’d love to see your thoughts too!
🔥 If you find it helpful, please BOOST this post and share it with your friends.
Simplemovingaverages

EURUSD testing the daily 200SMAExpecting a short bounce here at the 200SMA even with the strong US economic data and withering EUR strength. Tight SL and quick exit if theory is correct. RSI in oversold territory on the 4H for the previous 11 sessions+.

VanEck Africa Index ETF: A Momentum Play Worth MonitoringThe VanEck Africa Index ETF (AFK) has been performing well over the last year. Nice and steady gains with a recent pullback that could be a good watch for an entry. Over the past year, the fund has delivered a 71% gain and this persistent upward trajectory, including a 33% rise over the last six months , suggests a sustained trend rather than a short-term price spike.
What makes this movement notable is the supporting volume, which has recently been running at roughly 210% of its 50-day average . This level of activity often points toward institutional accumulation. On the fundamental side, the outlook for the region is being shaped by significant cross-border investments, such as a recent 1-billion-dollar commitment from the UAE toward AI development in Africa. This shift toward technology and infrastructure may be providing a fresh catalyst for a region traditionally tied to commodities.
For those who like upward trending assets with great momentum, the current technical profile presents an interesting setup. After a strong run, the ETF has undergone a mild 2.5% pullback , allowing the RSI to settle near 60. This cooling-off period has moved the price into a potentially better value area, while still remaining comfortably above both the 50-day and 200-day EMAs and the overall price action remains firmly in a bullish structure.
For traders who prioritize established trends, AFK could be worth a watch.

EURNZD at the weekly 20SMARSI oversold on the 4H and testing the weekly 20SMA, expecting a bounce here. See profit take profit.

ZEC approaching daily 50SMAZcash aka ZEC is now hitting the daily 50SMA (overlayed on this 4H chart).
Either a strong bounce here or serious crash coming.

AUDNZD at a critical support levelRisky play here but the potential upside is immense. With AUD CPI just dropping hotter at 3.8% vs 3.6% forecast and NZD lowering interest rate, again, this time by 25bps, the liquidity sweep that followed on the pair could be a gift for longs. The RSI is overbought on the daily, and has been due for a correction however fundamentals are screaming for a continuation of the upward move. Currently sitting sitting at a key uptrend support of a large pennant and the daily 50SMA simultaneously. If one were to play this pair, tight SL should be a priority. Anything can happen, nothing is certain.

Bitcoin's Death Cross is Here: A crash with a message for all!Bitcoin has just delivered one of its most significant reality ✔ checks of the year — the recent crash wasn’t simply a dip; it was a multi-layered market unwind that exposes the current fragility of the crypto ecosystem.
📉 Current Bitcoin Situation: “From Euphoria to Uncertainty”
Bitcoin’s trend shifted rapidly over the past few weeks.
Spot ETFs that once fueled relentless upside have significantly slowed inflows, with some days printing net outflows as retail enthusiasm cooled and institutions trimmed exposure.
Meanwhile:
Over billions in long liquidations hit in some days.
Funding flipped aggressively negative
Sentiment turned from greed → hesitation
High beta alts saw steeper collapses, showing risk-off behavior
This wasn’t random volatility — it was a controlled flush triggered by structural weakness.
🔥 Why Bitcoin Crashed: The Real Story
🔹 Technical Factors
BTC lost a major support cluster after multiple failed attempts to hold the mid-range.
Open interest was overheated, creating the perfect setup for a liquidation cascade.
Price rejected sharply from a supply zone that aligns with the weekly imbalance.
☠️ Death Cross on Daily Time Frame: Now Confirmed
The 50 SMA crossing below the 200 SMA is not a “doom event” by itself…
But historically, Bitcoin rarely ignores this signal, especially when paired with weakening momentum and fading liquidity.
⚠ The last major Death Cross?
2022’s brutal bear continuation, which led to several months of grinding downside before any meaningful reversal.
The current structure looks uncomfortably similar:
Lower highs printing consistently
Loss of trend strength
Distribution patterns on higher time frames
Declining demand from smart money inflows
This isn’t fearmongering — it’s observation.
🔹 Fundamental + Macro Factors
ETF inflow cooldown = reduced demand pressure
Miners started selling into strength to stabilize income post-difficulty adjustment
Global markets leaned risk-off due to macro tightening
Whales began distributing quietly (confirmed by on-chain inflow spikes into exchanges)
When technical fragility meets fundamental slowdown, crashes are not accidents — they’re consequences.
🐋 Whales Are Selling: “When the quiet money moves, the market reacts loud.”
On-chain data over the last week showed:
Increase in exchange inflows from large wallets
Spot distribution from old long-term holders
ETF issuers are reducing inventory during downswings
This behavior is classic:
Whales distribute during periods of retail excitement…
Retail panics during whale exits…
And the crash becomes a self-fulfilling cycle.
📅 4–6 Week Forecast: “Chop, Pain & Opportunity”
Over the next month or so, the market will likely experience:
Sideways-to-down structure
Failed rally attempts near the 50 SMA
Whip-saw price action due to low conviction
Accumulation pockets are forming quietly
BTC needs to reclaim the 50 SMA with strength before a clean trend resumes.
Until then, volatility ≠ strength.
🎯 Conclusion: Re-Investment Zones & Smart Accumulation
Crashes are emotional for most, but strategic for the prepared.
This is not a call to rush.
It’s a reminder:
Smart money enters when sentiment collapses.
Dumb money enters when sentiment peaks.
Analyze. Prepare. Don’t chase.
🧩 Comment down below 👇 and let’s talk about how to overcome it — build awareness together as traders, not competitors.
If this Idea gave you valuable information, then please boost it, and follow for more practical trading!
Happy Trading & Investing!
Team @TradeWithKeshhav
BTC hitting the Monthly 20EMA supportBTC has touched the Monthly 20EMA (overlayed on this 4H chart) on a huge sell off, should make a strong bounce here or it's off to the pits of hell going into December.

EURCAD testing weekly SMA on 1H oversold RSIAs per subject, standard simple setup, EURCAD testing the weekly 20SMA on an oversold RSI on hourly. Also hitting the top of FVG created on Sept 5th. Nothing is certain. Tight SL.

Adding This Screener Nets Me A Buy Signal For TronTrading Fam,
It's been a year of learning and lessons with my new indicator. In the stock space, this thing is en fuego. No learning curve necessary. I simply implemented the indicator into my TradingView list and waited for an alert to fire. Out of that has come and 42% portfolio gain. And that's with an average of 50% plus cash on the sidelines!
In crypto, I've had to learn a couple of important lessons:
Number one, only trust the indicator to work most reliably on high-cap, high-volume traded cryptos.
Number two, I just realized most recently, and that is what I'll discuss in this video: if I am trading alts, only long those that have a price above the 350 SMA and only short those with a price below the 350 SMA, preferably ensuring that the BTC dominance chart reflects exactly the opposite. So, BTC dominance should be below the 350 SMA while the alt I enter has a price above the 350 SMA if I am going long, and just the opposite if I am going short.
I've set up a screener in TradingView to help me accomplish this, and I'll discuss a little bit more about how it works and what it finds. I end the video with a match in which all of the above outlined variables have been met, along with my indicator giving us a buy signal inside a large buy-side liquidity block.
Enjoy.
✌️Stew

NASDAQ: ADI – Third Breakout Above $240 Key Resistance?NASDAQ: ADI (Analog Devices) has been consolidating for about a year and a half since May last year. During this period, the $240 level has acted as a major psychological and structural resistance zone.
Over the past year, price has tested this level three times — yet none of the weekly candles managed to close above $240, each time retreating shortly after. This showed consistent selling pressure at that zone.
In recent months, however, the price action has started to shift.
* First Breakout (June 30): ADI closed above $240 after a three-month rally, but the move lacked a proper pullback or base formation. Price failed to hold above the breakout level afterward.
* Second Breakout (August 18): A second attempt after a month of mild consolidation also failed to sustain above $240, signaling insufficient buying momentum.
* Third Breakout (October 6): Last week’s weekly candle finally closed at $242.87, about $2.87 above the key resistance, marking a third breakout attempt — and this time, the setup looks technically healthier.
The latest two weekly candles formed a clear “break and reclaim” pattern:
1. The first candle broke below the $240 level and tested the 20-week SMA.
2. The following candle reclaimed both the SMA 20 and the $240 level in one strong move.
This indicates that the market successfully retested short-term support and regained strength quickly — completing a constructive pullback within just two weeks.
In summary:
* $240 remains the key line in the sand.
* The third breakout shows stronger technical structure (with retest + reclaim).
* If price can continue holding above $240 with increasing volume, ADI could be entering a renewed uptrend phase following its long consolidation.

NYSE: ADM – Uptrend Structure Intact with Strong Confluence SuppNYSE: ADM (Archer-Daniels-Midland) has been in a steady uptrend since April, forming a consistent pattern of higher highs and higher lows. After breaking above the 50-day SMA, price has remained comfortably above it — with every pullback showing healthy consolidation and renewed buying interest.
From mid-year onward, all four major simple moving averages — SMA 50, 100, 150, and 200 — have completed a bullish alignment, each sloping upward. This marks a decisive shift in market structure from a previous downtrend into a confirmed uptrend, reflecting growing institutional confidence.
Price has also respected the rising trendline (green) multiple times — around June 5, August 1, October 3, and October 15 — each time rebounding and closing back above the SMA 50, showing consistent trendline support.
Over the past two months, ADM has been consolidating near the $60 level, forming a horizontal base (red dotted line). Notably, several candles in September showed long lower wicks, signaling liquidity grabs below $60 — likely sweeping retail stop-losses before a quick recovery.
At present, price sits above multiple layers of support:
* Bullish SMA alignment (50 > 100 > 150 > 200)
* Rising trendline (green)
* $60 horizontal support zone (red dotted line)
* 50-day SMA as dynamic support
This confluence of signals reinforces ADM’s medium- and long-term bullish bias. As long as price holds above the trendline and SMA 50, the path of least resistance remains to the upside.

NYSE: FRO – Bulls Defending Key Trendline & SMA 50 SupportSince April, NYSE: FRO has been building a steady uptrend, forming a sequence of higher highs and higher lows. Each corrective wave has consistently found support along the rising trendline (GREEN), which has now been successfully tested three times.
In July, price broke above the 50-day SMA (BLUE) and has since turned it into a strong dynamic support — a sign of clear trend recognition by the market.
Most recently, on October 14, FRO printed a candle that tapped into multiple layers of confluence:
* Retest of the ascending trendline
* Touch of the rising 50-day SMA
* Stop-hunt wick sweeping below recent lows
* Reclaim of the horizontal support (RED dotted line)
This combination suggests a strong defense from buyers at this zone. While short-term volatility may persist, the overall structure remains constructive — as long as price holds above the trendline and SMA 50, the bullish momentum stays intact.

How to Use Moving Averages in TradingViewMaster moving averages using TradingView's charting tools in this comprehensive tutorial from Optimus Futures.
Moving averages are among the most versatile technical analysis tools available, helping traders analyze trends, identify overbought/oversold conditions, and create tradeable support and resistance levels.
What You'll Learn:
Understanding moving averages: lagging indicators with multiple applications
Simple moving average basics: calculating price averages over set periods
Key configuration choices: lookback periods, price inputs, and timeframes
How to select optimal lookback periods (like 200-day) for different trading styles
Using different price inputs: close, open, high, or low prices
Applying moving averages across all timeframes from daily to 5-minute charts
Analyzing price relative to moving averages for trend identification
Using 50-day and 200-day moving averages for trend analysis on E-Mini S&P 500
Mean reversion trading: how price tends to return to moving averages
Trend direction analysis using moving average slopes
Famous crossover signals: "Death Cross" and "Golden Cross" explained
Trading moving averages as dynamic support and resistance levels
Advanced moving average types: weighted and exponential moving averages
Applying moving averages to other indicators like MACD and Stochastics
Balancing sensitivity vs. noise when choosing periods
This tutorial may benefit futures traders, swing traders, and technical analysts who want to incorporate moving averages into their trading strategies.
The concepts covered could help you identify trend direction, potential reversal points, and dynamic trading levels across multiple timeframes.
Learn more about futures trading with TradingView:
optimusfutures.com
Disclaimer:
There is a substantial risk of loss in futures trading. Past performance is not indicative of future results. Please trade only with risk capital. We are not responsible for any third-party links, comments, or content shared on TradingView. Any opinions, links, or messages posted by users on TradingView do not represent our views or recommendations. Please exercise your own judgment and due diligence when engaging with any external content or user commentary.
This video represents the opinion of Optimus Futures and is intended for educational purposes only. Chart interpretations are presented solely to illustrate objective technical concepts and should not be viewed as predictive of future market behavior. In our opinion, charts are analytical tools—not forecasting

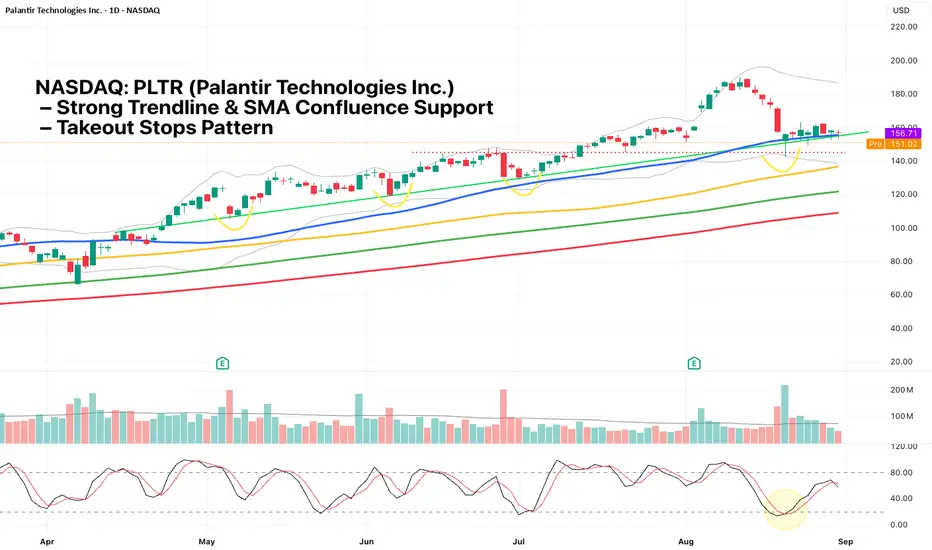
NASDAQ: PLTR – Strong Trendline & SMA Confluence SupportNASDAQ: PLTR Palantir remains in a clear uptrend with the moving averages aligned (SMA 50 > SMA 100 > SMA 150 > SMA 200). Since April, price has consistently traded above the 50-day SMA, finding support on each pullback to the trendline (green line). This trendline has been tested four times over the past six months, the latest on August 20.
On August 20, PLTR formed a hammer candlestick while testing multiple key supports simultaneously:
1) Horizontal support (red dotted line)
2) Cut Lower Bollinger Band
3) Tested 50-day SMA
4) Trendline support (green line)
5) Stochastic in oversold zone
6) Takeout stops pattern: wick flushed below prior lows, likely taking out stops before reversing
This strong confluence of signals suggests buyers are defending the level, offering a favorable risk-reward setup.
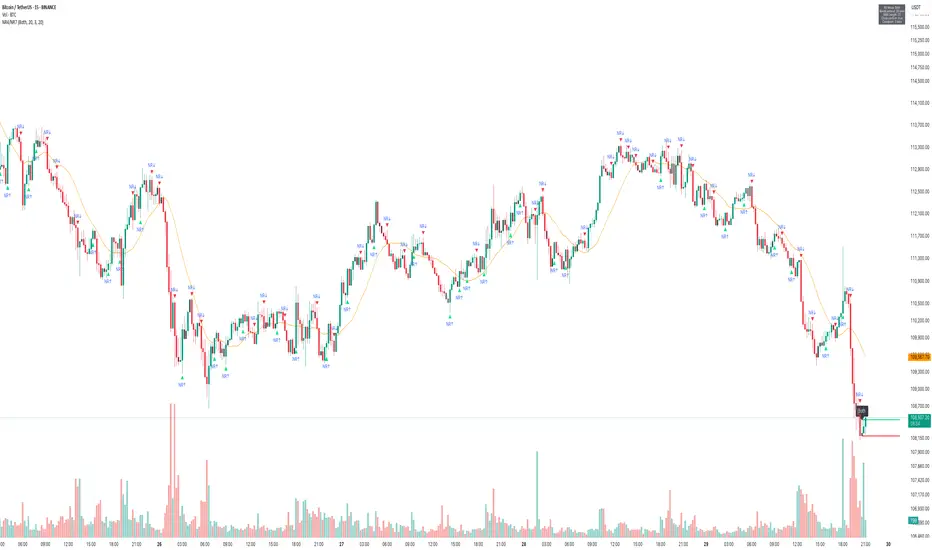
How to Use - "Volatility Squeeze (NR4/NR7) in Action"Overview
The NR4/NR7 V olatility Squeeze & Breakouts indicator highlights narrow range bars (the tightest candles in the last 4 or 7 bars).
These patterns often signal price contraction before an expansion move.
Performance Snapshot from the Chart
• Multiple NR4/NR7 labels appeared during sideways phases, correctly highlighting compression zones.
• Breakouts above/below the marked levels often triggered short directional bursts.
• The final cluster near the right edge (orange NR bar) preceded a sharp downside breakout, confirmed by both price and volume.
• The 20-period SMA acted as a bias filter:
• Breakouts below the SMA during the downtrend aligned with stronger moves.
• Breakouts against the SMA were generally weaker or faded quickly.
Key Observations
1. Clustering of NR Bars:
• When NR4/NR7 patterns cluster together, it often signals that a bigger move is loading.
2. Breakout Triggers:
• The High/Low of the NR bar served as clean breakout reference levels.
3. Volume Confirmation:
• Strong moves (especially the last breakdown) came with spikes in volume, adding conviction.
How Traders Can Use This
• Identify Volatility Contraction : Spot NR4/NR7 bars as potential setups.
• Set Levels: Use NR High/Low for breakout triggers.
• Add Filters : Combine with trend (SMA), volume, or support/resistance for stronger conviction.
• Risk Management : Opposite side of the NR bar can serve as a logical stop level.
$TDUP - Bullish Before Earnings TodayNASDAQ:TDUP was a pick from my August 3rd, 2025 newsletter, along with NYSE:HWM , NYSE:RBC , and $AMSC. These picks all have the following in common:
Performance 10Y > Performance 5Y - No long term dips in performance
Performance 5Y > Performance 1Y - No short term dips in performance
SMA(300) < Price - Price above moving average
SMA(200) < Price - Price above moving average
Avg Volume 10D > 100K - No lightly traded stocks. Liquidity needed
SMA(200) >= SMA(300) - Stacked long-term simple moving averages
SMA(50 >= SMA(200) - Stacked mid-term simple moving averages
ROE, Trailing 12 Months > 0% - Improving ROE (Return on Equity)
PE increasing quarter-over-quarter
NASDAQ:TDUP has an earnings event after hours on Monday, August 4th - today. On a fundamental note, earlier this year they exited the European market and have gotten a big growth benefit from some of the AI tools, like Style Chat, that they’ve introduced to their ecommerce platform.
With their entire focus being redirected to the US market, and their numbers showing the benefits of this new focus, they have a fighting chance to be a solid pick for the next few years.
EPS and ROE have gained in the last quarter, but there is some overhead resistance right now based on the free TradingView Indicator Magic Order Blocks .
Oh, and they’ve been winning a lot of awards and recognition on the technology front, including a nod for their Chief Product and Technology Officer, Dan DeMeyer, being named a 2024 Vanguard at the beginning of the year, by Modern Retail.
My analysis shows that there is an expected 23% move because of the earnings events based on implied volatility. But the IV is so large, the movement over the last few trading days might take the wind out of the sails of today's announcement. Unless, of course, there's a miss. In which case, bulls might get smashed.
This is a slightly riskier play, considering the IV going into earnings, but could be a big winner if NASDAQ:TDUP stays on their current trajectory.
Or, I could be wrong. 😕🤔

SelectQuote | SLQT | Long at $2.18SelectQuote NYSE:SLQT is currently resting within my historical simple moving average zone. This often signals consolidation and a future move (in this case, let's hope up). Looking at the company's financials, NYSE:SLQT is currently profitable. For Q3 2025 (ended March 31, 2025), the company reported a net income of $26.0 million, up from $8.6 million in Q3 2024. This follows a strong Q2 2025 with a net income of $53.2 million. While like most companies there are likely headwinds in 2025 (earnings are projected at a loss of -$0.20 per share due to seasonal fluctuations and investments in 2025 (e.g., new Kansas facility)), profitability is likely to stabilize in 2026, with EPS forecasts of $0.05, supported by improved Medicare reimbursement rates and operational efficiencies. Ongoing Department of Justice allegations could pose risks... but SelectQuote’s recent $350M investment and cost management suggest profitability may continue if legal issues are resolved favorably.
Thus, at $2.18, NYSE:SLQT is in a personal buy zone. There is a potential for the price to dip to the bottom of the historical simple moving average channel (near $1.25) in the near-term, but time will tell.
Targets:
$2.64
$4.24

Beating the S&P 500 with TradingView's Stock ScreenerThis is Mo from MWRIGHT TRADING. The date is Friday, June 27th, 2025.
This video is about selecting stocks that collectively have the potential to consistently beat the S&P 500
I look for smooth and consistent long-, mid-, and short-term performance. For that we need
Building a Screener
What I look for
- Liquidity - that means money, or trading volume.
- Room to move - no overhead resistance
- Favorable trends - stable moving averages
- Good short term signals - a good intraday chart
Filters
- Market Cap 300M to 2B
Not too big, and not too small
- Perf 10Y > Perf 5Y
No long term dips in performance
- Perf 5Y > Perf 1Y
No short term dips in performance
- SMA(300) < Price
Price above moving average
- SMA(200) < Price
Price above moving average
- Avg Volume 10D > 100K
No lightly traded stocks. Liquidity needed
- + SMA(200) >= SMA(300)
Stacked long-term SMAs
- + SMA(50 >= SMA(200)
Stacked short-term SMAs
- + ROE, Trailing 12 Months > 0% (Chris Mayer)
Improving ROE
Examples
- SENEA
- DGII
Review the charts
- Verify short term performance
- Multi-VWAP (1 hr Chart) - Free Indicator
- Above a rising 5-Day AVWAP
- Magic Order Blocks (5 min Chart) - Free Indicator
- No major overhead resistance
- Verify fundamentals and long term performance
- ROE (Quarterly) - TV Indicator
- Rising ROE
- Float Shares Outstanding - TV Indicator
- Lower float means lower supply. When high demand occurs, this can act as a price catalyst.
- Multi VWAP from Gaps - Free Indicator
- Stacked is good
- 3 SMA Ladies - Custom Indicator
- Stacked is good

DEATH CROSS on the SP500?We just witnessed the 50-day SMA crossing below the 200-day SMA — a technical signal known as the Death Cross.
Historically, this pattern has been associated with:
Trend reversals from bullish to bearish
Extended downside pressure
A loss of investor confidence in the short-to-medium term
🧠 While not always followed by major crashes, the last time this pattern showed up in a similar setup was followed by an accelerated drop — and that’s exactly what we’ve seen again.
The real question now is: 👉 Was this a false signal or is more downside ahead?
🔍 Keep an eye on price action around the 5,400–5,500 zone. If it fails to recover, this death cross might just be the start of a deeper correction...

How to develop a simple Buy&Sell strategy using Pine ScriptIn this article, will explain how to develop a simple backtesting for a Buy&Sell trading strategy using Pine Script language and simple moving average (SMA).
Strategy description
The strategy illustrated works on price movements around the 200-period simple moving average (SMA). Open long positions when the price crossing-down and moves below the average. Close position when the price crossing-up and moves above the average. A single trade is opened at a time, using 5% of the total capital.
Behind the code
Now let's try to break down the logic behind the strategy to provide a method for properly organizing the source code. In this specific example, we can identify three main actions:
1) Data extrapolation
2) Researching condition and data filtering
3) Trading execution
1. GENERAL PARAMETERS OF THE STRATEGY
First define the general parameters of the script.
Let's define the name.
"Buy&Sell Strategy Template "
Select whether to show the output on the chart or within a dashboard. In this example will show the output on the chart.
overlay = true
Specify that a percentage of the equity will be used for each trade.
default_qty_type = strategy.percent_of_equity
Specify percentage quantity to be used for each trade. Will be 5%.
default_qty_value = 5
Choose the backtesting currency.
currency = currency.EUR
Choose the capital portfolio amount.
initial_capital = 10000
Let's define percentage commissions.
commission_type = strategy.commission.percent
Let's set the commission at 0.07%.
commission_value = 0.07
Let's define a slippage of 3.
slippage = 3
Calculate data only when the price is closed, for more accurate output.
process_orders_on_close = true
2. DATA EXTRAPOLATION
In this second step we extrapolate data from the historical series. Call the calculation of the simple moving average using close price and 200 period bars.
sma = ta.sma(close, 200)
3. DEFINITION OF TRADING CONDITIONS
Now define the trading conditions.
entry_condition = ta.crossunder(close, sma)
The close condition involves a bullish crossing of the closing price with the average.
exit_condition = ta.crossover(close, sma)
4. TRADING EXECUTION
At this step, our script will execute trades using the conditions described above.
if (entry_condition==true and strategy.opentrades==0)
strategy.entry(id = "Buy", direction = strategy.long, limit = close)
if (exit_condition==true)
strategy.exit(id = "Sell", from_entry = "Buy", limit = close)
5. DESIGN
In this last step will draw the SMA indicator, representing it with a red line.
plot(sma, title = "SMA", color = color.red)
Complete code below.
//@version=6
strategy(
"Buy&Sell Strategy Template ",
overlay = true,
default_qty_type = strategy.percent_of_equity,
default_qty_value = 5,
currency = currency.EUR,
initial_capital = 10000,
commission_type = strategy.commission.percent,
commission_value = 0.07,
slippage = 3,
process_orders_on_close = true
)
sma = ta.sma(close, 200)
entry_condition = ta.crossunder(close, sma)
exit_condition = ta.crossover(close, sma)
if (entry_condition==true and strategy.opentrades==0)
strategy.entry(id = "Buy", direction = strategy.long, limit = close)
if (exit_condition==true)
strategy.exit(id = "Sell", from_entry = "Buy", limit = close)
plot(sma, title = "SMA", color = color.red)
The completed script will display the moving average with open and close trading signals.
IMPORTANT! Remember, this strategy was created for educational purposes only. Not use it in real trading.

S&P 500 Drops Below 100-Day Moving Average The S&P 500 has broken below its 100-day simple moving average (SMA), a key technical level that many traders and institutions use to gauge trend strength. Historically, when the price falls below this moving average, it often signals a potential shift in market sentiment.
What This Means:
🔹 Potential Trend Reversal? If the index fails to recover above this level, we could see increased selling pressure, leading to further downside.
🔹 Bearish Confirmation: A sustained close below this moving average might attract more short sellers, reinforcing a downward move.
🔹 Buying Opportunity? If buyers step in and reclaim the 100-day SMA, this could be a temporary dip before resuming the uptrend.
Are we looking at the start of a deeper correction or just a pullback before new highs? Let’s see how the market reacts!
#SP500 #TechnicalAnalysis #MovingAverages #TradingStrategy

Trading with the 20 & 100 Simple Moving Averages (SMA) The Simple Moving Average (SMA) is a powerful trend-following tool that helps traders identify buy and sell opportunities. In this chart, we use:
SMA 20 (Purple Line) → This moving average represents the average price of the last 20 candles. Since it reacts quickly to price changes, it reflects short-term momentum and helps identify early trend shifts.
SMA 100 (White Line) → The 100-period SMA smooths out price action over a longer timeframe, reducing noise and showing the overall market direction.
Trading Strategy: The Golden & Death Cross
✅ BUY Signal: The SMA 20 crosses above the SMA 100 → This is called a Golden Cross, and it indicates that recent prices are rising faster than the long-term trend, suggesting a shift toward bullish momentum. Traders see this as a buying opportunity since short-term demand is increasing
❌SELL Signal: The SMA 20 crosses below the SMA 100 → This is called a Death Cross, and it shows that recent prices are dropping below the long-term trend, signaling a potential bearish market shift. This suggests that sellers are taking control, increasing the likelihood of a downtrend.
By using moving averages, traders can filter out market noise and trade with confidence.
