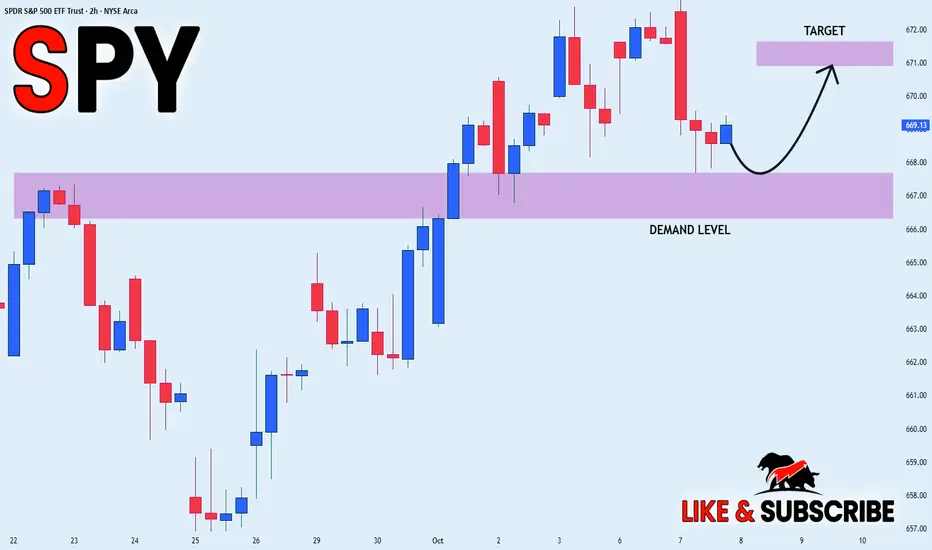
SPY STRONG UPTREND|LONG|
✅SPY showing a strong bullish structure with clear rejections from the demand level. Price continues to form higher lows, confirming institutional support and momentum toward the 671$ target zone. Time Frame 2H.
LONG🚀
✅Like and subscribe to never miss a new idea!✅
Smartmoney
NZDUSD BEARISH BREAKOUT|SHORT|
✅NZDUSD breaks below the key level with strong bearish momentum, confirming a clean breakout setup. Price may retest the broken structure before continuing lower toward the 0.5790 target liquidity zone. Time Frame: 2H.
SHORT🔥
✅Like and subscribe to never miss a new idea!✅

GOLD SHORT FROM ATH 4000$
✅XAUUSD is getting closer to the 4,000$ epic supply level and will soon be forming a potential all-time-high rejection. Liquidity above will be cleared, and Smart Money shows bearish intent toward lower rebalancing levels near 3,920$.
—————————
Entry: 3,982$
Stop Loss: 4,010$
Take Profit: 3,920$
Time Frame: 4H
—————————
SHORT🔥
✅Like and subscribe to never miss a new idea!✅

WHATS UP WITH BITCOIN?
✅BITCOIN went up by almost 16.5% in under 11 days and established a new All-Time-High. An absolutely incredible run, so no wonder we are now seeing a bearish correction.
The take profit wave and the local opportunistic selling pressure might take the price back down to around 118,000$ demand area. This is where we can start buying from again as I am sure a new ATH will be established soon!
LONG🚀
✅Like and subscribe to never miss a new idea!✅

AUD-USD Free Signal! Buy!
Hello,Traders!
AUDUSD reacts strongly from the horizontal demand area, confirming bullish displacement as Smart Money defends discount levels. With liquidity swept below structure, price seeks to rebalance inefficiency toward 0.6599$.
-------------------
Stop Loss: 0.6574$
Take Profit: 0.6599$
Entry: 0.6585$
Time Frame: 1H
-------------------
Buy!
Comment and subscribe to help us grow!
Check out other forecasts below too!
Disclosure: I am part of Trade Nation's Influencer program and receive a monthly fee for using their TradingView charts in my analysis.

ETHEREUM Local Long! Buy!
Hello,Traders!
ETHEREUM reacts perfectly from the horizontal demand area, showing bullish intent as Smart Money rebalances inefficiency. A move toward the 4,560$ target level remains probable as demand continues driving expansion. Time Frame 2H.
Buy!
Comment and subscribe to help us grow!
Check out other forecasts below too!
Disclosure: I am part of Trade Nation's Influencer program and receive a monthly fee for using their TradingView charts in my analysis.

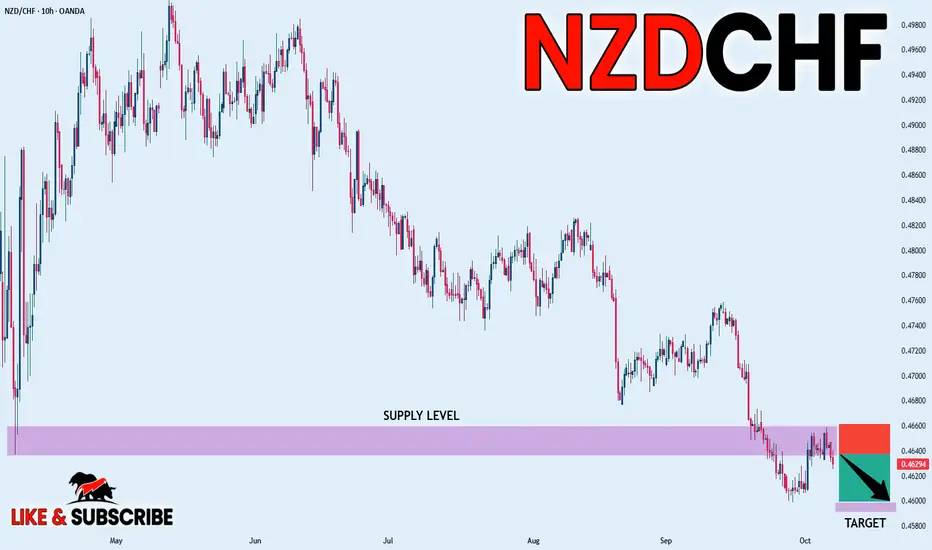
NZDCHF FREE SIGNAL|SHORT|
✅NZDCHF forms a clear double top inside the supply level, signaling exhaustion of buyers. Price rejects premium range and confirms bearish intent as liquidity shifts lower toward the target zone.
—————————
Entry: 0.4620
Stop Loss: 0.4645
Take Profit: 0.4580
Time Frame: 10H
—————————
SHORT🔥
✅Like and subscribe to never miss a new idea!✅
EUR-USD Will Grow! Buy!
Hello,Traders!
EURUSD taps into a horizontal demand area where Smart Money seeks to accumulate long positions. The strong reaction from discount pricing suggests a probable expansion toward the 1.1700 target level as buy-side liquidity gets cleared. Time Frame 3H.
Buy!
Comment and subscribe to help us grow!
Check out other forecasts below too!
Disclosure: I am part of Trade Nation's Influencer program and receive a monthly fee for using their TradingView charts in my analysis.

GBPUSD: Bulls Will Push
The charts are full of distraction, disturbance and are a graveyard of fear and greed which shall not cloud our judgement on the current state of affairs in the GBPUSD pair price action which suggests a high likelihood of a coming move up.
Disclosure: I am part of Trade Nation's Influencer program and receive a monthly fee for using their TradingView charts in my analysis.
❤️ Please, support our work with like & comment! ❤️

GBPCAD: Long Trade with Entry/SL/TP
GBPCAD
- Classic bullish pattern
- Our team expects retracement
SUGGESTED TRADE:
Swing Trade
Buy GBPCAD
Entry - 1.8727
Stop - 1.8708
Take - 1.8764
Our Risk - 1%
Start protection of your profits from lower levels
Disclosure: I am part of Trade Nation's Influencer program and receive a monthly fee for using their TradingView charts in my analysis.
❤️ Please, support our work with like & comment! ❤️

EURCAD: Will Keep Growing! Here is Why:
The price of EURCAD will most likely increase soon enough, due to the demand beginning to exceed supply which we can see by looking at the chart of the pair.
Disclosure: I am part of Trade Nation's Influencer program and receive a monthly fee for using their TradingView charts in my analysis.
❤️ Please, support our work with like & comment! ❤️
EURUSD: Bullish Continuation & Long Trade
EURUSD
- Classic bullish setup
- Our team expects bullish continuation
SUGGESTED TRADE:
Swing Trade
Long EURUSD
Entry Point - 1.1665
Stop Loss - 1.1653
Take Profit - 1.1695
Our Risk - 1%
Start protection of your profits from lower levels
Disclosure: I am part of Trade Nation's Influencer program and receive a monthly fee for using their TradingView charts in my analysis.
❤️ Please, support our work with like & comment! ❤️

GER40 Review October 7 2025Short-term price movement ideas.
As expected from yesterday’s forecast, the price tested the daily long FVG, after which we received confirmations on the 4H timeframe. At the moment, the price is located within the 4H area of interest, where it has just swept the Asian session low — a strong trigger for a potential continuation of the upward movement. If this liquidity sweep is confirmed, we can then consider opening a long position with the target of updating the previous high.
Be flexible, adapt to the market, and the results will come quickly. Good luck to everyone.

Xauusd - OrderBlock Rejection Setup to 4000 TargetPrice action on the 15m chart shows a strong bullish structure with multiple BOS (Break of Structure) and CHoCH (Change of Character) points, confirming trend reversal to the upside. Price is currently pulling back after hitting a weak high, suggesting potential for a retracement before further continuation.
Key zones:
Order Block (OB) and FVG (Fair Value Gap) overlap: High-probability demand zone for entries.
Price is expected to break the support trendline and retrace into the OB/FVG zone for a liquidity sweep.
Entry confirmation: Wait for a rejection candle within the OB zone for long setup.
Target: 4000 psychological level, aligned with liquidity above recent highs.
This setup aligns with smart money concepts — wait for price to grab liquidity before entering in the direction of the trend.

EUR/AUD Ready for Another Drop? Watch 1.7500!🔹 COT (Commitment of Traders)
Euro Futures: Non-commercial longs slightly decreased (-789) while shorts increased (+2,625) → mild bearish sentiment on the Euro.
AUD Futures: Non-commercial longs increased (+1,718) while shorts surged strongly (+10,148) → clear bearish positioning on the Australian Dollar.
📌 Combined Interpretation: Mixed signals — institutional investors are trimming Euro longs while heavily increasing AUD shorts, which could sustain EUR/AUD strength in the short term despite mild Euro weakness.
🔹 FX Sentiment (retail positioning)
56% short vs 44% long.
📌 Retail slightly net short → mild contrarian signal supporting short-term upside for EUR/AUD, but not extreme enough to indicate a reversal.
🔹 Seasonality
October is historically neutral to slightly bullish for the Australian Dollar, suggesting potential resilience.
However, Euro tends to gain modestly into late Q4, often supported by defensive flows.
📌 Seasonal bias leans slightly bearish for EUR/AUD in October, but momentum remains fragile and can easily flip on macro catalysts.
🔹 Price Action
EUR/AUD rejected from the 1.7920–1.7950 supply zone, confirming a descending channel structure.
Price bounced from the local support around 1.7660–1.7680, with sellers still in control below the upper trendline.
RSI neutral, showing potential for continuation lower after a minor corrective pullback.
Key downside target remains at 1.7500, followed by 1.7400 extension if momentum persists.
Bullish invalidation only above 1.7930, which would confirm a breakout from the descending channel.
🔹 Trading Outlook
Main Bias: Bearish short-term, supported by technical rejection and macro weakness in the Euro.
Contrarian Risk: Slightly short retail exposure could trigger a corrective bounce before the next leg down.
Key Levels:
Resistance: 1.7800 / 1.7930
Support: 1.7600 / 1.7500 / 1.7400

EUR-AUD Local Short! Sell!
Hello,Traders!
EURAUD taps into the horizontal supply area, showing a clear bearish displacement as Smart Money seeks to rebalance inefficiency. A retest of the zone is expected before continuation lower. Time Frame 3H.
Sell!
Comment and subscribe to help us grow!
Check out other forecasts below too!
Disclosure: I am part of Trade Nation's Influencer program and receive a monthly fee for using their TradingView charts in my analysis.

AUDUSD FREE SIGNAL|SHORT|
✅AUDUSD reacts strongly from the supply level, rejecting premium structure and confirming bearish order flow continuation. Price aims for the 0.6600 liquidity pool with confluence from previous imbalance.
—————————
Entry: 0.6620
Stop Loss: 0.6628
Take Profit: 0.6600
Time Frame: 1H
Setup Risk: High
—————————
SHORT🔥
✅Like and subscribe to never miss a new idea!✅

ETHEREUM BULLISH BREAKOUT|LONG|
✅ETHUSD shows a clean breakout above the key level as ICT traders anticipate continuation toward the next liquidity pool near 4,760$. Price may retest the breakout zone before pushing higher. Time Frame 2H.Setup Risk: High!
LONG🚀
✅Like and subscribe to never miss a new idea!✅

SILVER Bullish Continuation! Buy!
Hello,Traders!
SILVER holds above the horizontal demand level, showing bullish intent as Smart Money defends premium reaccumulation zones. Expect a move toward 4,885$ to rebalance inefficiency and collect buy-side liquidity. Time Frame 1H.
Buy!
Comment and subscribe to help us grow!
Check out other forecasts below too!
Disclosure: I am part of Trade Nation's Influencer program and receive a monthly fee for using their TradingView charts in my analysis.

EURJPY STRONG GAP UP|LONG|
✅EURJPY gapped up, broke above the structure, and is now retesting the demand area. A rebound here could send price back toward the 176.400¥ target as liquidity above recent highs gets cleared. Time Frame 2H.
LONG🚀
✅Like and subscribe to never miss a new idea!✅

BITCOIN Bullish Bias! Buy!
Hello,Traders!
BITCOIN is testing the upper boundary of a key order cluster, hinting at possible bullish expansion. A confirmed break above could open the way for continuation toward the 126,000$ target zone. Time Frame 8H.
Buy!
Comment and subscribe to help us grow!
Check out other forecasts below too!
Disclosure: I am part of Trade Nation's Influencer program and receive a monthly fee for using their TradingView charts in my analysis.

GBPNZD: Bullish Continuation is Expected! Here is Why:
Our strategy, polished by years of trial and error has helped us identify what seems to be a great trading opportunity and we are here to share it with you as the time is ripe for us to buy GBPNZD.
Disclosure: I am part of Trade Nation's Influencer program and receive a monthly fee for using their TradingView charts in my analysis.
❤️ Please, support our work with like & comment! ❤️
GBPAUD: Great Trading Opportunity
GBPAUD
- Classic bullish formation
- Our team expects growth
SUGGESTED TRADE:
Swing Trade
Buy GBPAUD
Entry Level - 2.0337
Sl - 2.0322
Tp - 2.0370
Our Risk - 1%
Start protection of your profits from lower levels
Disclosure: I am part of Trade Nation's Influencer program and receive a monthly fee for using their TradingView charts in my analysis.
❤️ Please, support our work with like & comment! ❤️
