EURCHF: Short Trading Opportunity
EURCHF
- Classic bearish formation
- Our team expects fall
SUGGESTED TRADE:
Swing Trade
Sell EURCHF
Entry Level - 0.9425
Sl - 0.9429
Tp - 0.9417
Our Risk - 1%
Start protection of your profits from lower levels
Disclosure: I am part of Trade Nation's Influencer program and receive a monthly fee for using their TradingView charts in my analysis.
❤️ Please, support our work with like & comment! ❤️
Smartmoney

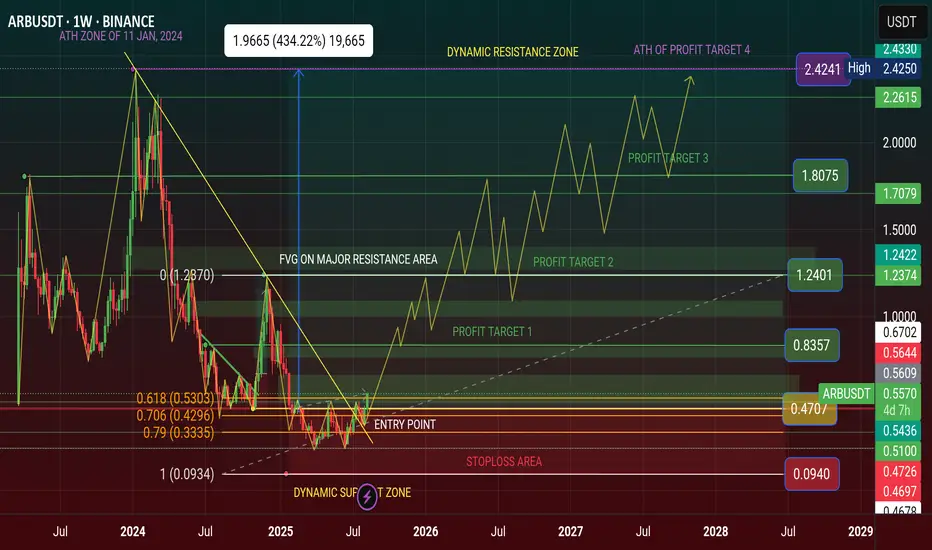
$ARB Finally Breakout $0.50 and going to +$1 This August 2025✨ AMEX:ARB Finally Breakout $0.50 and it's going to Rocket +$1 This August 2025 and +$2 in 2026
I was Share my Prediction on TradingView and Binance Square. Lastly, i was telling the ARB price is Showing a Bullish Reversal Pattern and this is Last hope in Bottom Price of Dynamic Support Level Area.
Now Price is showing Bullish Reversal of Double Bottom Pattern in Weekly Chart. Price Breakout The Neckline. My Premium Followers was Entered Long Trade or Buy Spot Trade of ARB Coin. They are now profitable in their ARB Coin investment.
🚦From News: Arbitrum (ARB) To Soar Further? Key Harmonic Pattern Signals Potential Upside Move
The cryptocurrency market is in bullish mode as Ethereum (ETH) broke above the $4,200 level for the first time since 2021. This surge has sparked a broad rally, with major altcoins including Arbitrum (ARB) riding the wave higher. ARB has posted an impressive 20% weekly gain, but more importantly, its price chart is now flashing a harmonic pattern that may reveal its next move.
Harmonic Pattern Hints at Potential Bounce
On the daily timeframe, ARB is shaping up a Bearish ABCD harmonic pattern — a formation that, despite its “bearish” name, often includes a bullish CD leg before the price reaches its Potential Reversal Zone (PRZ).
The structure began with a strong rally from point A around $0.3237 to point B near $0.5090, followed by a retracement to point C at $0.3702, where buyers stepped back in. Since then, ARB has rebounded and is now trading around $0.4680, signaling that the CD leg is firmly underway.
Harmonic projections suggest the CD leg could extend toward the 1.236 Fibonacci extension of the BC leg, putting the PRZ around $0.5456. If achieved, this would mark an approximate 18% upside from current levels.
What’s Next for ARB?
Momentum remains tilted toward the bulls. A sustained push toward $0.5456 would complete the ABCD pattern, but that zone could also act as significant resistance, prompting some traders to secure profits.
On the downside, ARB must hold above its 25-day moving average, currently near $0.4315. A breakdown below this level could weaken the bullish case and potentially lead to a deeper consolidation phase.
#Highlights #everyone #BinanceSquareFamily #Binance #ARB #SUBROOFFICIAL
Disclaimer: This article is for informational purposes only and does not constitute financial advice. Always conduct your own research before making any investment decisions. Digital asset prices are subject to high market risk and price volatility. The value of your investment may go down or up, and you may not get back the amount invested. You are solely responsible for your investment decisions and Binance is not available for any losses you may incur. Past performance is not a reliable predictor of future performance. You should only invest in products you are familiar with and where you understand the risks. You should carefully consider your investment experience, financial situation, investment objectives and risk tolerance and consult an independent financial adviser prior to making any investment.
AUD_CHF GROWTH AHEAD|LONG|
✅AUD_CHF is consolidating
Above the horizontal support
Level of 0.5255 and we are
Already seeing a bullish
Reaction so we will be expecting
A further bullish move up
LONG🚀
✅Like and subscribe to never miss a new idea!✅

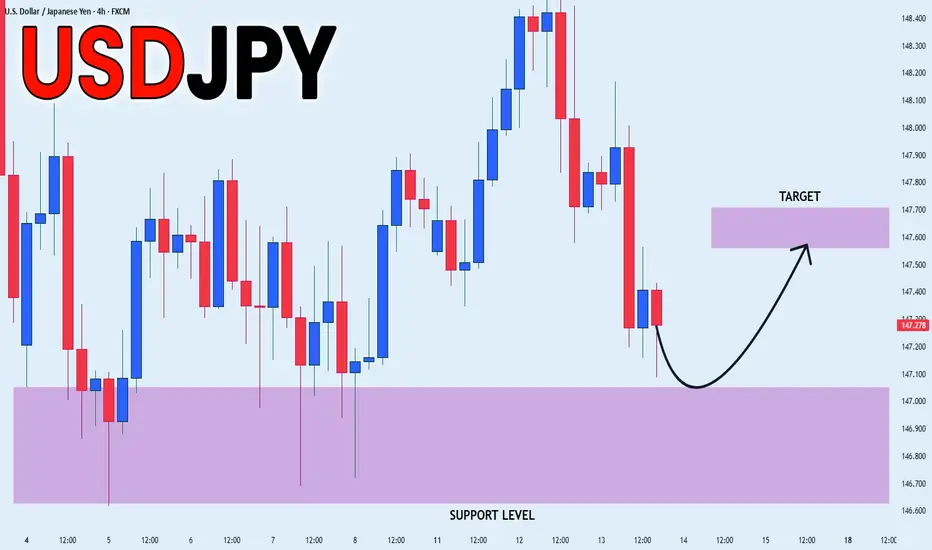
USD_JPY SUPPORT AHEAD|LONG|
✅USD_JPY is set to retest a
Strong support level below at 146.800
After trading in a local downtrend for some time
Which makes a bullish rebound a likely scenario
With the target being a local resistance above at 147.600
LONG🚀
✅Like and subscribe to never miss a new idea!✅
NATGAS Swing Short! Sell!
Hello,Traders!
NATGAS made a bearish
Breakout of the key horizontal
Level of 2.895$ while trading
In a downtrend so we are
Bearish biased and we will
Be expecting a further
Bearish continuation
Sell!
Comment and subscribe to help us grow!
Check out other forecasts below too!
Disclosure: I am part of Trade Nation's Influencer program and receive a monthly fee for using their TradingView charts in my analysis.

EUR-JPY Bullish Bias! Buy!
Hello,Traders!
EUR-JPY is trading in an
Uptrend and the pair is
Making a retest of the
Horizontal support level
Of 172.300 and we are
Bullish biased and we will
Be expecting a further
Bullish move up
Buy!
Comment and subscribe to help us grow!
Check out other forecasts below too!
Disclosure: I am part of Trade Nation's Influencer program and receive a monthly fee for using their TradingView charts in my analysis.

USDCHF: Market of Buyers
Our strategy, polished by years of trial and error has helped us identify what seems to be a great trading opportunity and we are here to share it with you as the time is ripe for us to buy USDCHF.
Disclosure: I am part of Trade Nation's Influencer program and receive a monthly fee for using their TradingView charts in my analysis.
❤️ Please, support our work with like & comment! ❤️

GOLD: Short Trade Explained
GOLD
- Classic bearish formation
- Our team expects pullback
SUGGESTED TRADE:
Swing Trade
Short GOLD
Entry - 3365.8
Sl - 3371.4
Tp - 3354.5
Our Risk - 1%
Start protection of your profits from lower levels
Disclosure: I am part of Trade Nation's Influencer program and receive a monthly fee for using their TradingView charts in my analysis.
❤️ Please, support our work with like & comment! ❤️

GBPUSDate:
August 13, 2025
Session:
Sydney and Tokyo Session
Pair:
GBPUSD
Bias:
Short
A lot of unswept liquid from last week lies.
I think price will be sweeping it this week.
Entry:1.35051
Stop Loss:1.35355
Target:1.34043
RR:3.35

US100 Bullish Breakout! Buy!
Hello,Traders!
US100 is trading in a
Strong uptrend and the
Index made a strong bullish
Breakout of the key horizontal
Level of 23,720 which is now
A support and the breakout
Is confirmed so we are
Bullish biased and we will
Be expecting a further
Bullish continuation
Buy!
Comment and subscribe to help us grow!
Check out other forecasts below too!
Disclosure: I am part of Trade Nation's Influencer program and receive a monthly fee for using their TradingView charts in my analysis.

Ethereum (ETH/USD) – Elliott Wave AnalysisThe current price structure suggests that Ethereum is completing the final stages of a 5-wave impulsive advance, with the market now positioned in wave 5 of 5. Price action has reached the upper boundary of the ascending channel, coinciding with a key Fibonacci projection zone (green resistance area), which aligns with typical wave 5 termination points.
Given this confluence, the probability of a medium-to-long-term top forming here is elevated. Once wave 5 completes, a corrective phase is expected, potentially retracing towards the midline or lower boundary of the channel. The projected path (blue arrows) anticipates a significant decline, consistent with the completion of a full impulsive cycle.
Key Points:
• Structure: Impulse wave (5 of 5) nearing completion
• Confluence: Channel resistance + Fibonacci projection zone
• Outlook: High probability of reversal and corrective decline
• Targets: First support near $3,650, with deeper retracements possible toward $3,000–$2,800 if bearish momentum accelerates
This suggests caution for late long entries, as risk/reward now favors a corrective move.

NATGAS BEARISH BREAKOUT|SHORT|
✅NATGAS is going down currently
As the price broke the key structure level of 2.90$
Which is now a resistance, and after the pullback
And retest, I think the price will go further down
SHORT🔥
✅Like and subscribe to never miss a new idea!✅

SILVER Will Grow! Buy!
Hello,Traders!
SILVER made a retest
Of the horizontal support
Of 37.58$ and we are already
Seeing a bullish rebound
So we will be expecting
A further bullish continuation
Buy!
Comment and subscribe to help us grow!
Check out other forecasts below too!
Disclosure: I am part of Trade Nation's Influencer program and receive a monthly fee for using their TradingView charts in my analysis.

GBP_CAD RESISTANCE AHEAD|SHORT|
✅GBP_CAD has been growing recently
And the pair seems locally overbought
So as the pair is approaching a horizontal resistance of 1.8640
Price decline is to be expected
SHORT🔥
✅Like and subscribe to never miss a new idea!✅

EUR-CAD Resistance Ahead! Sell!
Hello,Traders!
EUR-CAD keeps going up
But the pair will retest a
Horizontal resistance
Of 1.6124 and from there
A local bearish correction
Is to be expected
Sell!
Comment and subscribe to help us grow!
Check out other forecasts below too!
Disclosure: I am part of Trade Nation's Influencer program and receive a monthly fee for using their TradingView charts in my analysis.

AUD_USD LOCAL SHORT|
✅AUD_USD has retested a key resistance level 0.6540
And as the pair is already making a bearish pullback
A move down to retest the demand level below at 0.6520 is likely
SHORT🔥
✅Like and subscribe to never miss a new idea!✅
