GBPUSD LOCAL LONG|
✅GBPUSD Smart money trapped liquidity below demand with a fakeout, before shifting orderflow bullish. ICT concepts show price now seeks external liquidity higher. Time Frame 4H.
LONG🚀
✅Like and subscribe to never miss a new idea!✅
Smartmoneyconcept

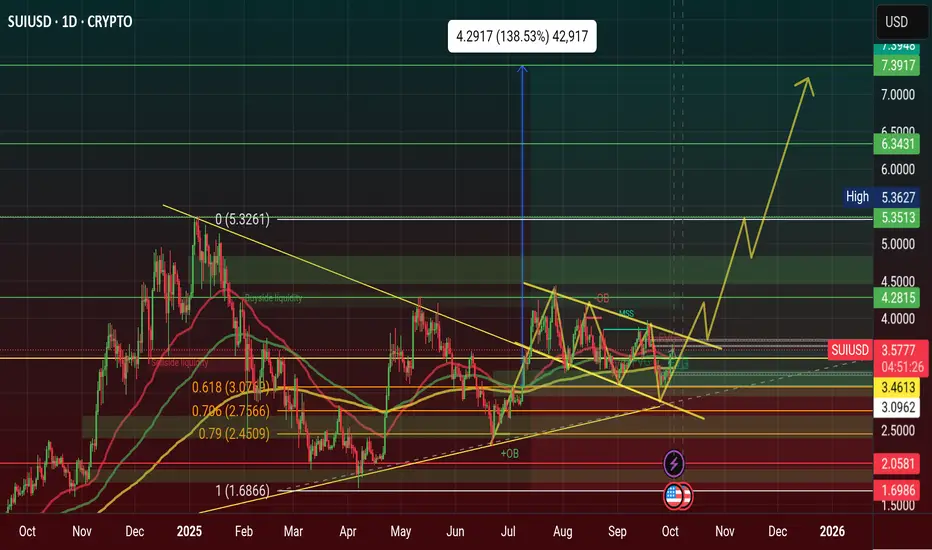
$SUI Showing a Bullish Flag Pattern Day Chart $7 Soon 2026CRYPTOCAP:SUI Showing a Bullish Flag Pattern Day Chart $7 Soon 2026
CRYPTOCAP:SUI was Showing a Reversal Pattern and now Reverse the Price. 3 Weekly showing a Bullish Flag Pattern in Day Chart. It's a Continuation Pattern. It's going to Upward Movement on Directly.
CRYPTOCAP:SUI Strong Support $2, Open position $3 and Strong Resistance $5, Never forget Target $7 and $11 in 2026
#Write2Earn #BinanceSquareFamily #Binance #SUI #SUBROOFFICIAL
Disclaimer: This article is for informational purposes only and does not constitute financial advice. Always conduct your own research before making any investment decisions. Digital asset prices are subject to high market risk and price volatility. The value of your investment may go down or up, and you may not get back the amount invested. You are solely responsible for your investment decisions and Binance is not available for any losses you may incur. Past performance is not a reliable predictor of future performance. You should only invest in products you are familiar with and where you understand the risks. You should carefully consider your investment experience, financial situation, investment objectives and risk tolerance and consult an independent financial adviser prior to making any investment.
USOIL WILL GO DOWN|SHORT|
✅WTI OIL Price rejects supply after distribution and forms bearish orderflow, ICT suggests liquidity is being targeted below. Market likely seeks drawdown into 60.00 demand imbalance. Time Frame 4H.
SHORT🔥
✅Like and subscribe to never miss a new idea!✅

GOLD Strong Supply Zone 3900$! Sell!
Hello,Traders!
GOLD SMC expects a rejection from the $3,900 strong supply zone. Smart Money confirms short positioning as price hunts inefficiencies, with liquidity pools sitting below.
Time Frame: 1H
Sell!
Comment and subscribe to help us grow!
Check out other forecasts below too!
Disclosure: I am part of Trade Nation's Influencer program and receive a monthly fee for using their TradingView charts in my analysis.

GOLD FREE SIGNAL|SHORT|
✅XAUUSD Price pushes back into supply as ICT logic signals distribution near highs. Liquidity sits above the prior top, and a retest of all-time high levels could provide engineered exit points.
—————————
Entry: 3,887$
Stop Loss: 3,896$
Take Profit: 3,876$
Time Frame: 1H
—————————
SHORT🔥
✅Like and subscribe to never miss a new idea!✅

NZD-CAD Free Signal! Buy!
Hello,Traders!
NZDCAD taps into demand and holds structure, with Smart Money accumulation pointing to higher pricing. Imbalance fills hint at continuation toward premium levels.
-------------------
Stop Loss: 0.8105
Take Profit: 0.8158
Entry: 0.8136
Time Frame: 3H
-------------------
Buy!
Comment and subscribe to help us grow!
Check out other forecasts below too!
Disclosure: I am part of Trade Nation's Influencer program and receive a monthly fee for using their TradingView charts in my analysis.

CHF-JPY Short From Supply Ahead! Sell!
Hello,Traders!
CHFJPY is about to retest the horizontal supply area, where Smart Money seeks to mitigate orders. A rejection from this zone signals distribution, with price likely to rebalance inefficiency toward 184.95. Time Frame 3H.
Sell!
Comment and subscribe to help us grow!
Check out other forecasts below too!
Disclosure: I am part of Trade Nation's Influencer program and receive a monthly fee for using their TradingView charts in my analysis.

$BTC SURPRISED $123K PROFIT DONE ($111K-$122K)CRYPTOCAP:BTC SURPRISED STEP BY STEP
$111K $115K $122K
2026 WILL MORE SURPRISED 2028 OF FUTURE
$122K $133K $144K $155K $166K $177K $188K $199K $211K
Bitcoin (BTC) to Hit Standard Chartered Predicts
At press time, it is trading within striking distance of a neW record high at $123,646.
The cryptocurrency's current record high of $124,517 was logged on Aug. 14 on Bitsamp. tandard Chartered believes that a prolonged shutdown will be bullish for Bitcoin. Kendrick has noted that Bitcoin has a positive correlation with U.S.
Treasury term premiums, which represent the extra yield that comes with holding longer-term bonds. They are currently on the rise due to significant uncertainty caused by the U.S. government shutdown.
Polymarket odds
According to Polymarket bettors, Bitcoin currently has a 7% chance of surpassing $200,000. At the same time, the odds of Bitcoin surpassing $135,000 as early as this October currently stand at 32%.
Meanwhile, there is also a 5% chance of Bitcoin dropping back below $100,000 this October.
#Write2Earn #BinanceSquareFamily #Binance #BTC☀ #SUBROOFFICIAL
Disclaimer: This article is for informational purposes only and does not constitute financial advice. Always conduct your own research before making any investment decisions. Digital asset prices are subject to high market risk and price volatility. The value of your investment may go down or up, and you may not get back the amount invested. You are solely responsible for your investment decisions and Binance is not available for any losses you may incur. Past performance is not a reliable predictor of future performance. You should only invest in products you are familiar with and where you understand the risks. You should carefully consider your investment experience, financial situation, investment objectives and risk tolerance and consult an independent financial adviser prior to making any investment.

$BNB SURPRISED $1,111 INCREDIBLE PRICE DONE ($999-$1,111)CRYPTOCAP:BNB SURPRISED $1,111 INCREDIBLE PRICE DONE ($999-$1,111)
Previous Incredible Price 2025
$777 $888 $999 $1,111
Future Incredible Price 2028
$2,222 $3,333 $4,444
#Write2Earn #BinanceSquareFamily #Binance #BNB #SUBROOFFICIAL
Disclaimer: This article is for informational purposes only and does not constitute financial advice. Always conduct your own research before making any investment decisions. Digital asset prices are subject to high market risk and price volatility. The value of your investment may go down or up, and you may not get back the amount invested. You are solely responsible for your investment decisions and Binance is not available for any losses you may incur. Past performance is not a reliable predictor of future performance. You should only invest in products you are familiar with and where you understand the risks. You should carefully consider your investment experience, financial situation, investment objectives and risk tolerance and consult an independent financial adviser prior to making any investment.

GOLD PULLBACK AHEAD|SHORT|
✅XAUUSD rejects the wide supply zone, showing bearish order flow as price seeks a liquidity draw lower. The move aligns with ICT principles, targeting inefficiency cleanup around 3,844$. Time Frame 1H.
SHORT🔥
✅Like and subscribe to never miss a new idea!✅

SILVER Local Short! Sell!
Hello,Traders!
SILVER is about to reject the horizontal supply zone after liquidity sweep, confirming Smart Money distribution. Price is set to rebalance inefficiency with target aligned near $4,690. Time Frame 3H.
Sell!
Comment and subscribe to help us grow!
Check out other forecasts below too!
Disclosure: I am part of Trade Nation's Influencer program and receive a monthly fee for using their TradingView charts in my analysis.

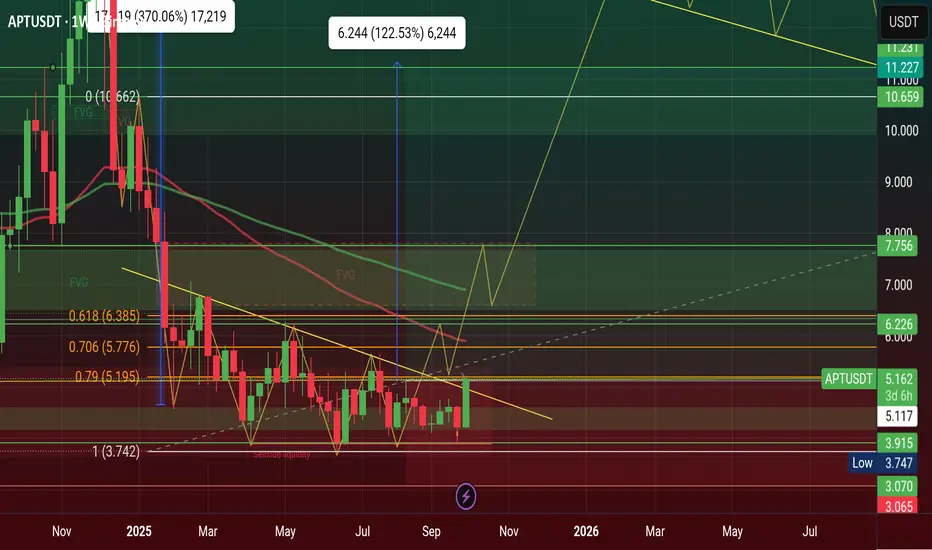
$APT Surprised $5.11 Today & Breakout Confirmed AMEX:APT Surprised $5.11 Today & Breakout Confirmed, price will Drive $11 on this 4th Quarter of 2025
Here’s Why Aptos (APT) Price Is Up Today
Aptos price is having a strong day, up more than 10% and now trading around $5.06, with trading volume climbing by 16%. The move comes after a series of bullish developments that have given traders plenty to get excited about.
One of the main reasons behind the surge is Aptos’ new partnership with World Liberty Financial (WLFI). Together, they’re bringing the USD1 stablecoin onto the Aptos blockchain, with the launch expected by October 6.
USD1 is already the fifth-largest stablecoin with a market cap of about $2.7 billion, and its arrival on Aptos is seen as a major liquidity boost. Stablecoins usually drive more DeFi activity, and APT’s price jump from $3.92 to $4.86 right after the news shows just how much optimism this created.
What the APT Chart Is Showing
Looking at the 4-hour chart, Aptos price has broken out of a downtrend that kept it under pressure for weeks. The price pushed up from the $4.20 support zone and is now testing resistance just above $5. The rally marks the strongest momentum since early July.
The RSI is approaching 70, showing strong buying strength but not yet at extreme overbought levels. The MACD is firmly green, and the widening histogram signals fresh momentum on the upside.
Open interest is holding near 8.97 million, while net shorts are dropping, a sign that sellers are closing out positions. Net longs remain steady, suggesting this move is being powered more by new inflows than leveraged bets.
If Aptos price can maintain its position above the $5 level, the next significant test will be around $5.40 to $5.60, which corresponds to the last local high. On the other hand, if the rally cools, $4.60 is the first support zone to watch.
APT Price Short-Term Outlook
Aptos looks strong going into October. The combination of fresh liquidity from the stablecoin launch and a new institutional product gives it both hype and substance.
If the bullish momentum continues, a push toward $5.60 seems realistic in the short term, with room for a run toward $6.20 later this month.
Of course, holding above $5 is key. As long as Aptos price defends that level, the trend favors the bulls. Right now, the market seems to agree that Aptos has found fresh energy at just the right time.
#Write2Earn #BinanceSquareFamily #Binance #BTC☀ #SUBROOFFICIAL
Disclaimer: This article is for informational purposes only and does not constitute financial advice. Always conduct your own research before making any investment decisions. Digital asset prices are subject to high market risk and price volatility. The value of your investment may go down or up, and you may not get back the amount invested. You are solely responsible for your investment decisions and Binance is not available for any losses you may incur. Past performance is not a reliable predictor of future performance. You should only invest in products you are familiar with and where you understand the risks. You should carefully consider your investment experience, financial situation, investment objectives and risk tolerance and consult an independent financial adviser prior to making any investment.
DAX Bearish Bias! Sell!
Hello,Traders!
DAX taps into horizontal supply where Smart Money distributes orders. The rejection signals bearish flow, with liquidity likely drawn toward inefficiency near 24,300 zone. Time Frame 3H.
Sell!
Comment and subscribe to help us grow!
Check out other forecasts below too!
Disclosure: I am part of Trade Nation's Influencer program and receive a monthly fee for using their TradingView charts in my analysis.

EURUSD FREE SIGNAL|SHORT|
✅EURUSD formed a triple top near premium structure, signaling exhaustion. Break below neckline confirms bearish intent, with liquidity draw targeting imbalance around 1.1670 zone. Time Frame: 3H.
—————————
Entry: 1.1720
Stop Loss: 1.1755
Take Profit: 1.1670
Time Frame: 3H
Risk: High
—————————
SHORT🔥
✅Like and subscribe to never miss a new idea!✅

ETHEREUM LOCAL SHORT|
✅ETHUSD rejected a premium supply level, showing displacement after inefficiency fill. Order flow signals bearish intent, with liquidity below 4,320$ likely targeted for rebalancing. Time Frame 8H.
SHORT🔥
✅Like and subscribe to never miss a new idea!✅

GBP-NZD Free Signal! Sell!
Hello,Traders!
GBPNZD rejected a premium supply zone after liquidity sweep, confirming smart money distribution. Price aims to rebalance inefficiency below, with sell-side liquidity at 2.3074 in focus.
-------------------
Stop Loss: 2.3152
Take Profit: 2.3074
Entry: 2.3120
Time Frame: 3H
-------------------
Sell!
Comment and subscribe to help us grow!
Check out other forecasts below too!
Disclosure: I am part of Trade Nation's Influencer program and receive a monthly fee for using their TradingView charts in my analysis.

GER40 Critical Level: Which Way Will It Break?📊 GER40 Critical Breakout Analysis
Hello Guys,
By popular demand, I’ve prepared a GER40 analysis. Every single follower matters to me, and that’s why I’m sharing this breakdown with you.
🔹 Buy scenario: Price needs to break above 23,895 and close a candle there.
🔹 Sell scenario: Price needs to drop below 23,278 and close a candle under it.
I’ll be watching both levels closely. Once a breakout happens, I’ll update you right away.
Every like is my biggest motivation to keep sharing these analyses.
Thanks to everyone supporting me!

USOIL STRONG DEMAND AREA|LONG|
✅WTI OIL price reacts at demand level, showing signs of absorption with liquidity grabs. ICT model points to bullish orderflow aiming for the nearby target zone. Time Frame: 4H.
LONG🚀
✅Like and subscribe to never miss a new idea!✅

CRUDE OIL Free Signal! Buy!
Hello,Traders!
CRUDE OIL taps into a horizontal demand area, showing strong bullish reaction. Liquidity beneath recent lows is swept, signalling smart money positioning for upside continuation.
-------------------
Stop Loss: 61.35$
Take Profit: 62.87$
Entry: 61.94$
Time Frame: 8H
-------------------
Buy!
Comment and subscribe to help us grow!
Check out other forecasts below too!
Disclosure: I am part of Trade Nation's Influencer program and receive a monthly fee for using their TradingView charts in my analysis.

SPY MONEY PRINTER GO BRRR|LONG|
✅SPY with the FED lowering rates, liquidity injections perspective fuel risk assets. Price has broken out above the key level, signaling bullish order flow. SMC outlook suggests momentum could push into new all-time highs as money printer effects unfold. Time Frame 1H.
LONG🚀
✅Like and subscribe to never miss a new idea!✅

BITCOIN Strong Rejection! Sell!
Hello,Traders!
BITCOIN After a sharp push into the horizontal supply area, price printed a fakeout and rejected liquidity above. SMC outlook suggests downside continuation toward intraday inefficiency fills. Time Frame 2H.
Sell!
Comment and subscribe to help us grow!
Check out other forecasts below too!
Disclosure: I am part of Trade Nation's Influencer program and receive a monthly fee for using their TradingView charts in my analysis.

NZDCAD FREE SIGNAL|SHORT|
✅NZDCAD Price has tapped into the supply level after a corrective push, rejecting inefficiency and signaling continuation lower. ICT perspective suggests targeting liquidity resting below recent lows. Time Frame 4H.
—————————
Entry: 0.8115
Stop Loss: 0.8135
Take Profit: 0.8085
Time Frame: 4H
—————————
SHORT🔥
✅Like and subscribe to never miss a new idea!✅

EUR-JPY Rebound Ahead! Buy!
Hello,Traders!
EURJPY price tapped into the horizontal demand area, after a sharp decline, sweeping liquidity and rejecting imbalance. From an SMC viewpoint, we anticipate a relief rally toward the marked target level. Time Frame 5H.
Buy!
Comment and subscribe to help us grow!
Check out other forecasts below too!
Disclosure: I am part of Trade Nation's Influencer program and receive a monthly fee for using their TradingView charts in my analysis.
