SMH Bullish Structure Confirmed — Pullback Strategy Active!🎯 SMH Semiconductor Heist: The $400 Target Caper 💰🚀
📊 Asset Overview
VanEck Semiconductor ETF (SMH) - NASDAQ Listed
Trade Type: Swing Trade (Bullish Setup)
Strategy Style: "The Thief Method" - Layered Entry Approach 🏴☠️
🔍 Technical Analysis Breakdown
📈 Bullish Confirmation Signals
✅ Supertrend ATR Indicator: Bullish pullback confirmed
✅ HULL Moving Average: Clean retest and bounce pattern detected
✅ Market Structure: Higher lows forming with momentum building
The setup is cooking like a perfectly timed bank job - all the technical stars are aligning! 🌟
💼 The "Thief Strategy" Game Plan
🎯 Entry Strategy (Layered Limit Orders)
Multiple Buy Limit Layers:
🥇 Layer 1: $340.00
🥈 Layer 2: $345.00
🥉 Layer 3: $350.00
💎 Layer 4: $355.00
Note: You can add more layers based on your position size and risk appetite! This "scaling-in" approach reduces timing risk and averages your entry price. Think of it as sending multiple agents into the vault instead of going all-in at once! 🕵️♂️
🛑 Risk Management
⚠️ Stop Loss Zone
Thief's Emergency Exit: $335.00
Disclaimer: This is MY stop loss level based on technical invalidation. You're the captain of your own ship! 🚢 Set YOUR stop loss based on YOUR risk tolerance and account size. Risk management is personal - what works for a $10K account differs from a $100K account!
🎯 Profit Target
💰 Take Profit Zone
Primary Target: $400.00
Reasoning:
🚧 Major resistance confluence zone ("Police Barricade" level)
📊 Historical supply zone where sellers previously appeared
⚠️ Potential overbought conditions expected at this level
🪤 Bull trap risk increases as retail FOMO kicks in
Disclaimer: This is MY target based on technical analysis. YOU make the final call! Scale out partially at psychological levels ($375, $385, $390) if you prefer to lock profits along the way. Remember: "Pigs get fed, hogs get slaughtered!" 🐷
🔗 Related Pairs to Watch (Correlation Analysis)
📱 Individual Semiconductor Stocks:
NASDAQ:NVDA (NVIDIA) - AI chip leader, ~10% weight in SMH
NASDAQ:AMD (Advanced Micro Devices) - Strong correlation with SMH
NASDAQ:AVGO (Broadcom) - Networking chips, infrastructure play
NYSE:TSM (Taiwan Semiconductor) - Foundry leader, bellwether for sector
NASDAQ:INTC (Intel) - Legacy chips, inverse correlation at times
NASDAQ:QCOM (Qualcomm) - Mobile chips, 5G exposure
NASDAQ:ASML (ASML Holding) - Chip equipment, leading indicator
📊 Broader Market ETFs:
NASDAQ:QQQ (Nasdaq-100) - Tech-heavy index with high SMH correlation
AMEX:SPY (S&P 500) - Overall market sentiment gauge
NASDAQ:SOXX (iShares Semiconductor ETF) - Direct competitor/confirmation
AMEX:XLK (Tech Sector SPDR) - Broader tech exposure
Key Correlation Points:
🔸 SMH typically moves with NVDA and AMD momentum
🔸 Watch NYSE:TSM for Asian market sentiment on chips
🔸 Rising NASDAQ:QQQ usually lifts all semiconductor boats
🔸 NASDAQ:SOXX divergence from SMH can signal sector rotation
🌍 Fundamental & Economic Factors
📰 Macro Catalysts to Monitor:
💡 Positive Factors (Bullish):
🤖 AI Boom Continuation: ChatGPT, autonomous vehicles, data centers = insatiable chip demand
🏭 CHIPS Act Funding: US government subsidies for domestic semiconductor production
📱 5G Rollout: Global infrastructure upgrades driving chip sales
🎮 Gaming & Crypto: GPU demand remains elevated
📈 Inventory Restocking Cycle: Post-2023 correction, supply chains normalizing
⚠️ Risk Factors (Watch Closely):
🇨🇳 China-Taiwan Tensions: Geopolitical risk (TSM produces ~90% of advanced chips)
💵 Fed Interest Rate Policy: Higher rates = lower tech valuations
📉 Economic Slowdown Fears: Recession = reduced corporate IT spending
🚫 Export Restrictions: US-China chip technology trade wars
📊 Inventory Glut Risk: Oversupply if demand weakens suddenly
📅 Key Events to Track:
Quarterly earnings from NVDA, AMD, TSM (guidance is crucial!)
Federal Reserve rate decisions (tech is rate-sensitive)
US-China trade negotiations
Monthly semiconductor sales reports (SIA data)
🎭 The Thief's Philosophy
This isn't your grandpa's "buy and hold" strategy - this is active swing trading with style! 😎 We identify the setup, execute with layers, manage risk like professionals, and exit before the party turns ugly. No emotional attachment, no hopium - just cold, calculated profit extraction! 🧊💰
Remember:
✨ The market doesn't care about your mortgage payment
✨ Technical setups fail sometimes - that's why we use stops
✨ Taking profits is NOT a crime (despite the "Thief" branding! 😂)
✨ Live to trade another day > revenge trading losses
✨ If you find value in my analysis, a 👍 and 🚀 boost is much appreciated — it helps me share more setups with the community!
🏴☠️ Happy Trading, Fellow Thieves! May your stops never get hit and your targets always fill! 💎🙌
SMH
$QCOM Delayed News RallyOverview of the Qualcomm News Rally
On October 27th, Qualcomm Technologies, Inc. announced the launch of its next-generation AI inference-optimized solutions for data centers. These new products, the Qualcomm® AI200 and AI250 chip-based accelerator cards and racks, are built on the company’s NPU technology leadership. They deliver rack-scale performance and superior memory capacity, enabling fast AI inference with exceptional performance per dollar per watt. This marks a significant advancement for scalable, efficient, and flexible generative AI across various industries.
Market Reaction and Stock Performance
Following the announcement, trading volume on October 27th surged—possibly reaching the highest levels ever recorded for the stock. Qualcomm’s share price responded positively, gaining approximately 22% and ultimately closing up just over 11% for the day. However, after this initial rally, profit-taking led to a selloff, and the stock reached a closing low on November 20th.
Trading Strategy and Position Management
After observing the market reaction to the news, I chose not to pursue the upward price movement immediately. Instead, I patiently waited for a pullback, which turned out to be deeper than anticipated. Over the following weeks, I identified the downtrend and drew a trend line. When the stock price broke above this downtrend line, I entered a half-size position, setting a stop just below the day’s low. The stock climbed swiftly, then retreated to test the 50-day moving average (red), where it formed what I interpreted as a reversal candle yesterday. This morning, the reversal appeared confirmed, suggesting the potential for a continued uptrend. With this confirmation, I increased my holdings to a full-size position, placing a stop for the added shares just below today’s low.
Disclaimer and Investment Considerations
Readers are strongly encouraged to conduct their own analysis and follow their individual trading strategies. It is important to recognize that all investments involve inherent risk. Thoughtful and informed decision-making is essential when allocating capital in financial markets.

$SMH: HOLDING THE KEY FOR THE SHORT TERM MARKET DIRECTION NASDAQ:SMH : The direction of the stock market this week hinges significantly on the performance of $SMH. Please note that NVDA will release its earnings report on Wednesday.
Currently, the weekly chart for SMH looks good, as it remains within the channel established since the April low and is above its 10-week simple moving average (SMA). However, the upward momentum has stalled following the weekly shooting star pattern observed three weeks ago, suggesting we may be entering a digestion phase to address the extremely overbought RSI14.
That said, we should not discount the possibility of a topping phase if the 10-week SMA does not hold. The stakes are high, and how the market responds to NVDA's numbers on Wednesday will be crucial.

SMH target 377/to 388 focus is 381 zone I when longcallsThe SMH decline was 1.618 the net distance wave 2 to equal wave 4 we saw in the over night . We have now entered the blowoff wave in wave 5 of 5 in the form of an expanding pattern .It should see at range as high as 388 to be equal to wave 1 on a pct basis at 372 it was equal to wave 1 on a points basis but in 5th wave blowoff as we saw in gld recent and in the past the 5th tend to move up at a 1.618 the distance of wave 1 or wave 3 the top see jan 2000 .

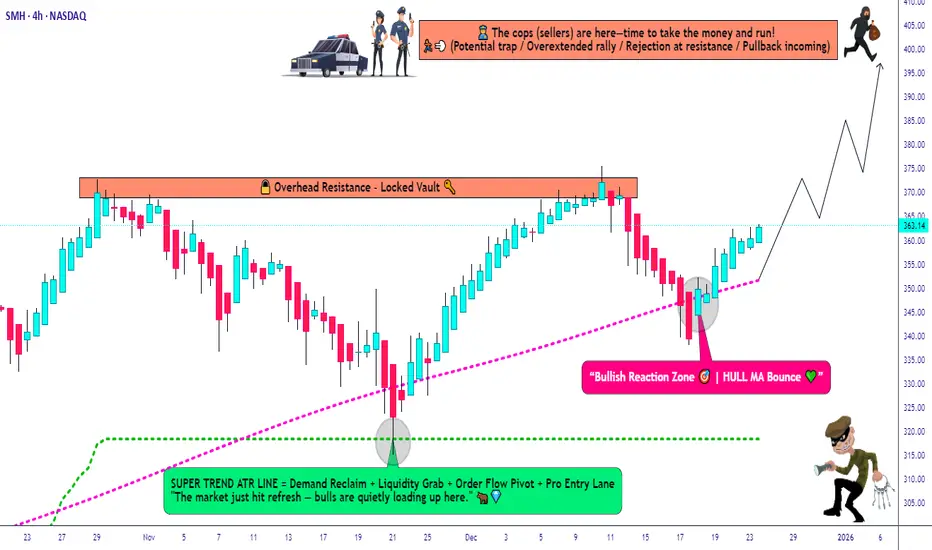
SMH ETF Power Move Incoming – ATR Confirms Bullish Momentum!🎯 SMH Semiconductor Heist: Bulls Loading Up! 💎🚀
📊 Asset Analysis
VanEck Semiconductor ETF (SMH) - The chip sector's flagship ETF is showing serious strength after bouncing off the ATR (Average True Range) support zone. Bulls are flexing their muscles, and momentum is building for an upside breakout. Time to plan your entry like a pro! 🧠💰
🔥 Trade Setup: The "Layered Thief" Entry Strategy
Bias: BULLISH 🐂
Strategy: Multi-layered limit order entries (maximize your position while managing risk)
🎯 Entry Zones (Layer Your Orders):
Deploy multiple buy limit orders across these price levels to build your position strategically:
Layer 1: $328
Layer 2: $332
Layer 3: $336
Layer 4: $340
Note: You can add more layers based on your capital allocation and risk tolerance. The goal is to average into the position as price consolidates before the breakout.
🛑 Risk Management
Stop Loss: $324
This level invalidates the bullish setup if breached. The ATR support zone should hold — if it doesn't, we're outta here!
⚠️ Risk Disclosure: This stop loss level is based on my analysis. However, YOU are the captain of your own ship! Adjust your risk parameters according to your account size and risk appetite. Trade smart, not reckless! 🧠
🎯 Target Zones
Primary Target: $364 (Take Profits Here!) 💰
Maximum Target: $368 (Resistance Zone/Overbought Alert) ⚠️
At $368, we're approaching a major resistance level where profit-taking, overbought conditions, and potential bull traps converge. It's the "police barricade" 🚨 — smart thieves know when to escape with the loot! Secure your gains before hitting this ceiling.
⚠️ Profit-Taking Disclosure: These are MY target levels based on technical analysis. Your profit targets should align with YOUR trading plan and risk-reward preferences. Take money when YOU feel comfortable — it's your capital, your rules! 💼
🔗 Correlated Assets to Watch
Keep an eye on these related tickers for confirmation and broader market context:
NASDAQ:SOXX - iShares Semiconductor ETF (direct sector peer)
NASDAQ:NVDA - NVIDIA (semiconductor heavyweight, major SMH component)
NASDAQ:AMD - Advanced Micro Devices (chip sector bellwether)
NYSE:TSM - Taiwan Semiconductor (global chip manufacturing leader)
NASDAQ:AVGO - Broadcom (diversified semiconductor play)
NASDAQ:QQQM / QQQ - Nasdaq 100 ETFs (tech sector correlation)
📈 Why it matters: SMH trades in sync with these assets. If they're showing strength, it confirms the bullish thesis. If they're weak, proceed with extra caution!
📈 Technical Confluence
✅ ATR support zone holding strong
✅ Bulls regaining control after retracement
✅ Volume accumulation at support levels
✅ Risk-reward ratio favors the bulls (SL: $324 → Target: $364 = solid R:R)
The technical stars are aligning for a bullish continuation move! 🌟
🎓 Trading Wisdom
This setup combines patience (layered entries), discipline (defined stop loss), and realistic expectations (conservative profit targets). The semiconductor sector is volatile but rewarding when you trade with a plan! 💼📊
✨ If you find value in my analysis, a 👍 and 🚀 boost is much appreciated — it helps me share more setups with the community!
⚠️ Disclaimer
This analysis represents the "Thief Style Trading Strategy" — a playful approach to technical analysis meant for educational and entertainment purposes only. This is NOT financial advice. Trading involves substantial risk of loss. Always conduct your own research, manage your risk appropriately, and never trade with money you can't afford to lose. Past performance does not guarantee future results. Trade at your own risk! 🎲
#SMH #Semiconductors #SwingTrading #DayTrading #TechnicalAnalysis #NVDA #AMD #ChipStocks #TradingSetup #StockMarket #BullishSetup #LayeredEntry #RiskManagement #TradingStrategy #VanEckETF #TechStocks #MarketAnalysis #TradingIdeas #PriceAction

Is AMD expensive? Earnings News!AMD just posted a double beat and reporting a record amount of revenue. crossing the $9billion mark.
The company expects revenue of about $9.6 billion for the next quarter, plus or minus $300 million, compared with analysts' average estimate of $9.15 billion.
AMD last month said it would supply AI chips to OpenAI in a multi-year deal that would bring in tens of billions of dollars in annual revenue and give the startup the option to buy up to roughly 10% of the chipmaker.
The deal covers the deployment of hundreds of thousands of AMD's graphics processing units (GPUs), roughly equivalent to the energy needs of 5 million U.S. households, or about thrice the amount of power produced by the Hoover Dam.
The stock still seems a bit expensive for my liking but a good solid report.

$SMH historic highs. $NVDA dominance stalled. Expect more upsideHi all, I am back after a quick 2 weeks of holiday to bring you the latest on the charts. Today we look at our favorite sector, the Semis. ETF NASDAQ:SMH is approaching the 3.618 Fib Retracement level which lies at 360 $ is within the reach. I predicted in my blog on 5th Oct that the year end target on NASDAQ:SMH is 360 $.
NASDAQ:NVDA & NASDAQ:AVGO powering higher. NASDAQ:ASML to 1000 $. NASDAQ:SMH has wings. for NASDAQ:SMH by RabishankarBiswal — TradingView
It seems that this target is reachable in the next couple of weeks, if the market volatility remains subdued and CBOE:UVXY remains below 20.
But what I am observing is that the Semiconductor index is making new highs even if the ratio $NVDA/ NASDAQ:SMH is making a short-term low. This is good for the internals within the Semiconductor sector which indicates intrasector rotation. Recently other stocks like NASDAQ:AVGO and NASDAQ:AMD have taken over the baton. The ratio $NVDA/ NASDAQ:SMH after hitting a peak of 0.62 has retreated to 0.52 indicating a 10% drop in its dominance in $SMH. If NASDAQ:NVDA must regain its dominance, then the stock must go up by 20% which will take it back to 220 $.
Verdict : Strong momentum in $SMH. 360 $ reachable in a few weeks. NASDAQ:NVDA dominace set to go higher with price upto 220 $ to 250 $.

SMH Bullish Setup – Breakout Plan for the Perfect Heist!🔥🚀 THIEF TRADER ALERT: SMH BULLISH HEIST PLAN! 🚀🔥
Asset: VANECK SEMICONDUCTOR ETF (SMH)
Plan: BULLISH BREAKOUT HEIST 🎯 (Resistance wall breakout candle close above 298.00)
🎯 THIEF ENTRY STRATEGY (LAYERING METHOD) 🎯
"Steal the dip like a PRO!" 💰🔪
Multiple Limit Orders (Layer Entry) 👇
1st Layer: 298.00 (Breakout Confirmation)
2nd Layer: 292.00 (Pullback Steal)
3rd Layer: 288.00 (Aggressive Discount)
4th Layer: 284.00 (Max Pain = Max Gain)
(Add more layers if you’re a risk-loving THIEF!)
⚠️ WARNING: DO NOT place SL or orders before breakout! (Only real THIEFS wait for confirmation!)
🛑 THIEF STOP LOSS (OG STYLE) 🛑
"Protect your loot or get wrecked!" 💣
SL @ 280.00 (Hard floor – adjust based on your risk appetite!)
Place SL ONLY AFTER breakout! (No premature stops – patience = profit!)
🎯 TARGET: 324.00 🚀 (OR ESCAPE EARLY IF MARKET TURNS)
Scalpers: Ride the waves, but stay LONG ONLY! 🌊
Swing Thieves: Hold & rob big! Use Trailing SL to lock gains! 🔐💰
📢 THIEF PRO TIPS:
✅ Set Alerts! (Don’t miss the breakout!) 🔔
✅ Watch for News! (Avoid getting caught in volatility traps!) 📉📈
✅ Boost & Support! (More boosts = more heists!) 💖🚀
🔥 FINAL MESSAGE:
"The market is a casino, and WE are the robbers! 🎰💰 Steal smart, escape rich! 🏴☠️💸"
👉 LIKE, BOOST & FOLLOW FOR MORE HEIST PLANS! 👈
🚀 NEXT HEIST COMING SOON… STAY TUNED! 🚀
#ThiefTrader #SMH #BreakoutHeist #LayerEntry #LimitOrderBandit 🎯🔥

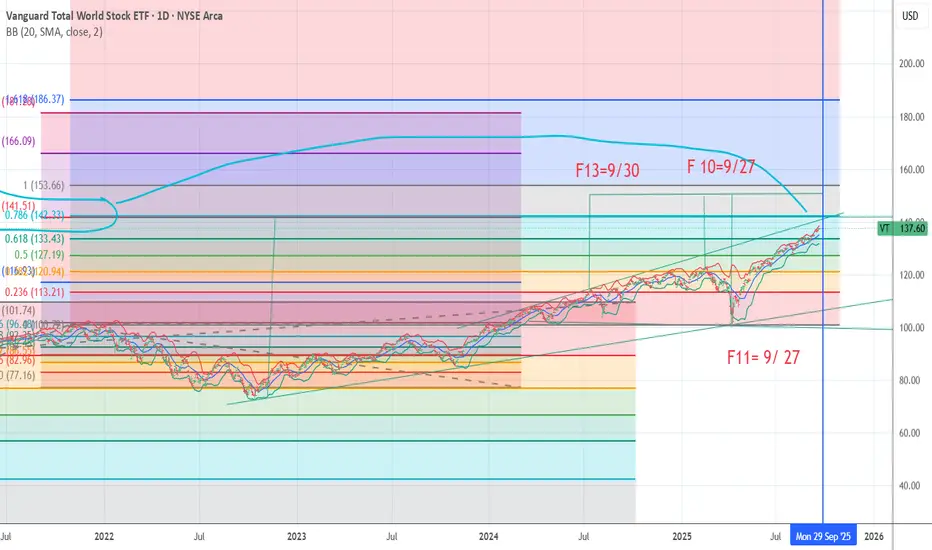
SPIRAL FOCUS POINT 9/27 PLUS OR MINUS 3 DAYS EVENT The chart posted is the next turn within the spirals as we are nearing fib projections and wave A x 1.382 in the sp 500 6648/6671 . I am very bearish again at each turn a minor top has seen a pull back But now the PUT/Call models are Bell ringing . I have covered my short from friday close this morning and based on the Holidays it will be rather thin trading . I will try to be patient and wait now to Re enter the puts best of trades Wavetimer
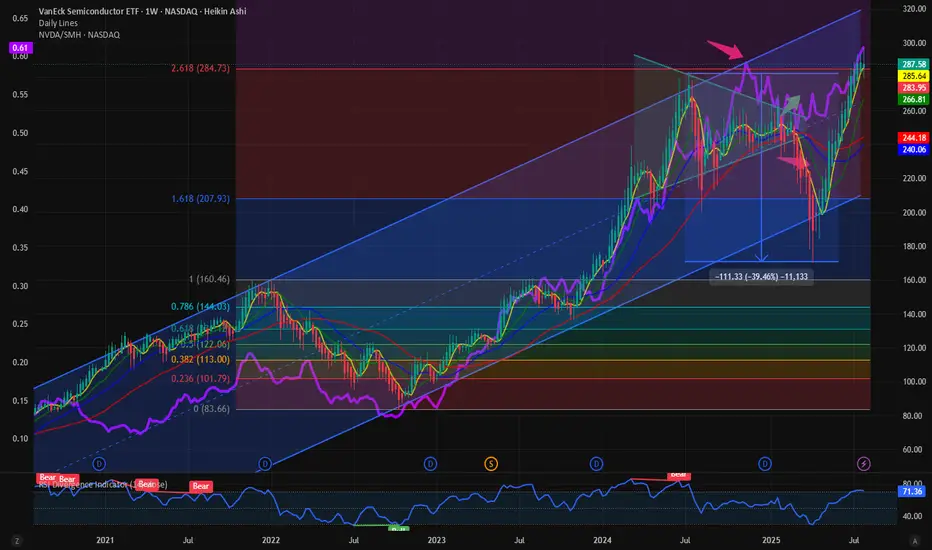
$NVDA rolling over. $SMH looks vulnerableSemis have been the toughest pillar of this bull market. The Semis ETF NYSE:SM has been making new highs and new lows with occasional consolidation. NASDAQ:NVDA has been instrumental in the dominance of NASDAQ:SMH in most of the thematic ETFS. The ratio chart $NVDA/ NASDAQ:SMH is also showing signs of weakness and rolling over hard. Last time NASDAQ:NVDA lost momentum it fell 40%. Will the history repeat? History usually rhymes. So, when we see weakness in the largest stock in SP:SPX the indices will also roll over. The momentum weakness is visible in the RSI.
If we believe that the previous highs act as support, then we can expect the stock to drop to 150 $. This aligns with the 1.0 Fib retracement level. This can mark a 17% downturn from here. The next support is around 120 $. That will mark a 33% pull back which is not unusual for $NVDA. But these price level will be great accumulation point for the stock. The consolidation in NASDAQ:SMH and NASDAQ:NVDA was predicated by me on Aug 3. But our long-term target remains intact with NASDAQ:NVDA @ 250 and NASDAQ:SMH @ 315.
Verdict: NASDAQ:NVDA and NASDAQ:SMH looks vulnerable here. Price consolidation more likely providing good entry points in $NVDA. Long term target still holds.

Stock Opportunity: LULULEMON & AVGO EARNINGSNASDAQ:LULU just reported earnings of $2.53B vs $2.54B est
They did beat on the EPS side $3.10 vs $2.85
Lululemon is now the second cheapest its ever been in its history on a PE basis. Behind the GFC crisis in 2008.
They have slashed their guidance and profit forecasts...which seem to be the final shakeout.
Lulu filled a massive weekly technical gap going back to Covid.
NASDAQ:AVGO reported earnings: Rev $15.95B vs $15.83B
EPS $1.69 vs $1.54
This institutional semiconductor stock is crushing Vol and staying flat-ish in afterhours.
We took a position in Lulu.

Opening (IRA): SMH September 19th 260 Covered Call... for a 253.21 debit.
Comments: One of the higher IV ETF's at the top of my board. Selling the -75 delta call against shares to emulate the delta metrics of a 25 delta short put, but with the built-in defense of the short call.
Metrics:
Break Even/Buying Power Effect: 253.21
Max Profit: 6.79 ($679)
ROC at Max: 2.68%
50% Max: 3.39 ($339)
ROC at 50% Max: 1.34%

$NVDA Dominance to 65%: Trajectory is right path might be bumpy.First, I have to say its good to be back among friends after a summer break. A lot has happened in the meantime. In the TradFi and Crypto Markets stuffs are making ATH, and we are in a full-fledged bull market which is third year in the making. History is in favor of us. So, let’s look at the stuffs making new highs and the relative performance. Because relative performance tells us a lot about the over or underperformance, we love to look at CRYPTOCAP:BTC dominance and similarly in the TradFi space we investigate NASDAQ:NVDA Dominance a term we coined here.
My favorite is to look at the NASDAQ:NVDA / NASDAQ:SMH i.e. what percentage of NASDAQ:SMH is represented by $NVDA. We predicated in this space that NASDAQ:NVDA Dominance will touch 65% and NASDAQ:NVDA will first touch 170$.
NASDAQ:SMH and NASDAQ:NVDA Dominance: Some more room to run for both for NASDAQ:SMH by RabishankarBiswal — TradingView
We have blown past our July end target in NASDAQ:NVDA , hence our year end target of 240$ looks achievable. The price target in NASDAQ:SMH of 315 looks more achievable than before. But will this be a straight-line form here. My expectation is that with NASDAQ:SMH @2.61 Fib retracement level with price @ 285 it will go through temporary consolidation before it can resume its upward trajectory with NASDAQ:NVDA doing the heavy lifting. The next catalyst is NASDAQ:NVDA earning on Aug 28.
Verdict: NASDAQ:SMH might go through consolidation here. Year-end targets remain intact: NASDAQ:SMH @ 315 $ and NASDAQ:NVDA @ 240 $ with NASDAQ:NVDA Dominance @ 65%.
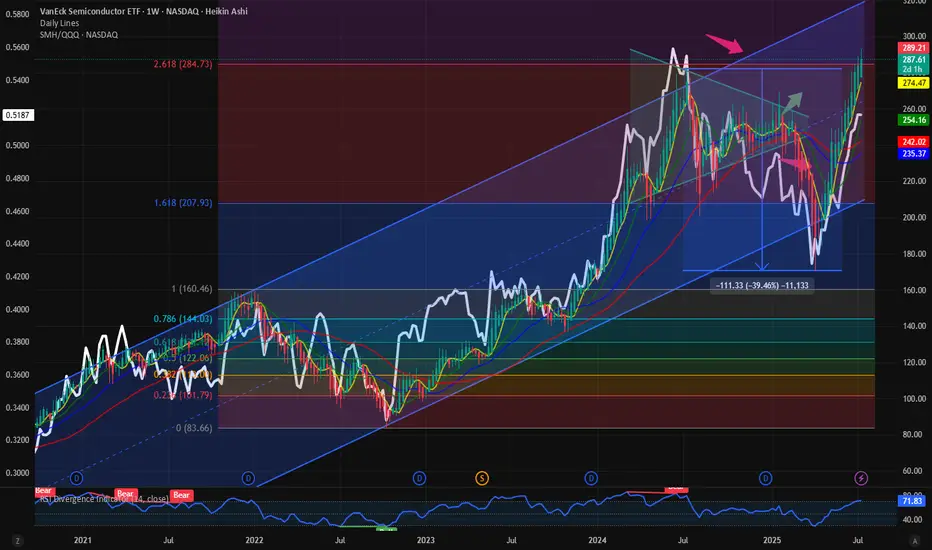
$SMH / $QQQ: Ratio below ATH; Still more room for upside It’s the semis which are the hallmark of a cyclical bull market. It is always the Semis which indicate the start of a bull market and the first to fold over towards the end of a cyclical bull market. Hence the outperformance of Semis as a momentum sector is important from a symbolism perspective and from a market indicator perspective.
When the semis outperform the NASDAQ100 we have momentous bull markets. Today we looked at the ratio chart between NASDAQ:SMH vs $QQQ. This measures the relative outperformance or the underperformance of Semis over the broader NASDAQ100.
This ratio of NASDAQ:SMH / NASDAQ:QQQ touched its ATH on June 2024. Since then, the Semis lost momentum with NASDAQ:NVDA and NASDAQ:AVGO going sideways for a year. Now the momentum is on the side of Semis. Even if the NASDAQ:SMH is at 287 $ and at ATH with price is at its 2.618 Fib Retracement level, still the NASDAQ:SMH / NASDAQ:QQQ is not at its ATH. The ratio is currently @ 0.5. Before we hit 0.56 in the ratio chart just like last June 2024, SMH must outperform the NASDAQ100. If that must happen what should be the price of NASDAQ:SMH ? My prediction is the ratio NASDAQ:SMH / NASDAQ:QQQ tops @ 0.56 and NASDAQ:SMH goes to 400$ this year.
Verdict: Long NASDAQ:SMH over $QQQ. NASDAQ:SMH / NASDAQ:QQQ tops 0.56. NASDAQ:SMH price target 400$.
Opening (IRA): SMH August 15th 215 Short Put... for a 2.50 credit.
Comments: A starter position in the semiconductor ETF on a smidge of weakness here, targeting the strike paying around 1% of the strike price in credit.
Will generally look to add at intervals if I can get it at a strike better than what I currently have on.

SPRIAL TURN MAJOR JULY 5to the 10th TOP 4 spiral and one FIBThe chart posted is the updated chary for SPY SPIRAL calendar TURN Notice f12 is a spiral from July 16th 2024 top F 10 is from 11/2024 DJI The SPY was 12/5 th TOP F8 is from Feb 19th Top They ALL have a focus point on JULY 5th to 10th 2025 it is also 89 days since the print low. I Am looking for a MAJOR World event into this date . This time I feel it will be something with JAPAN . As to the markets here The put/call is now at the same level as july 2023 top and july 2024 . I have had fib targets in cash sp 500 from 6181 to as high as 6331 we are now in the middle of the targets But Time still has 3 to 5 days .So if we close strong today I will be buying deep in the money puts once again . The QQQ have entered the min target 551/553 But I tend to think {HOPE] we can reach 562 plus or minus 1.5 to move to a full short . But now in cash BTW the SMH target 283/285 is also a target .for its TOP Bitcoin is now setup for the next TOP I just need a new high .Best of trades WAVETIMER

$NVDA: Levitating higher: Next Stop 175$: 250$ Before cycle endsIn this summer bull market, it makes more sense to talk about the large cap winners. NASDAQ:NVDA chart is a beauty to watch with the steady climb of this mega cap stock levitates all the indices including S&P500 and NASDAQ. After hitting 90$ during the Liberation Day drawdown the stock is 60% up since then and recovered all its losses and hitting a new ATH. With stock at 158 $ it is targeting the highs of the upward sloping Fib Retracement channel which indicates that stock can reach a price of 175$ before this run loses its steam. At RSI of 65 this is not overbought compared to its historical level of 84. Hence there might be more room left in this bull run for $NVDA. My prediction is that before end of July 2025 the stock hits 175$.
But where do we like to see this outperforming stock during this cycle of bull run. Will it hit 5T USD before Dec 2024? If NASDAQ:NVDA hits 5T USD, then the stock will be 205 $ which in my opinion not impossible before Dec 2025. 40% Upside in the Market Cap and the stock price is achievable in a momentum stock like $NVDA.
Verdict: NASDAQ:NVDA @ 175 $ before July 2025 & 205 $ or 5 T USD Market Cap before Dec 2025

$AVGO above its previous ATH and holding on. 400 $ reachable. The poster child of the AI rally has been NASDAQ:NVDA and $AVGO. Here we have analysed both the stocks multiple times fundamentally and technically. But the lesser known NASDAQ:AVGO has performed better than the NASDAQ:NVDA since the April lows. NASDAQ:AVGO is still above its previous ATH and closed above yesterday which was 242 $ in Jan 2025. NASDAQ:NVDA is still below its Jan 2025 highs of 152 $.
The Semis index NASDAQ:SMH is also 6.3% below its ATH of 262 $. So not many stocks in this index have a more bullish chart than $AVGO. My assessment is that NASDAQ:AVGO will continue its dominant outperformance in the NASDAQ:SMH sector in comparison to others like $NVDA.
Going back to technical and plotting the Fib Extension levels form the last bull run before Aug 2024 we can see that the next possible near-term target is 275 $, a 10% upside form here and in the medium term the target is 400 $.
Verdict : Long NASDAQ:AVGO over NASDAQ:SMH and $NVDA. First Target 275 $ then we go to 400 $.

Opening (IRA): SMH July 18th 195 Short Put... for a 2.23 credit.
Comments: Adding at a strike better than what I currently have on at the 205 ... .

SMH Long Swing Setup – Buy the Dip or Overbought Trap? (2025-06-📈 SMH Long Swing Setup – Buy the Dip or Overbought Trap? (2025-06-12)
Ticker: NASDAQ:SMH | Strategy: 🟢 Equity Long Swing
Bias: Bullish with caution | Confidence: 70%
Hold Period: 3–4 weeks | Entry Timing: Market Open
🔍 Technical & Sentiment Snapshot
• Trend (Daily/Weekly): Strongly Bullish
• Short-Term (30m): Mixed – price above 50/200 EMAs, but below 10-EMA, MACD cooling
• RSI: Overbought (~77), suggests caution
• Bollinger Bands: Price hugging upper band
• MACD Daily: Mild bearish crossover – signals a potential short-term pullback
• Support Levels: 260–261 zone
• Sentiment: Falling VIX, Intel-led chip sector strength → bullish backdrop
🧠 AI Model Consensus
✅ DS, LM, GK (3 Models):
• Recommend long trade at open
• Confidence: ~70–72%
• Target range: $269–276
• Stop zone: ~$255–259
⚠️ GM Report:
• Suggests waiting – daily overbought + bearish MACD → not favorable R:R
• Recommends no immediate entry
✅ Recommended Trade Plan
🎯 Direction: LONG (Buy Shares)
💵 Entry Price: 262.85
📅 Hold Period: 3–4 weeks
🎯 Take Profit: 269.66 (+2.6%)
🛑 Stop Loss: 259.50 (–1.3%)
📏 Size: 100 shares (adjust to your risk profile)
📈 Confidence: 70%
⏰ Entry Timing: Market Open
📍 Entry Validity: Only if SMH opens at/above 262.50 and holds support (~260–261)
⚠️ Risk Factors
• 😬 Overbought RSI may cause short-term profit-taking
• 📉 Bearish MACD crossover could lead to near-term consolidation
• 🧨 Negative market surprise could invalidate long setup
• 🧮 Risk only 1–2% of your portfolio on this trade
💡 SMH bulls stay in control—but for how long?
🗣️ Are you going long, waiting for a pullback, or shorting the top? Drop your plan below 👇
📲 Follow for daily AI-generated trade signals & edge-backed setups.

OKTA - DAY TRADE IDEAOKTA is setting up for a day trade scalp long...perhaps an aggressive swing trade as well. The day trade is a much higher probability of success around the $98.50-$99.30
Okta's stock has seen some volatility recently. After a strong rally earlier this year, it pulled back following cautious guidance from the company. Despite beating expectations on sales and earnings for Q1 fiscal 2026, investors were concerned about slowing growth, leading to a 14.6% drop in its stock price.
Okta reported $688 million in revenue, a 12% year-over-year increase, and positive free cash flow of $238 million, but its GAAP earnings were significantly lower than its adjusted earnings. The company maintained its full-year revenue forecast of $2.85 billion to $2.86 billion, reflecting 9% to 10% growth, but analysts tempered their optimism due to macroeconomic uncertainties.
Technicals
- Multiyear Support
- 50 % Fib Retrace
- Upsloping Trendline
- Positive Divergence building on 1/ 4 hour chart.

$SMH vs $HACK: Recent good correlation with breakout potentialMany market watchers will say that Semis are the most important stocks in the market. Semis are great from a market direction perspective. They are the best to indicate a downturn and the fastest to recover during a bull run. In this blog we have appreciated the relative resilience of the Cybersecurity stocks during the recent bear market. The cybersecurity ETF AMEX:HACK fell only 25 % during the 2025 bear market. NASDAQ:SMH fell almost 40% and NASDAQ:SMH / AMEX:HACK fell 35% which indicated the relative underperformance of Semis vs Cybersecurity in April. But form the lows of ‘Liberation Day’ NASDAQ:SMH and AMEX:HACK are trading with perfect correlation. But the question comes will NASDAQ:SMH claim the leadership and outperform AMEX:HACK if this bull market continues.
In the last 2024 Bull market NASDAQ:SMH significantly outperformed the $HACK. We are probably in the early days of this breakout outperformance. So. In my opinion in the near term NASDAQ:SMH outperforms $HACK. The ratio is at 96%. The ratio might touch the previous cycle highs of 160% if the momentum continues.
Verdict: NASDAQ:SMH outperforms AMEX:HACK in near term. Buy NASDAQ:SMH ; Hold AMEX:HACK

SPX Bullish Patterns Emerging ahead of NVIDIA EarningsThe SP:SPX has taken out some major pivots and recaptured the ever so important daily 200 MA.
across multiple time frames some very interesting bullish patterns are emerging.
All eyes will be in NASDAQ:NVDA earnings tonight after the bell.
If NVIDIA beats and guides it will breakout of an epic bull flag pattern that will likely casue this market to trend to new All time highs.
Probabilities from a technical pattern standpoint are pointing towards higher price action.
We have already broken out and back tested key support levels and the buying is clearly being observed.
We remain net long with positions already in profit.
