Weekly outlook: XAUUSD, #SP500, #BRENT |5 February 2026XAUUSD: BUY 4630.60, SL 4625.60, TP 5080.60
Gold starts the week after a sell-off: higher margin requirements on the exchange and a stronger US dollar prompted some players to close positions. XAUUSD is around 4630.60 per ounce; analysts link the pressure to strong US data and news related to the Fed’s leadership.
The focus is on US statistics and the regulator’s comments; meanwhile, the January employment report may be postponed due to a partial government shutdown. Central bank buying and forecasts from a number of banks for gold in 2026 support interest in buying dips.
Trading recommendation: BUY 4630.60, SL 4625.60, TP 5080.60
#SP500: BUY 6988, SL 6978, TP 7288
The S&P 500 starts the week at record levels: the index is around 6,988 points thanks to strong earnings expectations and demand for companies linked to artificial intelligence. Improving US manufacturing activity also provides support.
Key events include major tech companies’ reports and budget headlines: the US Congress is discussing ending the partial government shutdown, which could delay the January employment report. In a calm environment, the rally may continue, but surprises could quickly increase volatility.
Trading recommendation: BUY 6988, SL 6978, TP 7288
#BRENT: SELL 66.30, SL 66.80, TP 60.00
Brent remains under pressure, trading around 66.30 per barrel after signals that US–Iran talks may resume, easing concerns about supply disruptions. A stronger US dollar is also weighing on commodities.
This week, the market will assess the supply-and-demand balance: news reports note that OPEC+ has decided not to change production levels at least until March. If tensions do not intensify and expectations of rising inventories are confirmed, pressure on prices may persist.
Trading recommendation: SELL 66.30, SL 66.80, TP 60.00
Sp500index

SPX Daily: Rising Wedge at the HighsPrice is compressing inside a rising wedge near record levels — a downside break would signal a pullback, while an upside breakout requires strong follow-through to sustain the trend.

SP500 - A QUICK BUY SET UP - 29-01-2026SP500 G-Money's short version analysis based purely on technical analysis only, no nonsense or "BS". I do totally ignore any fundamental analysis, technical analysis only
SP500 still kinda on the "move" and continue up...
Who did enter this trade earlier congratulations! Who missed it... See you next time! ;)
Chart is itself explaining. Kept a "KISS" approach all the way ( "Keep It Simple, Stupid") & beginners friendly... ;)
I do hope that nobody ignoring SL ( Stop Loss) ! Without it, It is a fastest way to loose hard earned money...
;)
Trade safe & don't do "gambling". In the end it never pays, not worth it to risk loose all your $...
PS: above technical analysis is done for the community & educational purpose only! It is not a financial advice. Just share my very own insight to it.

S&P500 & NASDAQ: Trading Above The +FVG! Look For Longs!Welcome back to the Weekly Forex Forecast for the week of Jan. 27-30th.
In this video, we will analyze the following FX market: S&P500 and NASDAQ
Both indices have been trading sideways. Both made an inefficient bearish move last week that
took a week to recover from. Both have been struggling to get move higher through a bearish FVG.
That changed Monday. The Monday candle closed above the -FVG, indicating bullish order flow.
Look to take advantage tomorrow! Price is heading towards buy side liquidity, and there will be opportunities to take valid long setups over the next 24 hrs.
Enjoy!
May profits be upon you.
Leave any questions or comments in the comment section.
I appreciate any feedback from my viewers!
Like and/or subscribe if you want more accurate analysis.
Thank you so much!
Disclaimer:
I do not provide personal investment advice and I am not a qualified licensed investment advisor.
All information found here, including any ideas, opinions, views, predictions, forecasts, commentaries, suggestions, expressed or implied herein, are for informational, entertainment or educational purposes only and should not be construed as personal investment advice. While the information provided is believed to be accurate, it may include errors or inaccuracies.
I will not and cannot be held liable for any actions you take as a result of anything you read here.
Conduct your own due diligence, or consult a licensed financial advisor or broker before making any and all investment decisions. Any investments, trades, speculations, or decisions made on the basis of any information found on this channel, expressed or implied herein, are committed at your own risk, financial or otherwise.

THE FOUR HORSEMEN OF FINANCE -BTC/SP500/GOLD/COPPERTHE FOUR HORSEMEN OF FINANCE
BTC/SP500/GOLD/COPPER
"THE GREAT SHOWDOWN IN THE FINANCIAL ARENA: WHO WINS?" ⚔️
There are 4 assets on the table: GOLD | COPPER | SPX | BITCOIN
Our technical data screams that history's largest "Great Rotation" has begun. Leave your emotions aside. Let the data speak.
ROUND 1 & 2: THE "BUBBLE" vs THE "OPPORTUNITY"
Traditional markets are saturated. Bitcoin is historically cheap against them.
BTC vs S&P 500: RSI is at 26 (Technical Bankruptcy). Similar to 2015/2019 bottoms.
BTC vs GOLD: RSI is at an ALL TIME LOW (29).
2w chart BTC vs S&P 500
1w chart BTC vs S&P 500
1w BTC vs GOLD
1M BTC vs GOLD
Verdict: Wall Street and Gold are exhausted. Smart money is rotating into the only oversold asset: Bitcoin.
ROUND 3: THE ECONOMIC REALITY
Is Bitcoin expensive against the economy? NO.
BTC/COPPER: Technically oversold against industrial demand.
COPPER/GOLD RATIO: Deep in the danger zone (RSI 22). When this ratio rises from the dead, Bitcoin goes parabolic.
Meaning: We are at the exact pivot point where risk appetite wakes up.
THE VERDICT & THE TRAP
Those in stocks feel "Safe." Those in Bitcoin feel "Tired." This is the trap. The market transfers wealth from the impatient to the patient.
The Scoreboard:
S&P 500: Overvalued ❌
Gold: Saturated ⚠️
Bitcoin: OVERSOLD AGAINST EVERYTHING. ✅
Strategy: Follow the value, not the price. The "Great Rotation" flows to the scarcest asset—because this is exactly what happened in every previous cycle bottom. History is repeating itself.
PSYCHOLOGICAL TRAP
Those currently in stocks or gold feel "Safe." Those holding Bitcoin feel "Tired and Jaded." This is exactly what the market is: A transfer of wealth from the impatient to the patient.
The "Oversold" zones on the charts are "Pain" zones. But the biggest profits are always born from this pain.
STRATEGY
I am not a soothsayer; I am an analyst. The data tells me this: Global liquidity will exit swollen traditional markets (SPX, Gold) and flow into the asset with the highest "Value/Price" mismatch.
That asset, having bottomed out in all ratios, is Bitcoin. This is not investment advice; it is an "Asset Survival" guide.
"The crowd follows price; Professionals follow value." Value is currently at the bottom, while Price has not yet left the station.
Are you ready?

Nasdaq Retests January Highs + BSL – Rejection Here?Hello Fellow Traders,
We're looking at the Nasdaq (NQ or NDX) today.
The index has retested and taken out the January highs again — hitting major buy-side liquidity from earlier in the month.
Right now, the market is in a major consolidation phase and could stay range-bound through much of Q1. We're trading in premium territory relative to the broader dealing range — so a correction down to the discount area (below equilibrium) feels likely and healthy in this environment.
If we see clear rejection signs from the current area (e.g., strong wicks, failure to hold highs, or displacement lower), expect a potential waterfall move down to the highlighted discount PD Arrays.
Focus on reactions at those PD Arrays (like FVGs, NDOG/NWOG, Order Blocks, etc.) — not just price.
Example: If the top highlighted FVG breaks with displacement (strong move through it), it flips to an iFVG (inverted FVG). Any retracement back into that iFVG becomes a solid short signal.
Vice versa for lower arrays — bullish reactions there could confirm continuation or reversal.
Bias: Still overall bullish macro, but short-term correction to discount zones is expected to reload buyers. Watch for confirmation at those PD Arrays before acting — patience pays!
Keep risk tight, especially in choppy consolidation. What's your view on Nasdaq? Expecting rejection and drop, or breakout higher first? Drop your thoughts below!
#Nasdaq #NQ #NDX #TechnicalAnalysis #SMC #ICT #PDArrays #FVG #Forex #Indices

S&P 500: Ascending Trend Broken - Are Bears Taking Control?S&P 500: Ascending Trend Broken - Are Bears Taking Control?
The uptrend that has been in place since April 2025 has been broken with a gap!
The S&P 500 index is at a critical turning point. So, are bears really gaining strength? Let's answer this question with 3 key technical indicators:
1️⃣ Trend Break and Retest Phase
The ascending trendline valid since April 2025 has been broken with a gap. Currently, a retest of the breakdown is taking place.
2️⃣ Weakening Momentum
There is a noticeable decrease in buying power. Bulls are losing control. Volume/momentum indicators show an active "Bearish" signal.
3️⃣ SMA50 Being Tested for the Third Time
SMA50 has been challenged 3 times in the last 2 months. Support strength weakens with each test. Short-term trend support is in danger.
📊 Critical Levels
🟢 Support Levels:
6,860 - FRVP POC (critical pivot)
6,836 - SMA50 (most critical support)
6,723 - SMA111 (medium-term support)
6,496 - Fibonacci 0.236 level
🔴 Resistance Level:
6,985 - Fibonacci level
💡 Scenarios
Bearish Scenario (High Probability):
If SMA50 breaks → 6,723 and then 6,496 levels could be tested. Deepening selling pressure may be expected after gap-filling movement.
Bullish Scenario:
Breaking above 6,985 resistance → Trend breakdown becomes invalid. In this case, new target: 7,000+ levels
⚠️ This Week is Critical!
BoJ Interest Rate Decision (Tomorrow)
The Bank of Japan's decision could create volatility in the markets. The most critical weekly close of the year is approaching. In case of SMA50 loss, the selling wave could deepen.
📌 Conclusion
Technical data points to a bearish trend. Especially the confirmation of the trend break, momentum loss, and the risk of SMA50 breaking. When these factors combine, it's important to be cautious in the short term and focus on risk management. Tomorrow's BoJ decision and the weekly close will set the direction for the coming weeks.
Key level to watch: SMA50 level (6,836)
Thank you for reading.

S&P500, NASDAQ Update: Found Support! Heading Higher?This is an mid-week UPDATE to the Weekly Forex Forecast for the week of Jan. 19-24th.
In this video, we will analyze the following FX market: ES and NQ
Both of the indices dumped upon the Open Tuesday with Trump tariff threats. Wednesday, the market found support and bounced for a full recovery from Tuesday's drop.
If price breaks through the Volume Imbalance, we could see the market rally to the buy side liquidity highs, as mentioned in the forecast .
We'll soon see...
Enjoy!
May profits be upon you.
Leave any questions or comments in the comment section.
I appreciate any feedback from my viewers!
Like and/or subscribe if you want more accurate analysis.
Thank you so much!
Disclaimer:
I do not provide personal investment advice and I am not a qualified licensed investment advisor.
All information found here, including any ideas, opinions, views, predictions, forecasts, commentaries, suggestions, expressed or implied herein, are for informational, entertainment or educational purposes only and should not be construed as personal investment advice. While the information provided is believed to be accurate, it may include errors or inaccuracies.
I will not and cannot be held liable for any actions you take as a result of anything you read here.
Conduct your own due diligence, or consult a licensed financial advisor or broker before making any and all investment decisions. Any investments, trades, speculations, or decisions made on the basis of any information found on this channel, expressed or implied herein, are committed at your own risk, financial or otherwise.

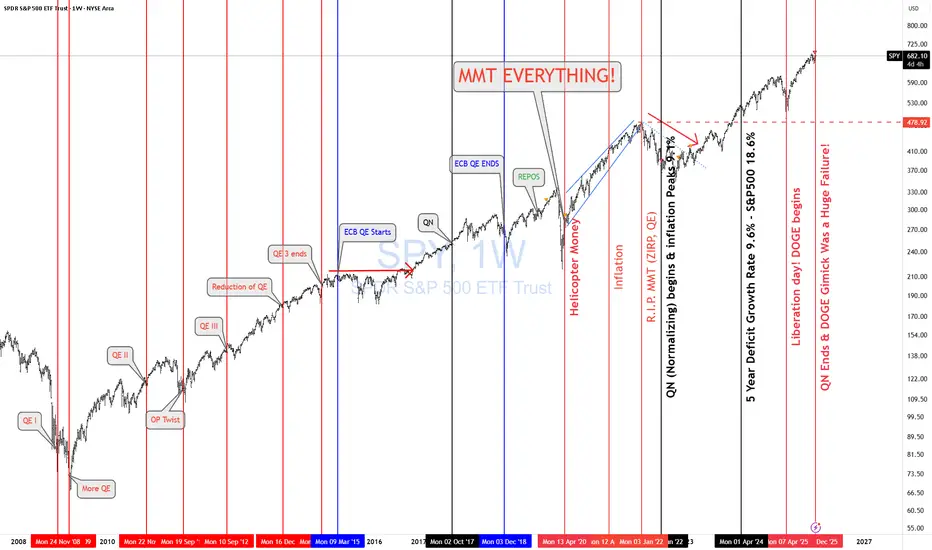
SPY & Macro HistoricalToday FED ended QN (Quantitative Normalizing NOT "T" = tightening. 1st, you normalize, then you tighten. Right??)
The Fed is continuing to let mortgage-backed securities roll off its balance sheet, while the U.S. Treasury increases T-bill issuance (cash-like instruments). That combination means more gov securities are hitting the market even as the Fed’s balance sheet stays roughly unchanged.
More Treasury supply + no Fed buying = higher yields and tighter liquidity. More MBS roll-off = higher mortgage rates and pressure on housing. Treasury bills soak up cash, while longer bonds suffer.
🔥 REALMACRO summary:
The Fed is doing this to:
Get out of the mortgage market.
Strengthen the Treasury bill market (the foundation of dollar liquidity).
Keep bank reserves “ample” without restarting QE.
This combo lets them tighten just enough to cool asset prices, without breaking the plumbing again like in 2019.
The success of this experiment will largely determine how long the Fed can avoid returning to QE. If liquidity tightens too far as the economy continues to weaken, they’ll be forced back into some form of balance sheet expansion sooner rather than later.
Lastly, let's check how right I was when I posted "MMT Everything."
As of April 2020, US debt was $ 24T. Today, it is $38T, representing a total increase of $14T in 5 years.
✅ CAGR ≈ 9.6% per year
✅ S&P 500 CAGR (Apr 2020 → Today): ~18.6% per year
Both are completely unsustainable growth rates.
I nailed that back in April 2020. Trump & MMT "print and play" will be the death of us! SIGH!
Lastly, the DOGE gimmick was a complete and total failure as expected. No reduction in deficit and no fraud found. Imagine that!
As I keep saying, " NEVER INVEST IN TOXIC PEOPLE! THEY WILL ALWAYS BURN YOU IN THE END!" It's not political it's a FACT!
THANK YOU for getting me to 5,000 followers! 🙏🔥
Let’s keep climbing.
If you enjoy the work:
👉 Drop a solid comment
Let’s push it to 6,000 and keep building a community grounded in truth, not hype.
SP500 Sell Trading Opportunity SpottedH1 - Strong bearish pressure.
No opposite signs.
Expecting the price to drop further from the marked resistance zones.
👉 If you enjoy this analysis, please Like, Follow, and Support the profile! Your engagement motivates us to share more quality setups.

SP500 - Looking To Sell Pullbacks In The Short TermH1 - Strong bearish move.
No opposite signs.
Expecting bearish continuation until the two strong resistance zones hold.
If you enjoy this idea, don’t forget to LIKE 👍, FOLLOW ✅, SHARE 🙌, and COMMENT ✍! Drop your thoughts and charts below to keep the discussion going. Your support helps keep this content free and reach more people! 🚀
--------------------------------------------------------------------------------------------------------

SPX: Markets pause amid political noiseU.S. equity markets were not quite happy during the previous week with all political developments, related to the DOJ probe on Fed Chair Powell, political narrative of the US President taking over Greenland, as well tensions in Iran and potential interference of the US. All these topics are bringing insecurity among investors, making them favour gold and silver against riskier assets. The S&P 500 tested ATH at the start of the week, however, the rest of the week was traded at the lower grounds, closing the week at 6.940. The magical number of 7.000, which most investors are expecting for the S&P 500 to reach, at this moment seems on hold.
The season of quarterly results started with tech companies. The Taiwan Semiconductors were specially watched for their performance. The company reported results above forecasts, with a revenue growth of 35% y/y, driven by robust demand for advanced chips, particularly for AI and high-performance computing. Stock gained around 10% on a weekly basis. Also other chip companies were weekly gainers, like Broadcom and Advanced Micro Devices.
On the opposite side were stocks of financial institutions, as the US President announced putting a cap on credit card interest rates. JPMorgan and Bank of America were the ones most hit by this news, as largest banks in the US, with drop in share prices around 5%.
The week ahead brings US PCE data for November, as well as quarterly results for some notable names like Intel, Netflix, Johnson&Johnson, U.S Bancorp and 3M.

January Effect: Mid and Small-Cap Stocks Outperform Mega-CapsIn the first half of the first month of the year the market is clearly dominated by mid and small-cap stocks (which carry more influence in equal-weighted index than in the cap-weighted).
They are outperforming mega-caps by 1.94%.
This could be a sign of the January Effect where small stocks tend to outperform early in the year.

SPX|Near the Upper Bound of a Long-Term Uptrend ChannelSPX is entering a high-risk zone defined by late-cycle dynamics and unfavorable risk-reward, where capital preservation and risk management matter more than chasing incremental upside.

ES SP500 - H4 - SHORTS - BEARISH REVERSAL Ready or not - hear it comes - US500 - H4 - clean bearish reversal setup

MES - Descending Channel + Liquidity Sweep at 6,940 | Reversal?
What's up traders! 👋
Interesting setup developing on MES1! right now. We've got a descending channel in play, but something caught my eye - a liquidity sweep just happened around 6,940. Let's break it down.
What I'm Seeing
MES1! is trading at 6,966 inside a descending channel on the 45-minute timeframe. Price has been making lower highs and lower lows - textbook bearish structure. BUT we just saw a liquidity sweep around 6,940 where sellers couldn't close their positions.
This is where it gets interesting. When liquidity gets swept and price bounces, it often signals smart money stepping in. The question is: reversal into the FVG zone, or continuation down to the lows?
The Liquidity Sweep Setup
Price swept below 6,940 - grabbed liquidity from weak longs
Sellers couldn't close at those prices - trapped shorts
Bounce happening now - buyers potentially stepping in
FVG zone at 6,965-6,985 is the first target if reversal confirms
If FVG fails to hold, continuation to 6,925 and 6,912.25 lows
Market Context
The broader picture:
S&P 500 fell 0.53% to 6,926.60 today - risk-off sentiment
JPMorgan dropped 4% despite beating earnings (credit card cap fears)
Financials dragging the market lower
Core CPI came in cooler (0.2% vs 0.3%) - but market still selling
Trump vs Powell drama continues - uncertainty elevated
Forward curve still pricing 7,100+ by end of 2026 - long-term bullish
Key Levels to Watch
Resistance:
6,965-6,985 - FVG zone (first target if reversal)
7,002 - Day's high
7,036 - 52-WEEK HIGH / Major resistance
Support:
6,940 - Liquidity sweep zone
6,925 - Horizontal support
6,912.25 - LOWEST LOW (channel bottom)
Two Scenarios
Bullish reversal: The liquidity sweep at 6,940 trapped shorts and smart money is stepping in. Price bounces into the FVG zone (6,965-6,985), reclaims it, and pushes toward 7,000+. This would be a classic sweep → reversal pattern.
Bearish continuation: The descending channel continues to dominate. Price retests the FVG zone but gets rejected, then breaks below 6,940 and targets 6,925, eventually hitting 6,912.25 (the lowest low). High impact news or Fed drama could accelerate this.
My Take
I'm NEUTRAL here but watching closely for the reversal. The liquidity sweep at 6,940 is significant - that's where trapped sellers create buying pressure. If we can reclaim the FVG zone and hold above 6,965, the reversal thesis gains strength.
However, the descending channel is still intact. Until we break above the upper trendline, the trend is technically bearish. Don't fight the trend unless you see clear reversal confirmation.
Watch the FVG zone reaction. That's your tell.
Drop your thoughts below - reversal or continuation? 👇

Too squeezy to ignoreThe VIX ETF just broke up the falling wedge in the weekly timeframe. I just bought this, it might pull back to test the broken resistant at 34-35. the VIS also is very low and trying to go up. And the SPY is close to ATH. MY SL triggers only if a weekly candle closes below 34.
Good luck

Weekly outlook: XAUUSD, #SP500, #BRENT | 16 January 2026XAUUSD: BUY 4570.00, SL 4540.00, TP 4660.00
Gold starts the week near $4,570 per ounce, holding close to record highs amid stronger demand for safe-haven assets. Support comes from rising geopolitical tensions and a softer US dollar as investors reassess the stability of US monetary policy.
Over the coming days, the main driver will be US inflation data and the Fed’s messaging: if price growth remains moderate, expectations of rate cuts should keep gold in demand. A sharp jump in government bond yields could cap gains, but ongoing buying by central banks continues to provide a fundamental cushion.
Trading recommendation: BUY 4570.00, SL 4540.00, TP 4660.00
#SP500: BUY 6970, SL 6940, TP 7060
The S&P 500 begins the week near 6,966 after setting fresh record highs. Sentiment is supported by expectations of resilient corporate earnings, but the market has become more sensitive to Fed-related headlines and potential political and legal risks in the US.
Key focal points this week are US inflation data and the start of the earnings season for major banks and technology companies. Softer inflation and strong results may sustain demand for equities, while higher inflation and a new wave of uncertainty could increase caution and temporarily cool risk appetite.
Trading recommendation: BUY 6970, SL 6940, TP 7060
#BRENT: SELL 63.40, SL 64.00, TP 61.60
Brent starts the week around $63.39 per barrel: geopolitical risks in the Middle East add a premium, but the market is not yet pricing in serious supply disruptions. At the same time, attention is growing around a potential recovery of Venezuelan exports.
Over the week ahead, pressure comes from expectations of excess supply in 2026 and cautious demand estimates. Support could appear if there are signs of production cuts or new restrictions on supply from major producers, but without such news the balance of factors still favors a modest decline in Brent.
Trading recommendation: SELL 63.40, SL 64.00, TP 61.60

SPY - Inverse Head & ShouldersAfter many "If". I found this. Expecting a breakout soon. Probably towards 750 before march.

Commodities vs SP500Comparing commodities index vs SP500, it's at its lowest level since 1980.
It's time for a strong rebound ?

Weekly outlook: XAUUSD, #SP500, #BRENT | 09 January 2026XAUUSD: BUY 4415.50, SL 4380.00, TP 4522.00
Gold starts the week near 4415.50 per ounce: thin trading at the beginning of the year has amplified reactions to news from Venezuela and broader geopolitical tension, lifting demand for safe-haven assets. Support also comes from expectations of lower US interest rates in 2026 and continued buying by central banks.
For the week of January 5–9, the focus is on US data on business activity and the labor market, with the key event being Friday’s jobs report. Weaker figures could strengthen interest in gold, while strong numbers may boost the dollar and cool the market temporarily.
Trading recommendation: BUY 4415.50, SL 4380.00, TP 4522.00
#SP500: BUY 6858, SL 6778, TP 7098
The #SP500 is holding around 6858 at the start of the first full week of 2026: investors are weighing geopolitics and oil, but the main guide remains expectations for US interest rates. After a strong finish to 2025, the market enters the week with a cautious tone.
The week of January 5–9 is packed with US statistics, with Friday’s employment report as the highlight. Moderate data would support equities through hopes of lower borrowing costs, while a surprise rise in inflation expectations and yields could increase pressure on the stock market.
Trading recommendation: BUY 6858, SL 6778, TP 7098
#BRENT: SELL 60.43, SL 62.10, TP 55.40
#BRENT is trading near 60.43 per barrel: news around Venezuela has added sharp swings, but the market sees no major supply disruptions for now. OPEC+ is keeping current output settings, and talk of potential supply growth ahead is capping prices.
For the week of January 5–9, the spotlight is on demand signals via US statistics and updates from China, as well as the regular US inventory figures. If demand stays soft and the dollar strengthens, oil risks sliding; however, tighter sanctions or logistical disruptions could quickly restore support.
Trading recommendation: SELL 60.43, SL 62.10, TP 55.40

S&P 500 Showing Seller Weakness After Multiple Corrections — BreSummary
The S&P 500 has completed three consecutive corrective phases from the 6945–6922 zone, signaling weakening downside momentum and increasing potential for a bullish continuation.
Technical Analysis
The S&P 500 index has experienced three successive corrective moves originating from the 6945–6922 price zone. These corrections have unfolded in the form of long, medium, and short waves, a structure that typically reflects exhaustion during the corrective phase rather than the start of a strong bearish trend.
The decreasing depth and duration of each corrective leg clearly point to seller weakness and diminishing downside pressure. Buyers are increasingly absorbing supply, suggesting that the market is preparing for a potential impulsive move higher.
From a price action perspective, the market is consolidating and compressing below resistance, creating conditions favorable for a volatility expansion once a key level is breached.
Trading Scenarios
Scenario 1 – Higher Risk (Aggressive Entry):
Traders may consider entering near one of the recent price lows, accepting a higher level of risk in exchange for an early position. This approach is based on the assumption that the corrective phase is complete and a strong bullish impulse may follow.
Scenario 2 – Lower Risk (Confirmation Entry):
A more conservative strategy is to wait for a clear breakout above resistance, confirmed by a strong bullish Marubozu candle. This provides momentum confirmation and reduces the probability of a false breakout.
Key Levels to Watch
Support Zone: 6945 – 6922
Key Resistance: Previous corrective highs
Bullish Confirmation: Breakout with strong bullish candle structure
Invalidation: Sustained acceptance below the support zone
Takeaway
As long as the S&P 500 holds above the 6945–6922 support zone, the market structure favors a bullish continuation. Aggressive traders may position early at the lows, while conservative traders should wait for a confirmed breakout with strong momentum.
Hashtags
#SP500 #US500 #PriceAction #MarketStructure #BreakoutTrading #TechnicalAnalysis

MES - Descending Wedge at 6,900 | Support Zones Below For Bounce
Executive Summary
Micro E-mini S&P 500 futures (MES1!) trading at 6,900.50 within a descending wedge on the 4H timeframe. After the S&P 500's third consecutive year of gains (+16.56% 1Y), price is consolidating below the 52-week high of 6,995. Multiple support zones below offer potential bounce opportunities. Descending wedge typically bullish reversal pattern.
BIAS: NEUTRAL - Watching Support Zones for Direction
Current Market Data
Current: 6,900.50 (+0.12%)
Day's Range: 6,866.50 - 6,939.75
52-Week: 4,832.50 - 6,995.00
Open Interest: 130.39K
Front Month: MESH2026
Performance:
1W: -1.15% | 1M: +0.51% | 3M: +2.02%
6M: +9.41% | YTD: -0.01% | 1Y: +16.56%
Key Market Context
S&P 500 just completed 3rd consecutive year of gains
50% odds of 4th straight year based on history
Valuation indicators at extreme levels (98th percentile)
Breadth oscillators on sell signals
Equity put-call ratios rising (bearish)
VIX still complacent - bullish for stocks
Fed rate cuts expected in 2026
AAII bears at lowest since Oct 2024
Technical Structure - 4H
Descending Wedge Pattern:
Falling resistance trendline (yellow dashed)
Falling support trendline (yellow dashed)
Wedge narrowing - compression before breakout
Typically bullish reversal (70% break up)
Key Levels:
Resistance:
6,940 - Day's high / immediate resistance
6,970 - Upper resistance (red line)
6,995 - 52-WEEK HIGH
7,000+ - Psychological / breakout target
Support Zones (Purple):
6,860 - 6,880 - Upper support zone
6,800 - 6,820 - Middle support zone
6,720 - 6,760 - Lower support zone
6,675 - Major support (red line at bottom)
SCENARIO ANALYSIS
BULLISH: Wedge Breakout
Trigger: Break above 6,970 with volume
Targets: 6,995 (52-week high) → 7,000+ → 7,100
BEARISH: Test Support Zones
Price tests 6,860-6,880 first support
If fails, drops to 6,800-6,820
Deeper support at 6,720-6,760
Major support at 6,675 (must hold)
My Assessment
Descending wedge at 6,900 with multiple support zones below. Market breadth weakening but VIX complacent. Expect test of support zones before potential breakout. Watch 6,860-6,880 for bounce. Break below 6,675 invalidates bullish thesis.
Strategy:
Watch for bounce at 6,860-6,880 support
Long on wedge breakout above 6,970
Target 6,995 (52-week high), then 7,000+
Stop below 6,675 major support
List your thoughts below!
