Weekly Market Outlook: Nifty, BankNifty & S&P 500Nifty (25722) slipped ~70 pts this week, staying exactly within my projected range of 26250–25350. The weekly candle formed a shooting star, signalling selling pressure from higher levels.
A close below 25711 can extend downside toward 25450–25300.
On the upside, only a close above 25860 can open a move toward 26100–26150.
BankNifty held firm above 57600, but a dip below 57450 could pull it to 57000–56750.
A breakout above 57900 with volume can take it toward 58469–58577 (ATH) — this will be key to any Nifty recovery.
S&P 500 closed at an all-time high of 6840, just shy of the crucial Fib level 6959. Sustaining above 6800 can push it to 6920–7009, while a drop below 6780 may trigger a pullback toward 6689/6568.
Historically, November brings a healthy 4–7% correction after strong October rallies. So a dip toward Nifty 25150–25200 wouldn’t be surprising — it may just set up the next leg higher.
🔹 Nifty Range: 26150–25250
🔹 BankNifty Key Zone: 57450–57900
🔹 Global Cue: S&P 500 near Fib resistance 6959
Sp500index

S&P500: Rising?S&P 500 futures edged slightly lower in yesterday’s session but are expected to remain within the upward trajectory of magenta wave (5), which, under our primary scenario, is likely to continue moving higher. This advance would also complete the larger blue wave (III). Afterward, we anticipate a corrective phase in magenta wave (A), which should put renewed pressure on the index. At the same time, we are monitoring our alternative scenario, which suggests that magenta wave alt.(3) has not yet concluded. If prices drop below the support level at 6,371 points, this scenario will come into play. In that case, wave alt.(4) would likely extend further downward, reaching its low within the magenta alternative Target Zone between 6,055 and 5,822 points (probability: 30%).

S&P Nearing Major Resistance (Update)This updates my previous S&P chart back last year showing the S&P still had room to run until any major resistance. We're nearing that major resistance at 7577. Looks like it might hit around January 2026.
The trouble is this trend is heating up and we needed a pullback to 6295. With all the excitement from Nvidia and other major Hyperscalers I'm worried it's going to just go straight to Major resistance. *If it does* we could be looking at a decently large pullback next year (finishing around August) down to that 6295 area and back into the supporting trend line for the next big uptrend to start.
If however we slow down here and get a pullback back to 6295 then I think we're good to make it over the major resistance without that big pullback next year.
Either way once we hit the major resistance at 7577 we'll need to get close to that lower trend line at some point to begin a new bull run.
Good luck and take caution as we approach this resistance!

US500US500 – Opportunity at Support
The price is consolidating between 6,880 and 6,920. The support region shows a buying reaction, which could generate a new impulse towards the resistance at 6960.

Trump & The Eighth (8): The Millennium S&P500 Long Deal!For friends and Donald Trump the Magnificent (Trump).
Friends, based on analysis of data from the S&P 500 index, Trump's visible activity, and the Federal Reserve's aggressive interest rate cutting cycle - the conclusion is obvious. The US economy, and therefore the global economy, is transitioning from stagnation to recession. Consequently, the S&P 500 will first enter a correction, then experience a severe crash in 2026.
However, there exists an algorithm that can soften this collapse and save the global economy. This is the exact algorithm Trump intends to execute through a deal with Russia, achieved via a Russia-Ukraine ceasefire. This must become more than a temporary truce - it must be peace for generations to come.
To save millions of lives, to rescue the global economy and US markets, the Eighth (8) will come:
The Eighth (8) - the man who, through agreements with both Putin and Trump, will provide security guarantees and immunity for Putin, his inner circle, and their capital.
The Eighth (8) will sign a peace agreement with Zelenskyy based on a 50-year lease of territories along the current front lines. Using unfrozen Russian sovereign assets, he will restore both Russian and Ukrainian territories and pay all due compensations to victims' families.
The Eighth (8) will make a deal with Trump ensuring complete cooperation, mutual understanding, and prosperity for Russia, Ukraine, and the United States.
These three steps will enable comprehensive resolution of both regional and international issues, which in turn will sustain the global economy and US market indices.
Best regards,
VinterFrank (8)

Weekly Outlook: XAUUSD, #SP500, #BRENT for 27-31 October 2025XAUUSD: BUY 4075.00, SL 4025.00, TP 4225.00
Gold starts the week near record territory, with spot prices fluctuating around $4,080 per ounce. Support comes from expectations of a Federal Reserve rate cut at the October 28–29 meeting and the recent pullback in U.S. Treasury yields ahead of the decision. Headlines about a potential temporary government funding pause in the U.S. and delayed data releases enhance gold’s role as a defensive asset, while September inflation came in slightly below expectations, reinforcing the case for policy easing. In addition, fund inflows into gold have stayed strong after October’s price spike.
The fundamental backdrop remains constructive: World Gold Council data point to renewed net purchases by central banks late in the summer, and October saw more active investment flows into “paper” gold as market volatility rose and real yields eased. Risks to this view include a more cautious Fed tone and a brief dollar rebound after the decision, but these are offset by steady institutional demand and ongoing geopolitical uncertainty.
Trade idea: BUY 4075.00, SL 4025.00, TP 4225.00
#SP500: BUY 6785, SL 6705, TP 7025
U.S. equities enter the week on strong footing: the S&P 500 holds near 6,790 after softer September inflation data and lower government bond yields. Markets are focused on the Fed’s October 28–29 decision; the prevailing view anticipates another rate cut, which would reduce borrowing costs and support the valuation of future earnings. The reporting season is in full swing, with expectations for double-digit earnings growth for 2025 and a busy week of results from index constituents.
Fundamentally, the index benefits from a combination of easing rate pressure, resilient profit expectations in sectors tied to digital infrastructure and AI-related investment, and a broadly steady consumer backdrop. Key risks include any prolonged disruption to federal services that could distort the macro data flow, and the chance of tighter corporate guidance given currency strength and fluctuations in global electronics demand.
Trade idea: BUY 6785, SL 6705, TP 7025
#BRENT: SELL 66.30, SL 68.00, TP 61.20
Brent trades around $66 per barrel. The weekly news flow is mixed: on one hand, infrastructure risks linger in the Black and Baltic Sea regions; on the other, international agencies flag accelerating supply growth alongside moderate demand. The earlier OPEC+ decision to allow a marginal output increase and revised surplus projections effectively cap prices despite sporadic supply disruptions and sanctions-related headlines.
By late October, industry assessments imply a gradual rebuild in inventories and a softer price path into Q4, albeit with elevated headline-driven volatility. Additional pressure comes from a cooler global backdrop and rising non-OPEC+ production, while any Fed rate cut would only partly lift the commodity complex. Short-position risks include an escalation of geopolitical tensions that threatens exports and an unexpectedly sharp draw in weekly U.S. stock data.
Trade idea: SELL 66.30, SL 68.00, TP 61.20

S&P 500 (ES1!): Bullish! Wait For Valid Buy Setups!Welcome back to the Weekly Forex Forecast for the week of Oct. 27 - 31st.
In this video, we will analyze the following FX market: S&P 500 (ES1!)
The S&P500 closed last week at ATHs. I expect more of the same next week.
Look for valid dip buying opportunities, my friends.
If the market disrespects the +OB, then buys become invalidated.
Enjoy!
May profits be upon you.
Leave any questions or comments in the comment section.
I appreciate any feedback from my viewers!
Like and/or subscribe if you want more accurate analysis.
Thank you so much!
Disclaimer:
I do not provide personal investment advice and I am not a qualified licensed investment advisor.
All information found here, including any ideas, opinions, views, predictions, forecasts, commentaries, suggestions, expressed or implied herein, are for informational, entertainment or educational purposes only and should not be construed as personal investment advice. While the information provided is believed to be accurate, it may include errors or inaccuracies.
I will not and cannot be held liable for any actions you take as a result of anything you read here.
Conduct your own due diligence, or consult a licensed financial advisor or broker before making any and all investment decisions. Any investments, trades, speculations, or decisions made on the basis of any information found on this channel, expressed or implied herein, are committed at your own risk, financial or otherwise.

S%P DROP AND GIVE ME 50....50K PLEASE LOLBias is BEARISH!
Hear me out tho lol!
First, we never predict; we estimate and wait! Price will tell us where it wants to go. Based on my estimate, we have big news this week that does not look very positive and could negatively affect American businesses and stocks, potentially leading to central sell pressure in the market. That, paired with no significant pullback on the D/HTF's, makes me estimate we should have nice sell ops.
4H Golden zone is around 6,809-50% and 6,801-.618%! (Great buy bounce area)
after that we have some IPP'S (important price points)
6,840 If passed and closed above we can see move to even HH's!
or
If we see a rejection to 6,801 price area we can see a dump taking out session IPP's and pushing to lower FVGs! (what I want lol)
so we are going to let the market play, while we wait....and GET PAID!!
GDluckThisWeek!

Tuesday, Oct 21st Weekly Forecast UPDATES!Welcome to the Weekly Forecast Updates!
In this video, we will analyze the following markets: DXY, EURUSD, GBPUSD, NASDAQ, S&P500
Enjoy!
May profits be upon you.
Leave any questions or comments in the comment section.
I appreciate any feedback from my viewers!
Like and/or subscribe if you want more accurate analysis.
Thank you so much
Disclaimer:
I do not provide personal investment advice and I am not a qualified licensed investment advisor.
All information found here, including any ideas, opinions, views, predictions, forecasts, commentaries, suggestions, expressed or implied herein, are for informational, entertainment or educational purposes only and should not be construed as personal investment advice. While the information provided is believed to be accurate, it may include errors or inaccuracies.
I will not and cannot be held liable for any actions you take as a result of anything you read here.
Conduct your own due diligence, or consult a licensed financial advisor or broker before making any and all investment decisions. Any investments, trades, speculations, or decisions made on the basis of any information found on this channel, expressed or implied herein, are committed at your own risk, financial or otherwise.

Weekly Outlook: XAUUSD, #SP500, #BRENT for 20-24 October 2025XAUUSD: BUY 4255.50, SL 4225.00, TP 4410.00
Gold starts the new week at elevated levels: the spot price holds near $4,255 per ounce as markets continue to expect further Federal Reserve rate cuts and as long-term U.S. Treasury yields ease. Ongoing central-bank purchases and a recovery in investment demand add support: diversification of reserves and the metal’s protective role remain in focus, while trade and political tensions between the U.S. and China keep interest in safe assets alive.
Key drivers over the week include the tone of Fed remarks and U.S. inflation releases, the direction of bond yields, and news on global gold flows. Risks for long positions are tied to a slower-than-expected pace of policy easing and a firmer dollar, but steady official buying and elevated uncertainty still shape a constructive fundamental backdrop.
Trading recommendation: BUY 4255.50, SL 4225.00, TP 4410.00
#SP500: BUY 6660, SL 6640, TP 6900
U.S. equities begin the week supported by a move in 10-year Treasury yields below 4% and a heavy earnings calendar. Consensus for Q3 profits remains constructive, and investment in AI and related equipment continues to underpin demand for the largest names. By Friday’s close the benchmark hovered around 6,664; futures point to a neutral-to-positive start while investors watch this week’s macro releases.
The balance of factors favors moderate upside: easing financial conditions, stable profit expectations, and no clear signs of a sharp demand slowdown in key sectors. Counter-risks include softness in some cyclicals, occasional stress in credit, and geopolitics. In this setup, buying on modest dips with tight risk control looks reasonable.
Trading recommendation: BUY 6660, SL 6640, TP 6900
#BRENT: SELL 61.00, SL 61.30, TP 55.00
Brent enters the new week near $61 per barrel. The near-term backdrop weighs on prices: agencies and banks flag faster supply growth in 2025–2026, including as OPEC+ curbs gradually unwind and non-OPEC output rises. At the same time, demand forecasts are turning more cautious amid slower global growth and structural trends such as improved efficiency and transport electrification. Trade frictions between the U.S. and China and headlines on U.S. inventories add to buyer caution.
Overall, the supply-demand balance tilts toward surplus, limiting upside unless fresh supply disruptions emerge. Risks to short positions include sudden outages, signals of deeper OPEC+ restraint, or a quicker-than-expected demand rebound in Asia. The base case is continued downward pressure with brief news-driven rebounds.
Trading recommendation: SELL 61.00, SL 61.30, TP 55.00

BUY SPX - S&P500- Profitable trade opportunity!Based on our deep analysis we can see that SPX (S&P500) will head to the upside. Great time to BUY - it is currently in a uptrend and is holding on to powerful support levels. The next target is the resistance level to the upside. This is a great low risk high reward trade. BUY NOW!

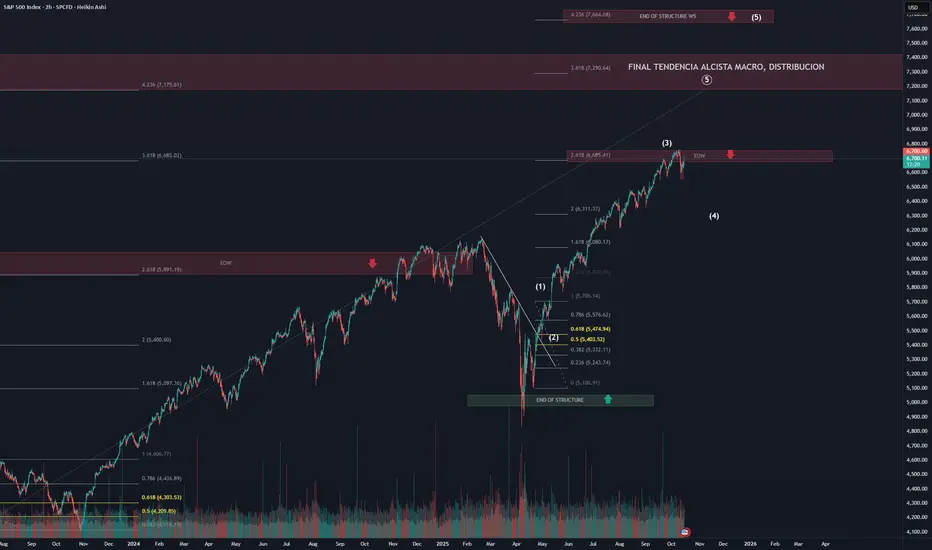
SPX Bullish Trend / Elliot analysisOur analysis of this index suggests that we are currently in the development of a Wave 4 (W4) within the last bullish substructure of the macro fifth wave, where, in the long term, we could potentially see the end of the trend between the 7100 and 7600 levels.
At the moment, the price appears to be moving within the final substructure, which seems about to begin a Wave 4 (W4) correction.
💡 This is just my opinion — always remember to do your own analysis!
From 'pullbacks' to a 'correction' (S&P 500)Setup
Still Bullish. Be patient for entry near end of the corrective move lower
Evidence..
-Trend is up, no top pattern
-No longer 'dips' to 50 DMA, now into a 'correction' with possible move towards 100 DMA
-Large bearish engulfing weekly candle
-The 4 month old trendline has broken.
-RSI has dropped under support - but not yet characteristic of bearish trend by going oversold
-Price has landed at a demand zone under 6500 (could rebound from here)
Signal
Looking to go long on another test of the demand zone OR
at next supports found at matching lows of 6350 then 6200

EURJPY | MarketoutlookThe policy divergence between the US Fed and SNB supports the pair at lower levels.
Jobless claims dropped to 227,000 for the week ending October 19, down from 242,000 the week before, suggesting some stability in the labor market. The four-week moving average rose by 6,750, reaching 231,000, which indicates that jobless claims are still showing fluctuations despite the recent decline.
The S&P Global Flash U.S. Manufacturing PMI increased slightly to 47.8 in October, up from 47.3 in September. However, this still shows that manufacturing activity is contracting for the fourth month in a row. On the other hand, the Flash Services PMI rose to 51.5, indicating modest growth in the services sector, which is important since it makes up a large part of the U.S. economy.

SPX - Bearish ScenarioContinuous three point touches along a down trend line can be seen in red
Right now price may experience this third touch on its current down trend in red.
From there I think it collapse may follow down to levels in 02 and 08 or a bit above them. (price could recover at the red line along the timeframe when covid was occurring.)
Not sure when it will occur but its going to.
Weekly timeframe

$NDX $SPX $BTC All Close at Weekly ATHPretty cool to see ₿itcoin, S&P 500 and Nasdaq all close the week at new ATH 🥳
And now we have $325B about to be dumped into the US economy in FY26Q1 along with more rate cuts on the way.
Next time you speak to a bear, reply with FU HIGHER 🚀

Bitcoin vs S&P 500 – Ratio Signals StrengthBitcoin vs S&P 500 – Ratio Signals Strength 🔍📊
This chart shows the BTCUSD/SPX ratio — in simple terms, how Bitcoin is performing relative to the S&P 500. And what do we see? Clear, technical strength .
🔑 Key Observations:
• BTC/SPX is breaking out from a bullish flag structure just above the 17.30–17.48 region
• If this breakout holds, the technical target is ~26.37 — the top of the multi-year channel
• Historically, breakouts from similar zones triggered explosive upside — even during equity pullbacks
🧠 What does it mean?
Even if the S&P 500 corrects (OR LIKELY NOT) Bitcoin can still outperform, not necessarily by skyrocketing, but by falling less, consolidating, or simply staying resilient . That’s the edge of analyzing ratios, not just price.
Macro-wise, Buffett Indicator shows equities are overvalued . If capital rotates out of stocks, BTC could be a top-tier beneficiary — especially if it keeps showing this relative strength.
💬 Final Thoughts:
• Don’t analyze BTC in isolation — compare it to what it competes with
• Ratios give clarity — this one says Bitcoin’s trend vs stocks is up and strong
• Strong support sits at 14.23 , and there's open space toward 26.37 — a zone worth watching
Are you tracking this breakout? What’s your plan for Q4?
Food for Thought 🍃
“Stocks are at all-time highs. Is this the PERFECT time for big money to hedge into Bitcoin? Likely yes.”
One Love,
The FXPROFESSOR 💙

SP500 Bearish Outlook With Tight SLBearish Technical Reading
• The index is currently trading near 6,728 after a strong recovery rally.
• Nearest hypothetical major resistance: 7,125 (weekly supply + marked zone).
• Nearest key support: 6,150 – 6,170 (structural pivot, last defended level).
• Breakdown from this zone could trigger a deeper correction.
________________________________________
Bearish Trade Setup (Tighter Levels)
• Entry: Short around 6,700 – 6,750 (current resistance zone).
• Stop Loss: 7,150 (above weekly resistance to avoid fakeouts).
• Take Profit 1 (TP1): 6,150 – 6,170 (structural demand, first bearish magnet).
• Take Profit 2 (TP2): 4,820 – 4,850 (major demand, previous accumulation zone).
________________________________________
Logic Behind Levels
• Stop Loss 7,150 is placed above the marked resistance — if price breaks and holds above, bearish thesis weakens.
• TP1 at 6,150 matches the exact key support drawn on your chart — logical place to secure partials.
• TP2 at 4,820 aligns with historical strong demand and would only be targeted if shutdown-driven fear prolongs and selling accelerates.
________________________________________

S&P 500 – Steady Uptrend Within Rising ChannelThe S&P 500 continues to grind higher within a well-defined rising channel, holding above both the 50-day SMA (6,486) and the 200-day SMA (6,023), which reinforces the broader bullish structure. Price action has respected the channel boundaries since May, with the recent bounce off the mid-line suggesting buyers remain in control.
Momentum indicators support the bullish bias:
MACD is positive, showing steady upside momentum.
RSI sits near 68, not yet overbought but approaching elevated levels, hinting at a possible test of the channel’s upper boundary.
As long as price holds above the 6,600 zone, the path of least resistance remains higher, with the channel top near 6,800 as the next potential target. A break below the channel support, however, could trigger a corrective pullback toward the 6,450–6,500 area, aligning with the 50-day SMA.
Overall, the trend remains bullish, with dips likely to be treated as buying opportunities while the channel structure holds. -MW

Gold (Rose ) and SPX ( Jack ) relationship. 1/Oct/25XAUUSD ( Rose ) and SPX ( Jack ) since dunno when they are in closed relationship on "Titanic Ship".. But.. That "shxx" is obviously tilting heavily into 1 side.untill early/mid Oct at 7000 and 4000 nautical And when.Jack and Rose probably have to perform "you jump I jump"..But after that they will "ride" different "ships"..Where one still on sinking ship , the other is riding into "Titanic" sky ship"...

S&P500: More Upside Likely Before PullbackThe North American Mass Index kicked off the new week with some momentum, extending its climb within the ongoing magenta wave (3). For now, we anticipate this upward trend could continue before reaching a new high. Afterward, we expect a pullback as part of the subsequent wave (4), likely bringing the index into the magenta long Target Zone between 6,283 and 5,781 points. In our view, this price range offers attractive opportunities for long positions, as wave (5) is expected to follow—potentially pushing the index significantly higher and completing the larger blue wave (III). To protect newly established long positions, a stop can be set 1% below the lower boundary of the Target Zone.

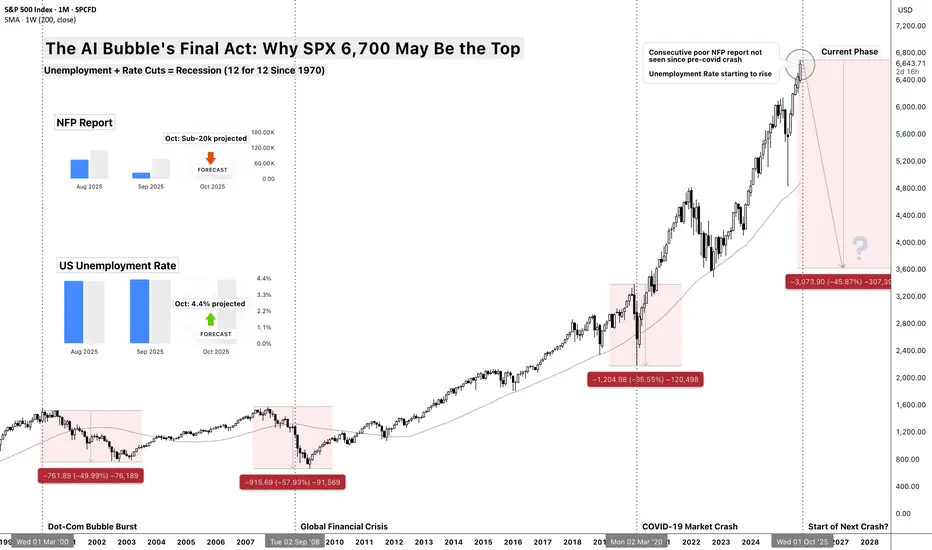
The AI Bubble's Final Act: Why $SP:SPX 6,700 May Be the TopThe AI Bubble's Final Act: Why SP:SPX 6,700 May Be the Top
Unemployment + Rate Cuts = Recession (12 for 12 Since 1970)
The Death Cross Pattern
There's a simple rule that's worked for 55 years: When the Fed cuts rates while unemployment is rising from cycle lows, recession follows within 12 months - every single time.
Think of it like a doctor taking your temperature while giving you painkillers. The medicine might make you feel better temporarily, but if the fever is rising, something serious is wrong underneath.
Current Status:
✅ Fed just cut rates ECONOMICS:USINTR (September 2025)
✅ Unemployment ECONOMICS:USUR rising from 3.4% cycle low
✅ TVC:SPX at all-time high ($6,700)
Historical Result: 12/12 times = recession + 35% average equity crash
The Precedent: Crisis Follows a Script
2000 Dot-Com Bubble:
Setup: TVC:SPX at ATH (1,550), ECONOMICS:USUR unemployment at 3.9%, ECONOMICS:USINTR Fed starts cutting
Crisis: Technology "revolution" story breaks down
Result: -49% crash over 2.5 years
Recovery: 7 years to new highs
2008 Financial Crisis:
Setup: CBOE:SPX at ATH (1,576), ECONOMICS:USUR unemployment at 4.4%, ECONOMICS:USINTR Fed starts cutting
Crisis: Housing/credit bubble bursts
Result: -57% crash over 1.5 years
Recovery: 5 years to new highs
2025 AI Bubble:
Setup: SPREADEX:SPX at ATH (6,700), ECONOMICS:USUR unemployment at 3.4%→4.2%, ECONOMICS:USINTR Fed starts cutting ✅
Crisis: AI productivity story meets employment reality
Projection: -35 to -45% crash over 18 months
Recovery: 3-5 years (faster due to tech infrastructure remaining)
The AI Employment Paradox
The Productivity Mirage
Wall Street celebrates AI boosting productivity, but here's the paradox:
productivity gains = job losses = reduced consumer spending = recession.
Think of it like a factory owner celebrating a new machine that replaces 100 workers. Great for margins, terrible for the local economy when those 100 families stop spending.
Jobs ECONOMICS:USNFP at Risk by Sector:
Customer Service: 2M jobs (chatbots replacing agents)
Software Development: 500K jobs (AI-assisted coding reducing teams)
Transportation: 3M jobs (autonomous vehicles accelerating)
Administrative: 4M jobs (AI handling routine tasks)
Content Creation: 1M jobs (AI writing, design, video)
Total Impact: 10+ million jobs facing displacement over next 2-3 years
Why This Time is Different?
Unlike previous automation waves that created new job categories, AI is targeting cognitive work directly. A factory worker could become a service worker, but what does a displaced knowledge worker become?
Valuation Extremes: 1929 Levels with 2025 Leverage
Current Valuation Metrics:
Shiller CAPE: 38+ (higher than 1929's 33)
Buffett Indicator: 195% (market cap/GDP, historical average 85%)
Price/Sales: 3.3x (vs 1.4x historical average)
Forward P/E: 23x (on optimistic AI earnings assumptions)
Valuations today exceed 1929 by most measures - but with far more leverage embedded in the system. If 1929 was a valuation bubble, 2025 is that bubble layered with derivatives, corporate debt, and passive flows.
The Leverage Layer:
Margin Debt: $1.023 trillion (record high)( as of July 2025, ycharts )
Corporate Debt/GDP: 85% (vs 45% in 2000)
Derivatives Exposure: $700 trillion notional ( as of June 2025, BIS semiannual data )
ETF/Passive Flows: $1.5 trillion annually (forced selling on reversals)
When liquidity stress hits, derivatives amplify shocks - notional exposure dwarfs underlying assets.
Think of today's market like a house of cards built on a trampoline. Even small bounces can bring the whole structure down.
Technical Breakdown: The Charts Don't Lie
Major Warning Signals:
Market breadth has deteriorated from 90% in Q4 2024 to ~60% today,
Defensives led earlier in the year,
TVC:VIX Volatility’s floor has shifted higher
Credit risk appetite (HYG/TLT) is stretched.
Together, these signal fragility beneath the index surface.
The Three-Stage Technical Collapse:
Stage 1 - The Warning (Now-Q4 2025):
Current Level: $6,700
Initial Support: $6,200 (previous resistance)
Character: Failed rallies, rotating leadership, "healthy correction" narrative
Target: 5,800-6,000 (-10 to -13%)
Stage 2 - The Cascade (Q4 2025-Q2 2026):
Breaking Point: Below 5,800 triggers algorithmic selling
Character: "Buy the dip" stops working, margin calls begin
Target: 4,800-5,200 (-25 to -30%)
Stage 3 - Capitulation (Q2-Q4 2026):
Final Flush: Panic selling, ETF redemptions
Character: "Markets will never recover" sentiment peaks
Target: 3,700-4,200 (-35 to -45%)
The Catalyst: When Reality Meets Hype
Q4 2025 Earnings Season - The Reckoning
Companies will face impossible questions:
"You spent $50B on AI - where's the revenue growth?"
"Productivity is up 20%, why are you laying off workers?"
"If AI is so transformative, why are margins declining?"
The Employment Data Domino Effect:
October/Nov NFP: First print above 250K unemployment claims
November Consumer Spending: Down 2%+ as job fears spread
December Holiday Sales: Weakest since 2008
January Layoff Announcements: Tech companies start "right-sizing"
Think of it like the moment in 2000 when investors finally asked: "How exactly does Pets.com make money?" or 2007 when they wondered: "What's actually in these mortgage bonds?"
Sector-by-Sector Breakdown
Technology (-50 to -70%)
AI hype stocks get destroyed first
Software companies face declining growth + competition
Semiconductor cycle turns negative
Biggest Losers: NVDA, MSFT, GOOGL
Consumer Discretionary (-40 to -55%)
Unemployment hits spending immediately
High-end retailers crushed first
Auto sales collapse with higher rates
Biggest Losers: TSLA, AMZN, NKE
Financials (-30 to -45%)
Credit losses surge as economy weakens
Interest margin compression
Commercial real estate exposure
Biggest Losers: Regional banks, non-bank lenders
Relative Outperformers (-15 to -25%)
Utilities, Healthcare, Consumer Staples
Companies with genuine AI cost savings
High-dividend yielders in low-rate environment
Key Dates and Catalysts
October 2025:
Jobs report (first warning?)
Q3 earnings disappointments
Fed meeting (dovish pivot?)
November 2025:
Election aftermath volatility
Black Friday sales data
Thanksgiving week low-volume crashes
December 2025:
Year-end tax selling
Institutional rebalancing
Holiday retail reality check
Q1 2026:
Layoff announcements surge
Earnings guidance slashed
Credit events begin
The Recovery Setup
Why This Crash Creates Opportunity:
Valuation Reset: P/E ratios back to historical norms
Weak Hands Flushed: Margin traders eliminated
Government Response: Fiscal + monetary stimulus
AI Infrastructure Remains: Real productivity gains continue post-bubble
Recovery Timeline:
Bottom: Q4 2026 around 3,700-4,200
Initial Rally: 30-50% bounce over 6 months
New Bull Market: Begins 2027 with stronger foundation
New Highs: 2029-2030 timeframe
Risk Management Rules
This Analysis Fails If:
Fed pivots to massive QE before crisis
Fiscal stimulus exceeds $2 trillion quickly
AI productivity gains offset job losses faster than projected
Geopolitical crisis overrides economic fundamentals
Probability Assessment:
60%: Correction to 4,800-5,500 range (25-30% decline)
25%: Major crash to 3,700-4,200 range (40-45% decline)
15%: Continued melt-up through 2026 (soft landing achieved)
Conclusion: The End of the Everything Era
At SPX 6,700 with unemployment rising and the Fed cutting rates, we're witnessing the final act of the 15-year "everything bubble."
The AI revolution is real, but like the Internet in 2000, revolutionary technology doesn't prevent financial gravity.
The bubble is ending exactly like the previous ones - with everyone believing "this time is different" right until it isn't.
Smart money is already rotating defensive. The question isn't whether a correction is coming - it's whether you'll be positioned for it.
S&P500 CHART UPDATE !!S&P 500 Analysis
The S&P 500 is trading near 6,650, moving strongly within its ascending channel.
Support: 6,400 – key level to hold for bullish momentum.
Resistance: 6,800 – a breakout could open the door toward 7,200.
The trend remains bullish, and staying above the midline keeps upside potential intact.
A breakdown below 6,400 may signal a short-term correction.
