XMR 2.6K USD Q4 2019Monero ($XMR) is a secure , private and untraceable cryptocurrency which is used often on the dark web as a means of exchanging value.
Monero functions like Digital Cash . And it seems to follow Bitcoins original rise to glory , as Bitcoin was used on Silk Road and multiple other markets back in the early 2010's. Monero is untraceable , which governments fear. If Governments like France encourage and adopt counter measures to stop Monero being used , it will only encourage others to use it. This will drive more mainstream adoption pushing up the price of Monero. (It seems odd but if you make something illegal , it actually encourages the use of it. Example when marijuana was facing prohibition , it was "Illegal" and "Mysterious" which made people want to do it more.) They cannot stop a decentralized protocol which exists outside of their control.
The banks and governments it seems , will want to buy as much of this cryptocurrency , they can to ensure that they can control the supply of Monero and thus be able to "Slow" and or try to stop Monero from progressing further in its route. (which of course , they will pay a premium to do so)
A lot of people have vested interests in maintaining the network , and they will not let the network fall.
Monero is backed by many PhD's in cryptography , which has MANY research papers on the Cryptonote Protocol , Ring Signatures and other use cases of Monero.
Some coins such as $ZCash offers a "Trusted" setup , which is essentially , an accountant who has access to your offshore bank account. (And 20%)
Monero is a coin , which is PRIVATE BY DEFAULT. And doesn't have the "Trusted" Set up. Only you control your funds. No one else.
Of course 2.6k is a conservative speculation... But i'm assuming Bitcoin goes to $100,000USD by Q4 2019.
Which would make Moneros Value 0.026BTC or $2600USD by Q4 2019.
Ethics
Remember that money is simply a tool , and can be used for both good and evil. If someone gave you 5k , You could pay your rent or You can buy your kids some food. Or you can buy a gun. It's all up to you as an individual. Monero can be used for good and evil , but at the end of the day , it is secure and private and untraceable by default and it will rise in 2019.
Speculation

Brexit - is this the end? A look back at the market in the run up to Brexit, With the countdown about to strike exactly 10 days until the deadline what are your thoughts on the market.
This chart is not financial advice and is only a look back at the lead up to Brexit.
Below is some links to large news story's that came out that had effects on the markets.
----- References On Chart To News-------
Fig 1 - 7th OCT
Ref - Money CNN - pound-flash-crash-currency-brexit
The British pound suffered a jarring flash crash on Friday, nosediving more than 6% against the dollar in a matter of minutes.
The shock move in early trading in Asia left investors stunned and analysts blaming computerized trading programs for intensifying the dizzying drop.
"It was just another quiet day in Asia, and then, Bang! All the lights went red," said Matt Simpson, senior market analyst at ThinkMarkets in Singapore.
The pound had already sunk to a fresh 31-year low of around $1.26 on Thursday over deepening concerns that the U.K.'s split from the European Union will hurt the country's economy. Strategists had widely forecast it would go lower, but not as rapidly as it did on Friday.
A plummeting pound could boost British exporters, and companies that make most of their money overseas, but it is pushing up prices of imports such as the iPhone 7 and fuel for airlines. It's making it more expensive for the government to borrow, and putting the squeeze on Brits living abroad.
The flash crash yanked the British currency down to near $1.18, according to Factset. It recovered most of the losses soon afterward to trade around $1.23.
Why the U.K. pound is still crashing
"You're seeing six months of forecasts in less than six minutes," Simpson said. Earlier this week, he had forecast the pound would drop to $1.20 by April.
Experts speculated that that the extreme drop could have been caused by computer trading programs, human error or a big market player making a very large move.
"Trying to find a trigger can become like looking for the snowflake which caused the avalanche," said Simpson. "All we know for certain is that there will be a lot of investors nursing some very large losses from all of this."
pound dollar flash crash chart
Jeffrey Halley, senior market analyst at online broker Oanda, said he believed the crash was sparked by reported comments from French President Francois Hollande calling for tough Brexit negotiations with the U.K.
The remarks were enough to push the pound below the key level of $1.26, leading to "an aggressive sell off in a very thin 'twilight' market," Halley said, referring to the time of day when U.S. traders are winding down and their Asian counterparts are just getting started.
The initial fall set off waves of computer-driven selling that deepened the plunge, he said.
Some market watchers said the trading was so chaotic that different data providers gave different numbers for the pound's lowest point. One put it as low as $1.13, according to Halley.
The pound has taken a beating this week after British Prime Minister Theresa May said Sunday that the U.K. would begin the formal process of leaving the EU by the end of March. The exit will happen two years later, and the U.K. will give priority to controlling immigration.
Related: $1.3 trillion at stake in Brexit breakup
European leaders have made clear that if Britain does not allow free movement of EU citizens across its borders, it will lose some of its rights to access the free trade area.
So investors are fretting again about two key issues: British exporters may find it harder to compete in Europe, and the country's banks could lose the ability to do business freely across the region.
The U.K. economy has proved more resilient than expected in the wake of the vote to leave the EU, with the sharp fall in the value of the pound and a big injection of money from the Bank of England helping limit the fallout. But some analysts are predicting that the pain is far from over.
uk trade click image
The pound is now down more than 16% since Britain voted to leave the EU.
Halley noted that even after the British currency clawed back some of its losses Friday, it was still down roughly 2% from the New York close. That's a significant move in foreign exchange markets and could suggest further weakness lies ahead.
"It does point to a revisiting of these lows at some stage," Halley said.
FIG 2.
Search Google
the-great-british-brexit-robbery-hijacked-democracy The Guardian
FIG 3.
Search Google
brexit-aftermath-uk-inflation-data-for-april-2017-5 Business insider

"Risk Management" (Traders) vs "Right or Wrong" (Analysts)In this video I explain you with a real time trading context, what the major difference is between a trader and an analyst. Because that's how you'll easily make the difference between the one that actually trade and manage its risks, and the one that just talks and do nothing ! Always remember that if you want to learn how to analyse a market, the follow analysts ! If you want to learn how to trade and manage the risks, follow traders... ! Because being right or wrong is nothing but bullshit in a speculative prospective !
Bests,
Phil

Seems like another speculation. History repeats itselfI still think that GB is not going to leave the EU. I think Great Britain made good speculation for creating Brexit with 51% to 49%. This is how London is going to create some extra money from normal people. Are they are going to leave or not? Maybe it's time to buy ?!? :) Head and Shoulders pattern.
P.S. History repeats itself.

BNB will fall!This is a BNB/USDT speculation. The bearish trend in BTC is still going, while there are signs of a reverse head and shoulder pattern, there is still a high change that BTC will fall because the bearish trend is strong.
BTC has a lot of influance on the price of alt coins. Because there is a high change BTC will bottom again, that there is a also high change BNB will fall down with BTC.

Inverse H&S to be completed in the future! Hello!
Here is my opinion of gold's probable future price movement.
The first leg down will happen because of the fake rally in the traditional stock markets now because everyone is urged to buy and are guaranteed a "safe 2019" following the latest news articles in the financial markets, i speculate this because inversely that is roughly where the supply area is at if looking at S&P 500 and Nasdaq 100 which leads the way for all the market.
When orders will be hit equally same will happen in gold forming the right shoulder and a surge upwards piercing the current area of its supply (1300) meaning a small accumulation before continuing and a completion of the inverse H&S pattern seen as a bullish sign later breaking out towards 1360-1380.

AMZN: Topping Formation Incomplete with VolatilityAMZN has a topping formation which is incomplete at this time. Incomplete means that the stock has not broken through the strong nearby, short term technical support level YET. It may or may not. The stock can always shift sideways as BA did, as an example, to pattern out the excessive stock price uptrend created by speculation. Trading range corrections, as opposed to down-trending corrections, take much longer because the stock price remains well above the company’s fundamental value. The financials have to catch up to the price per share. For AMZN, there is also rotation, aka lowering of stock shares held by the Giant Dark Pools, evident in studying the price trend against the Accumulation/Distribution indicator. This increases the risk of sudden downside action. For now, buybacks and smaller funds buying on a dip are holding the stock up. Watch for increased volatility as a precursor to more downside action.

Bitcoin gained 215,000,000% by the 10 year anniversary.Recently Bitcoin has celebrated its’ 10 year anniversary. On the 31st of October 2008, a person, or a group of people under the name of Satoshi Nakamoto published a “Bitcoin P2P e-cash paper”, which can be found on bitcoin.org
It was introduce at a very specific and perhaps a perfectly right time. Back in 2008 world was going through a financial crisis, demanding an alternative to the USD. And here you go, Bitcoin appeared out of nowhere. Whether it was created by a single person or a group of people, it seems that this was a carefully calculated event.
On the 17 Mar 2010, the now-defunct BitcoinMarket.com exchange is the first one that starts operating. At a time it was priced at $0.003 for 1 Bitcoin. Currently BTC/USD rate stands at $6450, and that is a 215,000,000% growth! Clearly, Bitcoin has its use, and perhaps not so much as just being the first cryptocurrency, but maybe the best candidate for being the alternative to the world currency - the US Dollar.
After a short “Happy anniversary Bitcoin” intro, time to move on the the current price action, which might show us upcoming price action scenarios.
According to our previous idea, yesterday BTC/USD has rejected our projected resistance area near $6500. At the very same time the downtrend trend line, along with the 200 Moving Average, also were rejected. This makes $6500 - $6530 a very strong resistance. As price has bounced off it, there won’t be too many buyers, which are most likely are waiting for the break above. But when/if it breaks higher, it could trigger a massive wave buyers stepping in, pushing price up. Nearest resistant area is seen between $6840 and $6900, which if overtaken, can trigger even higher demand for BTC.
Nevertheless, the resistance is being respected, which means that buying orders, sitting above the $6530, haven’t been triggered yet. Therefore, at this stage BTC/USD will most likely continue the range trading, between $6300 support and $6500 resistance. Break below $5300 can be a bearish signal for the BTC, and the risk of the price drop, down to $6100-6200, will become very high.
Perhaps it is worth to wait and see, as Bitcoin approaches the potential decision making point, which is the nearest Fibonacci price cycle. It starts on the November 8, and maybe then the breakout occurs. Most likely, investors are waiting for strong move in price, accompanied by a heavy trade volume, and it could happen in just 3 days from now.
In 10 years Bitcoin price has increased by 2,150,000 times, and it is extremely interesting to follow the direction of BTC in the next 10 years. The technology introduced by the Bitcoin is simply amazing. Considering that one day BTC might become a global currency, hard to imagine how far up it can clime.

Era of decentralization is coming so is boom of STEEMThis is pure speculation & portion of magic. Trading this is very risky and not recommended .... (Whales be like jokes on you)
Facebook public problems to be revealed on the market date, then STEEM will take a big step into digital world of social media worldwide
-Watching slow collaps of stocks and expecting big bounce in crypto
-Expecting 2019-2022 to be very bullish for Crypto
** This is highly speculative analysis. Trade on your own risk as this is not a financial advice. **

LET INSPIRE FROM SPECULATIVE MOUVEMENTJust looked at IPO in switzerland this year. After a speedy scroll I was captured by two projects. Medartis and Sensirion.
Sensirion just mooned and if I had a little more time for stock market it was a clear buy for me.
Now let analyse Medartis.
IPO are tricky. There are differents movement after an IPO and you can enter in a golden egg goose but you can easily be trapped in a bad affair.
Now we can identify some important similarities.
let look at sensirion right.
1) post IPO speculative push
2) overbought corrective sell off
3) shy afflux of investor with a growth within the channel
4) break out of the top.
5) consolidation on the old top
6) explosion $$$$
left Medartis
1-4 are done.
felt 5) consoldation and 6) explosion
Now. I noticed it yesterday and I was concerned to buy or not.
Now is approaching the superior resistance of the channel and is inside a small rising wedge with some bearish divergence on indicators on higher timeframe.
So I decided to stay out and buy a pull back, and I will protect me inbetween with a stop above the channel.
Will it work what I'm telling you?
Maybe. There is a clear difference between this two ideas
Sensirion growth so fast in less time, as sign of strong interest. Medartis is growing but more slowly.
Even if this two movement are similar you can see that in august there were 3 big spike (first before the break out), signaling that someone passed big buy orders.
Medartis is more shy but the break out put him in an interesting situation and the pullback would be for me a clear buy opportunity that I won't miss. From there reevaluation of what happens with easy to place stop loss.
High Reward/Risk ratio
BIO

Phase 2 exploration October 1stPhase 2 exploration begins October 1st, and the speculative interest will be increasing.
After trading down on relatively unsurprising news about the drilling done on the western trend, we are setting up for a speculative rally for Phase 2 drilling at the eastern trend at Moosehead.
The 10,000m Phase 2 drilling program will test the area on the eastern trend, where MH18-01 gave the intercept of 11m of 44g/t gold and consequently gave Sokoman Iron Corp some TSXV:SIC ridiculous trading volume and a rapid 1000% increase in share price.
This is an easily accessible area in New Foundland, screaming for mining jobs. While we are far from delineating an actual mineable resource, we are also at a very small market cap where a lot of the hype investors have sold off, and more patient long-term investors have grabbed shares.
On the technicals, we seem to have touched a bottom twice at 0.15 and 0.145.
With an imminent catalyst coming up - 10,000 meters of drilling at the highly prospective eastern trend - there will be serious speculative interest the coming weeks.
Confirmation of the mineralization from MH18-01 meanwhile can take us far beyond what we have seen earlier.
Remeber this is exploration, results are not guaranteed, but speculative interest is definitely going to pick up.
Suggested trade before drill results:
0.15-0.23 BUY
0.25-0.40 SELL
And keep some shares for the assay results in October, that's where it can get really interesting for SIC.

XRP Possible Price Influences
Listing on Coinbase
SEC declaration of its legal status
Production deployment of XRapid
Announcement by central banks of backing of stable coin on XRP ledger
XRP ETF
XRP used by SBI Holdings for FOREX settlement
Announcement by major institution of institutional Custodianship for digital assets
CODIUS deployment
Ripple announces production level product for derivatives trading and settlement using CODIUS smart contracts and XRP ledger
BTC bull run with trickle down crypto economics
Every single one of them could in my opinion result in price going up.

Bitcoin daily.EW scen 1: Yellow-Green
EW scen 2: Light blue= Dark blue
bearish divergence on the daily, but still with room on the upside.
goodluck trading everyone.

Great Analysis Bitcoin (SEE!)Hello my name is Gijs,
this is my first project. This is my speculation of Bitcoin.

Last look at it from original 1 hour candlesIf I were a gambler..... Yeeah right Im not kidding anyone here....
Im convinced its Pooo Pooooo HERE, Down to $5400ish is 1st stop. Yes this is my Final Decision... LOL What was the name of that stupid A** show on FOX I think...?

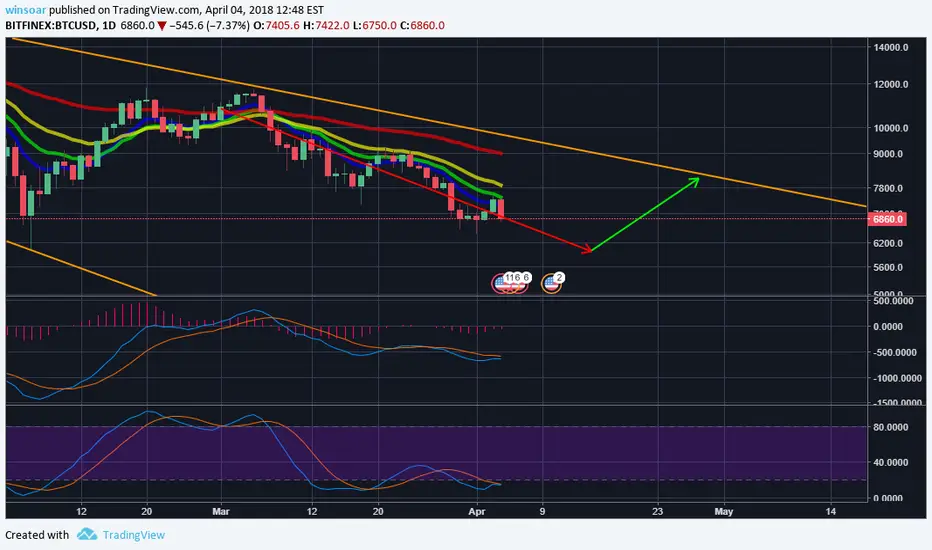
Bitcoin to drop to $5,980 before rebounding to $8,073I forecast that the price of bitcoin will drop to the previous support level of around $5980 USD, before gradually making its way back up to the resistance line of around $8,073 where the price will then change direction again unless the bulls can break through this line of resistance, in which we could see a return to a bull market.
Like this post if you agree, and follow for more tips like this.
NOT FINANCIAL ADVICE!
Bitcoin repeats itself..Or maybe it doesn't..So... many people have varying opinions on Bitcoin and the whole cryptocurrency market in general. Some say long, others say short, maybe its on a bull run, maybe its a bull trap. Its all relative to what your think is a good return rate during some period of time. If Bitcoin mimics what it did back in late 2013 and early 2014 then its value should drop some similar percentage from back then. This would be about ~85% (Note: I am not including the data from the Feb 9/10 flash crash within the 85% decrease). Compared to its 20k price tag an ~85% drop means BTC hits about ~3k, which is why many people are expecting 3-4k as a range. That is it and it is a done deal get ready for a massacre. But many think it will not hit the 3-4k because there is too much mainstream news regarding BTC. Which brings me to speculation, and a lot of it... All of crypto thus far is highly speculative. There are very few coins if any that are actually currently in use for practical applications. I definitely don't think any of this cryptocurrency is going away, however we all know many, and boy do I mean many..., of these coins are going to fail. Their called shitcoins for a reason! So now for the speculative piece. The cryptomarket this year will flourish, not now, but more likely towards the second half of the year. And here's why (again this is my take and yes it is speculation with some facts thrown in); This year many exchanges (Coinbase for one..) are allowing or working with banks to provide many different assets (ETF's, Stocks - in the cases of GBTC and BTSC, and Futures contracts). This means money will roll in. It won't be right away but it will. But here's the BIGGEST problem with the market right now: BITCOIN. Bitcoin is the problem.. somehow, even though it is unintentional, when BTC goes down it takes ALL of the other coins with it. When BTC goes up it dries up all of the Alts and then they only seem to flourish when people cash out of BTC and go into these other coins. Coins are not yet independent of each other when it comes to price. I am very bullish on BTC and the whole market in general but I think until exchanges can offer alts/fiat pairs for at least the top 50 coins or any coin over $250mln market cap this won't change. So now what.. Like I said earlier: " Its all relative to what your think is a good return rate during some period of time". If people want quick money, BTC is NOT the answer, alts and shitcoins are :). This year or next year, no one knows when, but at some point there will be a coin that (like last year) went up 1,000,000% + increase. Thats right 1mln+ percent increase (both XVG, and NANO(rebranded from Raiblocks). This means you are getting a 10,000x return on your investment. That's fantastic! But rare... However the chances of hitting it are better than most think. If you put $5 into every single coin that comes out onto the market which as of writing this is 1543 different coins then you would need $7715. Lets round to 8k just because. If any 1 of them hits 1mln % increase then your $5 investment becomes $5 * 10,000 = $50,000. Wow.. A profit of 42k.. more than 5x your initial investment! But most investors take pride in retaining wealth when they have already created it. Most investors want high rewards and no risk. They wouldn't trust random alts or shitcoins or would consider it too much work for a chance at the lottery. They prefer safe coins (BTC, ETH, LTC, XRP, etc) that can still make 10-100% gains easy! This is why I am bullish on BTC, Investors are waiting and itching to get into crypto. Many older investors don't understand crypto however all of them understand how markets and TA work. Buy low, sell high. Common concept. Many banks are waiting for BTC to be more accessible and considered safe by SEC/CFCT regulations and even more are waiting to be able to invest directly in the alts without having to go through BTC. This year we will see a huge market cap increase and more company partnerships.

BTC Extrapolation for 2018 and 2019This considering only bullish, not any hyper-bullish market moves.

IGNIS likely forming the preferred pump formation C&H#beyondTA
If you look back recently at coins that had solid pumps, like NULS, ADA, NEO(see first pump back in may/june), MANA, what do they have in common?
A cup and handle formation right out the get go with no resistance above the current price line. traders crush these patterns and overinflate their values.
The longer term the formation the better.
Now, IGNIS was created by NXT. Regardless of your opinion of NXT, the NXT charts suggests this coin to be manipulated for P and D gains. I going beyondTA Here to suggest ignis will be in accumulation stage for artificial pumping as the pump is set up.
Look for IGNIS to trade below 3.5k sats for weeks. watch for the C and H.

The Clock Is TickingI don't know how long this perceived affluence will continue--but the days are numbered. Everything is overbought.

Goldcoin, A No Brainer.I would highly look into Goldcoin and what they are all about. Sitting around 3000 SATS, this is an easy buy.
Circulating Supply: 72,000,000
Litecoin circulating supply: 84,000,000
Its much easier for Goldcoin to raise in price compared to other coins/tokens that have billions in circulation.
steemit.com

Monero - Long Opportunity - $395 - $480 Hey traders! I want to wish you Happy New Year. I really hope I can keep learning from you, I have had the opportunity to meet amazing people here, and I want to thank you all for your great support :)
I want to share with you my first Monero`s analysis (XMRUSD), where I identified a long term tendency line in the Logarithmic Price Scale (if you don`t understand this concept, please go to the end of this post where I explain it).
As you can see, Volume has been increasing throughout all the tendency line, which is a fundamental signal for a bullish market, and therefore we can trust it will continue to keep moving upwards. I also want you to notice the current downtrend tendency where the price is moving. This tendency is important because once the breakout has occured, it will be exactly the point where price will start moving to our both targets. If you are interested in Monero`s market, I recommend you to wait for this breakout signal, and MACD´s change of direction (from down to up). If this breakout doesn´t occur, we have to wait for a bounce in the tendency line. I will update this post continually :)
MY ORDERS
BUY STOP: 340
TakeProfit1: 395
TakeProfit2: 480
Remember numbers can vary depending on your risk profile and price expectations. The numbers I propose should be use as a reference :)
What is a Logarithmic Price Scale?
Well, in first place you have to know there are two different ways you can observe the charts: arithmitc scale and logarithmic scale. The main difference between both methods, is that in the arithmitc scale, the vertical price scale indicates there´s a same distance for each price variation unit. On the contrary, logarithmic price scale shows the prices based on porcentual increments -or decrements-, that means that the distance between 1 and 2, is exactly the same distance between 5 and 10. Link to image: www.chilebolsa.com
Are you interested in Technical Analysis?
I recommend you the John Murphy´s book: Technical Analysis of Financial Markets. It is a great introductory book.
If you find this analysis helpful, don't forget to follow, like and comment. I use to upload new analysis every day :)

Ripple - The New Bitcoin - 3$Hey traders! In first place I would like to thank you for all your support and great feedback, I really appreciate your comments, opinions and chats, and I hope to learn more from you everyday, this has been an amazing experience :)
Today I bring you another Ripple´s analysis based on a longterm tendency line I indentified in the logarithmic Price Scale. If you don´t know what log price scale is, you can find the explanation at the end of this post. Since my last post (linked below) Ripple´s has had an amazing performance, almost reaching to the $2 dollars target, which is an important psychological level. This level is important because there might be a correction before another bullish movement (somewhere near 1.620 - Which is exactly the 0.382 point of Fibonacci scale), and therefore, we might have the opportunity to buy a bit cheaper.
I also want you to notice volume development (bullish) and MACD indicator. The first one (volume) is an important characteristic for support the idea of a bullish and strong market as Ripple. Most importantly, it tells us bullish tendency will continue in future. The second one, starts showing signals of an inflextion point, which is exactly the place where we can wait for a market correction before the a next bullish wave.
MY ORDERS
BUY STOP: 2.05 (If correction doesn´t occur)
BUY LIMIT: 1.620 (If correction occurs)
Take Profit 1: 2.9900
Remember numbers can vary depending on your risk profile and price expectations. The numbers I propose should be use as a reference :)
What is a Logarithmic Price Scale?
Well, in first place you have to know there are two different ways you can observe the charts: arithmitc scale and logarithmic scale. The main difference between both methods, is that in the arithmitc scale, the vertical price scale indicates there´s a same distance for each price variation unit. On the contrary, logarithmic price scale shows the prices based on porcentual increments -or decrements-, that means that the distance between 1 and 2, is exactly the same distance between 5 and 10. Link to image: www.chilebolsa.com
Are you interested in Technical Analysis?
I recommend you the John Murphy´s book: Technical Analysis of Financial Markets. It is a great introductory book.
If you find this analysis helpful, don't forget to follow, like and comment. I use to upload new analysis every day :)
