BAC Pullback Into MA — Is This the Next Swing Continuation Move?🔥📈 BAC — Bullish Pullback Playbook Into MA | Thief-Style Layer Entry 📊💼
Hey Traders! 😎
Here’s my Bullish Pullback Into Moving Average playbook on BAC — Bank of America Corp (NYSE).
Clean setup, thief-friendly layering, and a classy escape plan 😅🕶️💸
📘 Asset
BAC — Bank of America Corporation (NYSE)
Swing-trade style breakdown with a professional twist and a few laughs for the OG Thief Family 😄💼
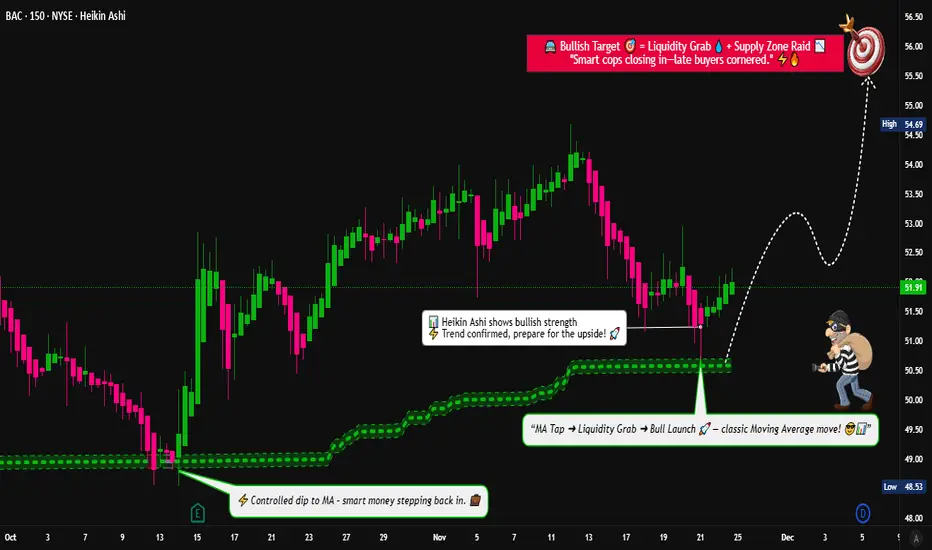
🎯 Plan: Bullish Pullback Into the Moving Average
Price is dipping beautifully back toward key Moving Averages — classic bullish continuation behavior.
I’m monitoring for strength after the pullback along the MA zone. ✔️
🟦 Entry Plan (Thief Layering Strategy)
Thief strategy = multiple limit orders placed at different value zones.
This helps average in during the pullback without chasing. 👇💰
🔥 Layered Buy Limit Zones:
50.50
51.00
51.50
52.00
(Feel free to extend the layers if your own plan requires it.)
This is NOT a buy signal — only an example of a layering method for educational purposes.
🛑 Stop Loss (Thief Style)
Thief SL zone: 49.00
This is merely an illustrative SL point in my personal playbook style.
Note: Dear Ladies & Gentlemen (Thief OG’s), I am not recommending that you use my SL.
You make your own decisions and manage risk according to your plan.
🎯 Target Zone
We have strong resistance overhead + extended levels + potential liquidity traps.
So the smart thief knows when to take the bag and vanish 🏃💨💰
My take-profit zone: 56.00
Note: Dear Ladies & Gentlemen (Thief OG’s), I am not recommending that you use my TP.
You make your own choices — take money when you want, at your own risk.
🧠 Market Notes & Why the Setup Works
Price respecting MA structure
Clear bullish momentum on higher timeframes
Liquidity resting above recent swing levels
Healthy pullback with momentum probability toward continuation
Good behavior around institutional zones
🔗 Related Pairs to Watch (Correlation Insight)
BAC has measurable correlation with U.S. financial-sector instruments. Watching them helps confirm sentiment 🧩📊
AMEX:XLF — Financial Select Sector ETF
When XLF is strong, BAC often follows the broader sentiment.
NYSE:JPM — JPMorgan Chase
Sector correlation; bullish flow here can support BAC continuation.
$C — Citigroup
Similar pullback and continuation behavior; keep an eye on banking flow.
AMEX:SPY — S&P 500
Strong indices = supportive environment for major banks.
📘 Quick Correlation Summary
Banking stocks move together due to macro factors like rates, liquidity, and earnings expectations.
Strong AMEX:XLF + bullish AMEX:SPY generally improves probability for bullish pullbacks in BAC.
If all “sister pairs” show weakness, expect slower continuation.
✨ “If you find value in my analysis, a 👍 and 🚀 boost is much appreciated — it helps me share more setups with the community!”
⚠️ Disclaimer
This is a thief-style trading strategy created for educational and fun purposes only.
Not financial advice, not signals, and not a recommendation to buy or sell any asset.
Stocksmatkets
QUBT [Swing]: Double Bottom + Volume = Opportunity🎯 QUBT: The Quantum Heist Setup! 💎 Double Bottom Breakout Play
📊 Asset Overview
Quantum Computing Inc. (QUBT) - Riding the quantum wave with momentum! 🌊
🔍 Technical Analysis
The chart is screaming opportunity! 📢 We've spotted a volume-weighted moving average double bottom pattern with a clean retrace hitting the 786 MA line. Bulls are flexing their muscles 💪 and the setup looks primed for an upside explosion.
Key Technical Highlights:
✅ Double bottom formation confirmed
✅ Volume spike supporting the move
✅ 786 MA acting as dynamic support
✅ Momentum indicators turning bullish
🎯 The "Thief" Strategy Playbook
🚪 Entry Zone: The Layered Approach
Thief Strategy = Smart Layering 🧠
Instead of going all-in at one price, we're using multiple limit orders (layering strategy) to build our position:
💰 Layer 1: $19.50
💰 Layer 2: $20.00
💰 Layer 3: $20.50
💰 Layer 4: $21.00
Pro Tip: You can add more layers based on your risk appetite and position size! This approach averages your entry and reduces timing risk. 🎲
🛡️ Risk Management
🚨 Stop Loss: $18.00
Important Note: This is the Thief OG stop level, but remember — your capital, your rules! 👑 Every trader's risk tolerance is different. Adjust based on your own comfort zone and account size. Trade at your own risk!
🎯 Profit Targets
🏁 Primary Target: $25.00
Why $25? Because at $26.00, we've got a "Police Barricade" 🚔🚧 — a strong resistance zone where:
Overbought conditions likely
Bull trap potential
Heavy selling pressure expected
Smart thieves escape before the sirens! 🚨 Lock in profits at $25.00 and live to trade another day.
Another Important Note: This is a suggested target level. You make the money, you take the money — at your own discretion and risk! 💵
🔗 Related Pairs to Watch
Keep an eye on these correlated quantum/tech plays:
NYSE:IONQ - Pure-play quantum computing competitor
NASDAQ:RGTI - Rigetti Computing (quantum sector)
NYSE:IBM - Traditional tech with quantum division
NASDAQ:NVDA - AI/quantum chip correlation
NASDAQ:GOOGL - Google's quantum initiatives
Correlation Play: When quantum stocks heat up, they often move together. QUBT leading could signal sector-wide momentum! 🔥
⚠️ Disclaimer
This is the "Thief Style" trading strategy — designed for entertainment and educational purposes with a fun twist! 🎭 This is NOT financial advice. Always do your own research, manage your risk, and never trade with money you can't afford to lose. Past performance doesn't guarantee future results. Trade responsibly! 🎲
🎬 Final Words
The setup is there, the levels are marked, and the quantum play is heating up! Whether you're swing trading or day trading, this layered approach gives you flexibility and control.
Remember: Markets don't care about your feelings — stick to your plan, manage your risk, and let the probabilities work in your favor over time! 🎯
✨ If you find value in my analysis, a 👍 and 🚀 boost is much appreciated — it helps me share more setups with the community!
#QUBT #QuantumComputing #StockMarket #SwingTrading #DayTrading #TechnicalAnalysis #DoubleBottom #ThiefStrategy #LayeringStrategy #TradingSetup #BullishSetup #StockTrading #QuantumStocks #TradingIdeas #PriceAction #RiskManagement

NVDA 2HourTime frameNVDA 2-Hour Snapshot
Current Price: $170.76 USD
Previous Close: $168.31 USD
Day Range: $166.74 – $170.97 USD
52-Week Range: $139.34 – $200.00 USD
Volume: 170,370,750
VWAP: $169.67 USD
Market Cap: $1.1 Trillion
🔎 Technical Indicators
Relative Strength Index (RSI): 39.44 — Neutral
Moving Averages:
5-period: $169.68 — Sell
10-period: $174.59 — Sell
20-period: $177.06 — Sell
50-period: $172.58 — Sell
100-period: $150.61 — Buy
200-period: $139.34 — Buy
Moving Average Convergence Divergence (MACD): -0.91 — Buy
Stochastic Oscillator: 20.33 — Neutral
Commodity Channel Index (CCI): -119.52 — Buy
Average True Range (ATR): 4.93
📈 Market Sentiment
Pivot Points:
Resistance: $175.00 USD
Support: $165.00 USD
📅 Outlook
Bullish Scenario: A breakout above $175.00 USD could signal a move toward $185.00 USD.
Bearish Scenario: A drop below $165.00 USD may lead to further downside.
Overall Bias: Neutral, with mixed signals from moving averages and momentum indicators.

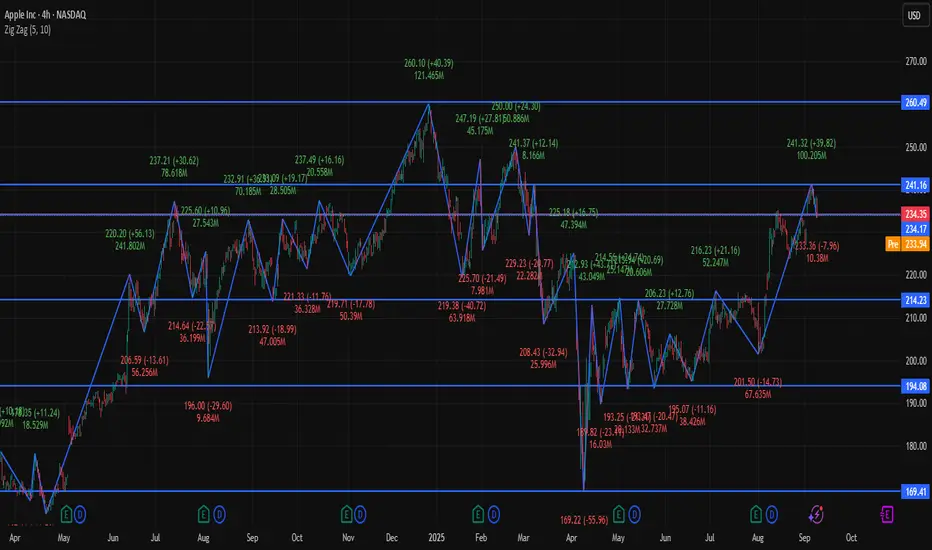
AAPL 4Hour Time frame📊 Apple (AAPL) Snapshot
Current Price: ~$234.35
Day Range: $233.01 – $238.66
Open Price: ~$236.73
Market Cap: ~$3.0 Trillion
P/E Ratio: ~30.3
EPS: ~6.59
🔎 Pivot Levels (Daily Basis → useful for 4H)
Pivot Point: ~$234.6
Resistance:
R1: ~$235.9
R2: ~$238.0
R3: ~$239.2
Support:
S1: ~$232.5
S2: ~$231.3
S3: ~$229.1
📉 Technical Indicators (4-Hour Insight)
RSI: ~40 → weak, leaning bearish.
MACD: Negative → bearish momentum.
Moving Averages: Short-term averages show Sell, long-term still supportive (Buy).
📌 4-Hour Frame Outlook
Momentum: Neutral-to-bearish; price is consolidating around the pivot zone ($234–235).
Bullish Scenario: If AAPL breaks above $238, short-term upside could open toward $239+.
Bearish Scenario: If price slips below $232, risk increases for a move toward $230.
✅ Conclusion: On the 4-hour chart, Apple is in a neutral to bearish phase, with weak momentum. Bulls need a breakout above $238 to take control, while bears may dominate if it breaks under $232.
Can Potentially move upwards from here?Bitcoin just created an inducement and it has been hunted. Now the structure is also broken and the inducement is also taken out. The market is in a discount zone, and there's an overlap of a Breaker Block and FVG (Fair Value Gap), which indicates that the market can potentially move upwards from here.
Wait for bullish confirmations here, such as MSS (Market Structure Shift), CISD (Change in Character/Continuation of Internal Structure Dynamics), and failed selling PD Arrays!
Do Your Own Research (DYOR)! This is not financial advice.

ASI - Elliot Wave PatternThe completion of this pattern typically suggests that the market might enter a corrective phase or a new trend might begin. It’s crucial to keep an eye on the key support and resistance levels and be cautious about the potential market movements.
Disclaimer: The information and analysis provided in this publication are for educational purposes only and should not be construed as financial advice or recommendations to buy, sell, or hold any securities. The author and TradingView are not responsible for any investment decisions made based on the content presented herein. Always consult a financial professional before making any investment decisions.

AMD... Is it time to BUY?? YESSIR!!What are we looking at technically?
- The market is in an obvious uptrend
- A bullish BOS (break of structure)
- A retracement to the OTE (Optimal Trade Entry) fib levels between .705 - .786
- The bullish FVG is also aligned with the OTE levels for a confluence of support
- Price has formed a fractal low on the +FVG as price completed the External to Internal run on liquidity. Now comes the IRL back to the ERL move. The swing high at 227.30 is the target, as that is where the buy side liquidity is.
Fundamentally, the recent Amazon partnership is the latest move that will give AMD a huge boost. Not mention the AMD may become a buyer of INTEL's AI Fabric Chip.
Things are looking up for the organization.
What do you think?
It's a BUY for me.
Disclaimer:
I do not provide personal investment advice and I am not a qualified licensed investment advisor.
All information found here, including any ideas, opinions, views, predictions, forecasts, commentaries, suggestions, expressed or implied herein, are for informational, entertainment or educational purposes only and should not be construed as personal investment advice. While the information provided is believed to be accurate, it may include errors or inaccuracies.
I will not and cannot be held liable for any actions you take as a result of anything you read here.
Conduct your own due diligence, or consult a licensed financial advisor or broker before making any and all investment decisions. Any investments, trades, speculations, or decisions made on the basis of any information found on this channel, expressed or implied herein, are committed at your own risk, financial or otherwise.

AMF.N000050DMA (Green line) acting as a resistance line & 23 will be the strong support level in upcoming days.
Disclaimer: The information and analysis provided in this publication are for educational purposes only and should not be construed as financial advice or recommendations to buy, sell, or hold any securities. The author and TradingView are not responsible for any investment decisions made based on the content presented herein. Always consult a financial professional before making any investment decisions.

TELSA STOCKHello, traders here is a summary of what the Telsa stock price may play out in the future as you can see the price has been respecting the trend lines and ended up creating a pattern (flag bullish pattern) so my prediction is that the price would break the above trend line and retest it then go up.

Necklace Pattern- BF UtilitiesNecklace Pattern
This stock looks attractive as it's trying to claim back it's swing high! It may soar & fly further it reaches there quickly or after some consolidation.
This is purely for educational purpose & not a Buy/Sell Call. Do your own Research (DYOR.)

US10Y: Key Moment for Stock MarketHi Trader!
U.S. Treasury yields climbed on Wednesday after an unexpected rise in UK inflation last month and stronger-than-expected U.S. December retail sales data strengthened the case that interest rate cuts will not be as imminent as the market expects. The UK inflation print, as well as more push-back from European Central Bank officials on Wednesday against interest rate cut bets, pushed European bond yields higher. Treasury yields, which move inversely to prices, followed suit, with the uptick gaining momentum after Commerce Department data showing retail sales in December grew by 0.6% month on month, above the 0.4% economists had expected in a poll. Weak demand for a 20-year bond auction also helped lift yields later on Wednesday.
💡 "December retail sales reflect an economy that, although slowing, continues to be underpinned by consumer spending," said Quincy Krosby, chief global strategist for LPL Financial. "For the Federal Reserve, slower consumer demand would help propel inflation to decelerate at a faster pace; however, with consumer confidence gaining momentum, the economic landscape remains on solid ground," she said in a note.
🔴 The short-end of the yield curve, more closely linked to monetary policy expectations, led the move higher. Two-year yields rose about 13 basis points to 4.354%, their biggest daily increase in over a month. Benchmark 10-year yields US10Y added about four basis points to 4.104%, their highest since Dec. 13.
🔴 From a technical perspective, chart shows a bearish impulse structure forming, and this technical bounce could form the second corrective leg (wave 4) before another bearish swing (wave 5). That said, the key resistance is around 4.23, and a rally above it could invalidate the technical structure.
We correctly predicted the surge in inflation last year, but now the geopolitical context has become more complex:
(Click on chart below)
In conclusion, if this analysis is correct, Stock Markets (SP500, Russell, DJ,...) should see another rally with potential new High Top...
Trade with care
Like | Share | Comment

AMAZON.COM / TECHNİCAL ANALYSIS / 4HNASDAQ:AMZN If it closes above level 157, my target is 163.
Like and comment if you find value in our analysis.
Feel free to post your ideas and questions at the comments section.
Good luck

ALUM.N0000Buy Zone mentioned in above chart.
Disclaimer: The information and analysis provided in this publication are for educational purposes only and should not be construed as financial advice or recommendations to buy, sell, or hold any securities. The author and TradingView are not responsible for any investment decisions made based on the content presented herein. Always consult a financial professional before making any investment decisions.


Pin point predictions Of Escorts For 4 to 8 sep 23Hello Traders,
This is the trade plan for next week of Bharat Forge. Outline is showed on chart . For detail understanding of price action check below.

CSCO Cisco Systems Options Ahead of EarningsIf you haven`t sold CSCO here:
Or reentered here:
Then analyzing the options chain and the chart patterns of CSCO Cisco Systems prior to the earnings report this week,
I would consider purchasing the 53usd strike price Calls with
an expiration date of 2023-8-18,
for a premium of approximately $1.77.
If these options prove to be profitable prior to the earnings release, I would sell at least half of them.
Looking forward to read your opinion about it.

Falling Knife- Consolidation Series - Asian PaintsThis stock has fallen from the high of 3500 level to almost 2800 level & that is 20% fall in almost 6-7 months. Its trading in the range for last 2-3 months & it'll be interesting to see whether it breaks itself free for its old glory.
Check your own chart, this is only for educational purpose & Not a buy recommendation.

Netflix Analyze (Double Bottom Pattern)!!!Netflix made a Double Bottom Pattern near the Important Support Line; after that, it broke the Necking line with a candle with enough volume.
I showed you the zone where you can take your profit.
Netflix Analyze Daily Timeframe (Log Scale /Heikin Ashi)⏰
Do not forget to put Stop loss for your positions (For every position you want to open).
Please follow your strategy, this is just my idea, and I will be glad to see your ideas in this post.
Please do not forget the ✅' like '✅ button 🙏😊 & Share it with your friends; thanks, and Trade safe.

Bitcoin Analyze (Double Zigzag Correction/Timeframe 4H)!!!😉It seems Bitcoin was able to pass the end of Main wave Y of the Double Zigzag Correction. However, I drew another scenario for you in the chart.
I expect that Bitcoin will go DOWN at least to the Important Trendline & Support line.
Also, we can see the Divergence between Price and Volume.
In addition, the 💫Shooting Star💫 Pattern occurred during Daily Timeframe.👇//
🔆Scenario 2: if microwave 3 of microwave C of main wave Y is extended, then we can expect Bitcoin to make a Bearish AB=CD Harmonic Pattern around 26580$(Low possible).
Do not forget to put Stop loss for your positions (For every position you want to open).
Please follow your strategy, this is just my idea, and I will be glad to see your ideas in this post.
Please do not forget the ✅' like '✅ button 🙏😊 & Share it with your friends; thanks, and Trade safe.

Buy MMAT 1/11/2021You can buy MMAT target 6.78 stop loss 4
Money management your responsibility.
I recommend entering a maximum of 10% of the portfolio.
Good luck

BUY GAMESTOP 14/9/2021Stock above EXMA 200 and still in uptrend Stock is making higher low and tests the EXMA 13 and EXMA 34 So you can buy target 308.1 stop loss 145 Good luck

Buy SGRP 7/9/2021Stock above EXMA 200 so it is still in uptrend
Stock is making higher low
EXMA 13 cross up EXMA 34
So you can buy target 2.2 stop loss 1.5
Good luck

✅SELF EXPLANATORY PULLBACK TRADE SETUP✅✅ SELF EXPLANATORY PULLBACK TRADE SETUP ⤴️
- GOOD BUY ON CHANNEL'S SUPPORT OR DEMAND ZONE.
- DRY VOLUME ON SELLING.
- SL ON CLOSING BASIS : 1690.
- LEVELS
- DEMAND ZONE : 1800-1860
OR
- BUY WHEN PRICE COMES AT CHANNEL'S SUPPORT
- SL ON CLOSING BASIS : 1690.
🚫This is only for Educational Purpose 🚫
➡️Consult Your Financial Advisors Before Taking Any Trade💻
