Short Idea on AAPL Based on :
- Quantitative analysis
- 2 Supply zones
- Fundamental data/dividend analysis
- VP and Avwap levels
Supply Zone

EURJPY - Market is at Overbought Zone, Expecting Correction..!The image provided is a forex trading chart for the EUR/JPY currency pair, illustrating a technical analysis strategy.
The analysis identifies a "daily resistance" level where traders are advised to "look for shorts" (sell positions), anticipating a price decline.
Technical Analysis Overview 📊
Currency Pair: Euro / Japanese Yen (EUR/JPY). 💴
Strategy: The chart highlights a resistance level (the upper horizontal line around 185.5 JPY per Euro) where selling pressure has historically increased.
Actionable Insight: The text "LOOK FOR SHORTS" suggests implementing a trading strategy to profit from an expected downward price movement, often used when a market is considered overbought. ⬇️
Market Context: As of recent data (January 2026), the EUR/JPY pair has been trading near record highs, with some analyses noting potential bearish divergence in technical indicators, which could support the short-selling idea. ⬇️

Bitcoin Cash (BCH): ready for another drop? key levels to monitoBitcoin Cash. Tired of watching it bleed while bitcoin steals the spotlight again? Recent headlines talk about money rotating back into the main coins and, according to market sources, interest in BCH on the spot side has cooled off after the last hype spike - price action is reflecting that mood perfectly.
On the 4H chart we are stuck in a tight range under a heavy supply zone around 535-550, right below a big volume node that keeps capping every bounce. RSI is hanging under 50, so momentum is still bearish, and the last recovery came on declining volume - for me that favors another leg down rather than a full reversal.
My base case: I am hunting shorts while price is under 540, with potential targets at the local supports near 505 and, if that breaks, 480 ✅. If price suddenly rips above 545 and holds there with strong volume, that would cancel the short idea and open room for a squeeze toward 575-600. I might be wrong, but until the market proves otherwise I treat every bounce here as fuel for sellers, not the start of a new uptrend ⚠️.

XAUUSD PULLBACK (READ CAPTION)Hi trader's what do you think about gold
Gold is currently trading with a bullish market bias, supported by strong buying interest above key support levels. The overall price structure favors buyers, and short-term pullbacks are considered healthy retracements within the uptrend.
🟢 Support Zone: 4500
The 4530 level is acting as a strong bullish support zone. As long as price holds above this area, the bullish momentum is expected to continue.
🟢 Second Support: 4380
The 4380 level represents a deeper demand and safety support area. A retracement toward this level may attract buyers again. A break below 4380 would weaken the bullish structure.
🔴 Resistance: 4775
The 4775 level is the nearest resistance where short-term selling pressure may appear.
🔴 Supply Zone: 5000
The 5000 level is a major long-term supply zone and a potential upside target if bullish momentum continues.
📈 Market Bias
Above 4500 → Bullish trend remains active
Pullbacks toward 4500 – 4380 → Buy-on-dips zone
Break below 4380 → Bullish setup invalid
Overall, Gold favors a buy-on-dips strategy while holding above the key support zones.
please don't forget to like comment and follow

In the next 1-2 weeks, the price is between 4600-5200.In the next 1-2 weeks, the price is between 4600-5200.
Gold spot prices fluctuated wildly last week, falling from a high of $5,602 on Thursday, January 29th, to a low of $4,679 on Friday, January 30th, a difference of approximately $900, marking the largest price swing since 1983. Looking at the daily candlestick chart, Friday's candlestick has a long lower shadow, indicating strong buying support below $4,800. The key level to watch in the first week of February is the psychological support level of $4,800, while the resistance level of $5,000. In the next 1-2 weeks, prices are unlikely to reach new highs, and are expected to fluctuate between $4,600 and $5,200.
H4: As shown in the chart, the long lower shadow on the last candlestick of the H4 pattern indicates support at $4800. However, a sharp drop will likely create selling pressure above $5000 due to buying pressure from the previous 1-2 weeks. In the coming days, a long position can be considered primarily in the $4580-$4820 range. Short positions can be considered around the $5000 psychological level and the $5250 resistance zone. See the strategy below for details.
H4 Strategy:
Buy Zone @ 4580 - 4820
SL: 40-80, TP: 120-240
Sell Zone 1 @ 4960 - 5080
SL: 40-60, TP: 120-180
Sell Zone 2 @ 5200 - 5300
SL: 40-60, TP: 120-180

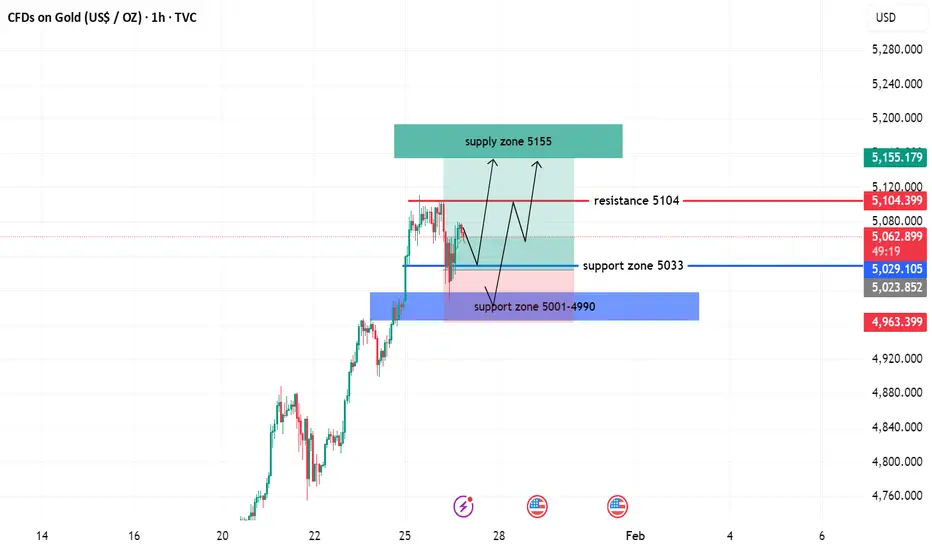
XAUUSD BULLISH ANALYSIS(READ CAPTION)Hi trader's what do you think about gold
Gold is currently showing bullish price action, with the market holding above key support levels. Buyers remain in control, and any short-term pullbacks are considered potential buying opportunities within the overall uptrend.
🟢 Primary Support: 5033
The 5033 level is acting as a strong bullish support. As long as price stays above this level, the bullish momentum is expected to continue.
🟢 Second Support Zone: 5001 – 4990
This zone represents a strong demand and accumulation area. If price retraces into this zone, buyers are likely to step in again. A clear break below 4990 would weaken the bullish structure.
📈 Market Bias
Above 5033 → Bullish trend remains valid
Pullback toward 5001–4990 → Possible buy zone
Below 4990 → Bullish setup invalidated
Overall, the market structure supports a buy-on-dips strategy while price holds above key support zones.
please don't forget to like comment and follow
SPX500 H1 – Supply Zone Rejection | Bearish Sell Setupon the SPX500 H1 timeframe, price has respected the previous Supply zone and is currently showing signs of stalling or rejection.
The RSI is around 59, indicating overbought conditions and building bearish pressure. If the market shows bearish momentum from this level and the structure weakens, the sell setup active.
Confirmation for the sell includes rejection from the Supply zone, RSI shifting from overbought toward downside, and bearish candles or momentum confirmation. The first target is 6890.0 (H1 Order Block) and the final target is 6840.0 (major downside liquidity)
Disclaimer:
This analysis is for educational purposes only. It is not financial advice. Trading involves risk, so always do your own research and manage risk properly before taking any trade.

EUR/JPY Market Analysis: Macro + Structure [MaB]1. The Macro Context (The "Why") 🌍
Hi traders! Before looking at the candles, let's look at the money.
My fundamental scoring table speaks clearly: there is a huge differential that we cannot ignore.
Key Factor Analysis:
🏦 Rate Expectations: Explanation: The BCE remains neutral with a trend holding stance and no clear bias in recent decisions, while the BOJ is the only hawkish central bank in the G7 with a recent +25bp hike and an aggressive stance. Score EUR: 0 Score JPY: +2
🎈 Inflation: Explanation: Eurozone inflation is at 2.14%, close to the 2% target, representing a controlled situation. JPY inflation at 2.91% is above target, justifying the BOJ's hawkish stance. Score EUR: 0 Score JPY: +1
📈 Growth/GDP: Explanation: Europe is facing worrying economic stagnation with a GDP of 0.7%. Japan's growth is also weak at 0.5%, which limits the space for overly aggressive rate hikes. Score EUR: -1 Score JPY: -1
🏭 PMI Data: Explanation: EUR PMI is neutral (weighted 50.65). JPY shows manufacturing expansion with a weighted PMI of 52.66. Score EUR: 0 Score JPY: +1
⚖️ Risk Sentiment: Explanation: Market is currently in a neutral regime; EUR is semi-cyclical and JPY is a safe-haven, but no significant risk-off flows are present. Score EUR: 0 Score JPY: 0
🗞️ News Catalyst: Explanation: Recent EUR CPI came in at 1.9% vs 2.0% expected, a moderate negative surprise. JPY benefits from exceptional hawkish policy momentum. Score EUR: 0 Score JPY: 0
Currency Score Summary:
Total Score EUR: -1 ( ) Total Score JPY: +2 ( )
Synthesis:
EUR (Weak, Score -1): The Euro is under pressure due to economic stagnation and a neutral central bank. JPY (Strong, Score +2): The Yen is strong, supported by a hawkish BOJ that stands out as an outlier in the G7. Conclusion: With this scenario, we are only looking for .
Going against this bias would be statistical suicide.
2. The Technical Setup (The "Where") 📉
Timeframe: 4h | Pair: EUR/JPY
The SMC Market Structure + Price Zones indicator gave us the confirmation we needed for our statistical edge.
Here is where the indicator makes the difference. Look at the dashboard on the right, numbers don't lie:
🚀 Continuation Rate (60%): We are exactly at the 60% threshold.
This tells us the market is in a healthy, directional trend.
Statistically, betting on continuation pays off more than looking for a reversal.
🔥 Streak (0) & Streak Pct: 2 We are at the start of a potential new leg after a period of correction.
It's a mature trend (we are in the 2nd percentile of trend extension), so watch those stop losses, but as long as the music plays, we dance.
🔄 Retest (85.4%): The indicator tells us that statistically, when price creates a new Break of Structure (BOS), it retraces into the previous zone 85.4% of the time.
Therefore, it pays to wait for a deep retracement into the supply zone to maximize our Risk/Reward ratio.
💥 BOS/Ret Rate (41.5%): This parameter tells us that once price retraces inside the previous zone, it has a 41.5% probability of reacting and creating a new BOS.
🎯 Extension Rate (1.82x): The algorithm projects an ambitious target.
We expect this move to extend 1.82 times the current pullback leg. That's where we'll take profit.
3. Execution Plan on Chart
Moving to the chart, the SMC Market Structure + Price Zones indicator supports us in pinpointing liquidity to define entry and stop loss:
Entry and Stop Loss: We place a limit entry in the Supply Zone 4h (Red Band) and the stop loss a few pips above the zone.
Take Profit: We leverage the asset's statistical analysis offered by the Extension Rate and place the target by measuring with Fibonacci at 1.8x relative to the pullback leg.
Trade Parameters:
Entry Price: 185.416 Stop Loss: 186.181 Take Profit: 178.850
⚠️ Disclaimer: This analysis is based on a proprietary algorithm and is shared exclusively for educational and didactic purposes.
It does not constitute financial advice or investment solicitation in any way. Trading involves significant risk.

Short Idea on Crude Oil (CL1!)Based on :
- avwap and vp levels
- Bond yield spikes
- quantitative analysis
- 2 supply zones for potential entries

USDCAD - From Sellers to BuyersLast week, the focus was clear:
price was trading inside the orange supply zone, and that was a clean area to look for shorts. Sellers did their job perfectly there.
Fast forward to now, and the context has changed.
USDCAD has pushed lower and is retesting a strong demand zone, an area where buyers have previously stepped in.
As long as this demand holds, the bias shifts again, this time toward looking for longs, not chasing, but waiting for price to show rejection.
Let price confirm… then react📈
⚠️ Disclaimer: This is not financial advice. Always do your own research and manage risk properly.
📚 Stick to your trading plan regarding entries, risk, and management.
Good luck! 🍀
All Strategies Are Good; If Managed Properly!
~Richard Nasr

BNBUSDT M15 HTF Supply Reaction and Bearish Continuation Setup📝 Description
BNB has pushed into a short-term premium zone after a corrective bounce and is now showing hesitation below a 15-minute Fair Value Gap. The recent upside move lacks strong bullish continuation, and price is reacting from a supply-aligned area, increasing the probability of a downside rotation.
________________________________________
📉 Signal / Analysis
Primary Bias: Bearish below the 15m FVG and intraday highs
Preferred Setup:
• Entry: 872.61
• Stop Loss: Above 874.33
• TP1: 870.90
• TP2: 868.10
• TP3: 864.90
________________________________________
🧠 ICT & SMC Notes
• Price reacting from 15m FVG in premium
• Weak bullish follow-through after mitigation
• Internal buy-side liquidity already tapped
• Downside targets aligned with BPR and lower imbalance zones
________________________________________
📌 Summary
As long as price remains capped below the 873–874 resistance area, the bearish continuation scenario remains favored. Current price action suggests a corrective pullback has likely completed, with expectations of a rotation toward lower liquidity pools.
________________________________________
🌍 Fundamental Notes / Sentiment
No strong bullish catalyst is currently present for BNB, and broader crypto sentiment remains vulnerable to short-term pullbacks. This environment supports mean-reversion and liquidity-driven downside moves rather than sustained upside continuation.
________________________________________
⚠️ Risk Disclosure
Trading involves substantial risk and may result in capital loss. This analysis is for educational purposes only and does not constitute financial advice. Always apply proper risk management, predefined stop-loss levels, and disciplined position sizing aligned with your trading plan.

Unmitigated Supply Zone on GBPUSD | H4Unmitigated Supply Zone on GBPUSD, a POI for on the H4 timeframe. Let's see how price reacts to this zone.


USDCAD - Back Into Supply, Sellers Watching CloselyUSDCAD is now hovering around a clear resistance and supply zone.
This area has already proven itself in the past, and price is once again reacting to it.
As long as this zone holds, the bias remains to the downside, and we’ll be looking for short setups, ideally confirmed on lower timeframes.
⚠️ Disclaimer: This is not financial advice. Always do your own research and manage risk properly.
📚 Stick to your trading plan regarding entries, risk, and management.
Good luck! 🍀
All Strategies Are Good; If Managed Properly!
~Richard Nasr

EURCAD - Anticipating the Price to FallThis image displays a technical analysis chart, specifically for the EUR/CAD (Euro/Canadian Dollar) currency pair, illustrating a potential trading setup. 💴
The chart uses common trading terms to show a transition from a potential bullish (uptrend) to a bearish (downtrend) market bias, suggesting an opportunity to initiate "short" positions.
Chart Analysis 📊
Bullish Phase: The price initially moved in an upward-sloping channel or triangle, indicating buying pressure.
Bearish Transition: The price hit a "supply" zone, an area where selling interest is strong enough to potentially reverse the upward momentum. 📉
Recommendation: The chart suggests that as the price respects this resistance area, traders should "look for shorts," meaning they anticipate the price to fall (a bearish move) and can position their trades to profit from this decline. ⬇️

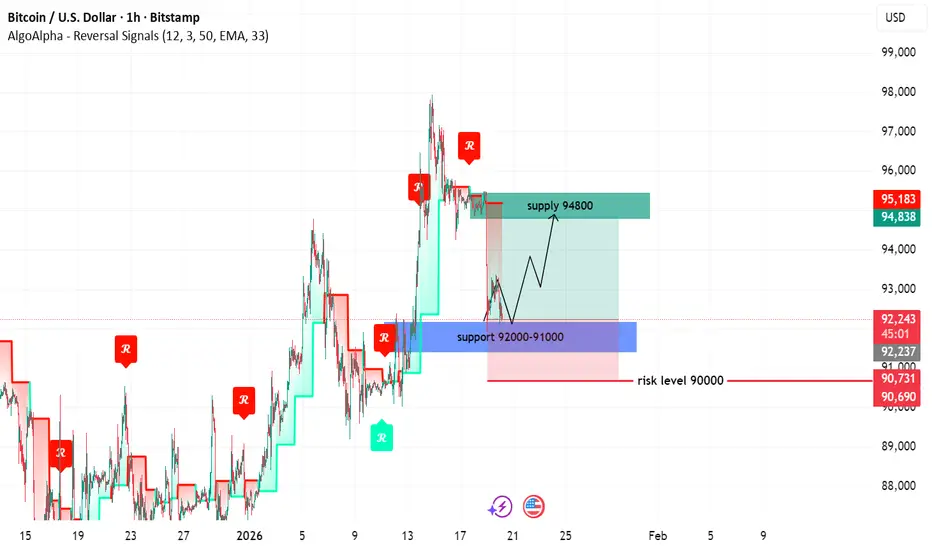
BTCUSD NEXT MOVE (READ CAPTION)Hi trader's what do you think about btcusd
BTCUSD is currently maintaining a bullish market structure, with price holding above a key support zone and buyers remaining active on pullbacks. The overall price action suggests a potential continuation toward higher levels, while risk is clearly defined below.
🔹 Support Zone: 92,000–91,000
This zone represents the primary bullish demand area, where buyers have repeatedly stepped in.
As long as BTC holds above 91,000, the bullish bias remains valid.
🔹 Risk Level: 90,000
This level acts as the invalidation and risk management level.
A sustained break below 90,000 would weaken the bullish setup and signal caution or trend change.
🔹 Supply Zone: 94,800
This is the near-term upside target and supply area.
If bullish momentum continues, price is likely to move toward 94,800, where sellers may attempt to slow the advance or cause short-term rejection.
📈 Market Outlook
Holding above 92,000–91,000 → Bullish continuation expected
Break below 90,000 → Bullish setup invalidated
Upside target → 94,800 supply zone
Overall, the structure supports a bullish pullback followed by continuation, with clearly defined risk control.
please don't forget to live come follow
XAUUSD READY FOR NEW HIGHER HIGH (READ CAPTION)Hi trader's what do you think about gold
Gold (XAUUSD) is currently maintaining a bullish market structure, with price holding above key support levels and buyers remaining active on pullbacks. The overall price action suggests a strong probability of continuation toward higher levels.
🔹 Support: 4630
This is the primary bullish support level, where buyers have recently defended price.
As long as Gold holds above 4630, the bullish bias remains intact.
🔹 Support Zone: 4600–4585
This zone represents a strong demand and accumulation area.
If price retraces into 4600–4585, it is considered a high-probability buy zone within the bullish trend.
🔹 Resistance: 4682
This level acts as the key near-term resistance.
A confirmed breakout and close above 4682 will strengthen bullish momentum and validate continuation.
🔹 Supply Zone: 4730
This is the main upside target and supply area.
If Gold breaks above 4682, price is likely to extend toward the 4730 supply zone, where sellers may attempt to react.
A strong breakout above this zone could open the door for further bullish expansion.
📈 Market Outlook
Holding above 4630 / 4600–4585 → Bullish continuation expected
Break above 4682 → Opens path toward 4730 supply zone
Supply zone reaction will define the next directional move
Overall, the structure supports a bullish pullback followed by continuation scenario.
please don't forget to like comment and follow

XAUUSD BUYER WANT (READ CAPTION)Hi trader's what do you think about gold
Gold (XAUUSD) is maintaining a bullish market structure, with price holding above key support zones and buyers showing strength on pullbacks. The current price action suggests a higher probability of upside continuation toward the next resistance and supply areas.
🔹 Support Zone: 4600
This level acts as the primary bullish support, where buyers are actively defending price.
Holding above 4600 keeps the bullish bias intact.
🔹 Support Zone: 4580–4567
This is a strong demand and accumulation zone.
Any deeper retracement into 4580–4567 is considered a high-probability buying area, where strong bullish reactions are expected.
🔹 Resistance: 4673
This is the key near-term resistance.
A confirmed breakout and close above 4673 will strengthen bullish momentum and confirm continuation.
🔹 Supply Zone: 4710
This zone represents the main upside target and supply area.
If Gold breaks above 4673, price is likely to move toward 4710, where sellers may attempt to slow or reject the move.
A strong breakout above this zone could signal further bullish expansion.
📈 Market Outlook
Holding above 4600 / 4580–4567 → Bullish continuation expected
Break above 4673 → Opens path toward 4710 supply zone
Supply zone reaction will define the next major move
Overall, the structure supports a bullish pullback followed by continuation setup.
please dont' forget to like comment and follow

GBPUSD - From Bullish to Bearish, keeping it simpleGBPUSD has shifted gears.
After losing its bullish structure, price is now trading inside a falling red channel, keeping the broader bias bearish.
As GBPUSD retests the upper bound of the falling channel, and that retest lines up perfectly with the orange supply zone. This is a classic area where sellers tend to step back in.
As long as this intersection holds, the plan is simple:
wait for lower timeframe confirmation and look for trend-following short setups, aiming for continuation back toward the lower side of the channel.
⚠️ Disclaimer: This is not financial advice. Always do your own research and manage risk properly.
📚 Stick to your trading plan regarding entries, risk, and management.
Good luck! 🍀
All Strategies Are Good; If Managed Properly!
~Richard Nasr

XAUUSD BULLISH SETUP(READ CAPTION)Hi trader's what do you think about gold
Gold (XAUUSD) is currently showing a bullish market structure, with price holding above a key support zone and buyers actively defending pullbacks. The overall price action supports a continuation toward higher levels.
🔹 Support Zone: 4455–4430
This zone represents the primary bullish demand area where buyers have previously stepped in strongly.
As long as Gold holds above 4430, the bullish bias remains valid.
🔹 Resistance: 4518
This is the key near-term resistance level.
A confirmed breakout and close above 4518 will strengthen bullish momentum and signal continuation.
🔹 Supply Zone: 4550
This is the main upside target and supply area.
If Gold breaks above 4518, price is likely to move toward the 4550 supply zone, where sellers may attempt to slow or reject the move.
A strong breakout above 4550 could open the door for further bullish expansion.
📈 Market Outlook
Holding above 4455–4430 → Bullish continuation expected
Break above 4518 → Targets 4550 supply zone
Supply zone reaction will define the next directional move
Overall, the structure supports a bullish pullback followed by continuation setup.
please don't forget to like comment and follow thank you

BTCUSD READY FOR FLY (READ CAPTION)Hi trader's what do you think about btcusd
BTCUSD is currently maintaining a bullish market structure, with price holding firmly above a strong support zone and showing consistent buyer interest on pullbacks. The overall price action supports further upside continuation toward higher levels.
🔹 Support Zone: 89,000–88,000
This zone represents the primary bullish demand area where buyers have repeatedly stepped in.
As long as BTC holds above 88,000, the bullish bias remains intact.
🔹 Resistance Zone: 95,000
This is the key resistance area where price may face temporary rejection or consolidation.
A strong breakout and close above 95,000 will confirm bullish continuation.
🔹 Supply Zone: 99,000
This is the major upside target and supply area.
If BTC breaks above 95,000, price is likely to extend toward the 99,000 supply zone, where sellers may attempt to slow the move.
A decisive breakout above this zone could signal further upside expansion.
📈 Market Outlook
Holding above 89,000–88,000 → Bullish continuation expected
Break above 95,000 → Opens path toward 99,000 supply zone
Supply zone reaction will determine the next major directional move
Overall, the structure favors a bullish pullback followed by continuation scenario.
please don't forget to like comment and follow

AUDUSD Bearish Weekly ZoneReason for sell:
AUDUSD forming Quasimodo Pattern near weekly zone. H4 Supply zone also aligned with it.

USDCAD | Strategic SELL Opportunity🔻💼 USDCAD | Strategic SELL Opportunity (Multi-Target Setup)
Overview:
USDCAD is displaying bearish continuation behavior, with price reacting near a well-defined supply area, favoring further downside movement.
Sell Zone (Focus Area):
🔴 1.3920 – 1.3915
This zone acts as a strong resistance area where selling pressure is expected to dominate.
Downside Objectives:
🎯 1.3900 – First reaction target
🎯 1.3880 – Momentum extension
🎯 1.3860 – Structure continuation
🎯 1.3840 – Deeper downside move
🚀 1.3820 – Possible stretch target if selling accelerates
Why This Setup Works:
✔ Price reacting from a clear supply zone
✔ Bearish market structure remains intact
✔ Momentum aligns with downside continuation
Trade Management Insight:
Step-by-step profit booking helps secure gains while keeping exposure for extended moves. Capital protection remains the priority.
Execution Guidance:
Wait for price rejection or confirmation within the sell zone before execution. Avoid chasing price.
Final Note:
As long as price respects the resistance area, downside continuation toward lower targets remains the higher-probability scenario.
⸻
✨ Special Note for Serious Traders
If you believe in clean levels, disciplined execution, and professional risk control rather than noisy signals, feel free to connect. I work with traders who value clarity, patience, and long-term consistency.
🔒 Trade with structure. Manage risk. Stay consistent.
