Watching For Bullish Continuation Towards Supply ZoneThe current market structure on the 15-minute chart shows a potential shift in momentum, with price attempting to break above a key resistance zone after forming a support base. If bullish momentum persists and price successfully breaks and holds above this resistance area, we could see a continuation of the upward move. The next key level to watch is the supply zone above, which aligns with a previously formed weak high. This zone may act as a magnet for price, drawing it in as buyers aim to fill the imbalance left behind during the previous sell-off. A confirmed breakout above resistance would validate a bullish bias in the short term, with the potential for price to rally toward the upper supply zone, where we may see reactions or a possible reversal depending on market sentiment.
Supply Zone

GBP/JPY - Trade Setup⚡ GBP/JPY 1H Breakdown – Samurai Short Setup ⚡
The beast is showing its hand again – let’s cook this setup 🍣👇
🕐 1H Structure
Price tapped into that 4H supply zone sitting just above the 71% fib pocket. We had a clean shift in market structure (SHIFTTT 🛑), and now price is chilling below that level – classic distribution vibes.
📍 Key Levels
Entry : 200.06 (short trigger after the retest)
Stop : 200.47 (above the BSL / invalidation zone)
Target : 198.00 (next demand / liquidity resting below)
R:R ratio = ~5R – heavy sniper play 🎯
🧠 Technical Breakdown
BSL taken: Buy-side liquidity above the swing high got swiped, perfect trap for the bears.
Structure shift: Market flipped bearish after rejection, confirming supply in control.
Confluence: 4H supply + 71% fib + liquidity grab = textbook high-probability short.
🎯 Play Idea
Looking to ride shorts down into the demand zone around 198.00. If stop gets clipped, that means bulls ain’t done hunting yet, but structure says bears got the edge.
✅ Summary
GBP/JPY lining up a short wave – clean liquidity sweep, structure shift, and high R:R. Samurai precision needed here 🗡.
EURUSD – Bears Still in Control!EURUSD has been overall bearish, trading within a clear descending channel. After rejecting the 1.1950s, price broke structure and shifted momentum to the downside.
At the moment, price is retesting a strong structure zone that aligns with the upper red trendline of the channel. This area acts as a confluence resistance.
As long as EURUSD trades below this zone, the bears remain in control. I’ll be looking for short opportunities from here with the next bearish impulse in mind.
If this structure is broken upward, only then would the short-term bias start to shift. Until then, the path of least resistance remains down.
Do you think EURUSD will respect this resistance, or could we see a breakout to reverse the trend? 🤔
⚠️ Disclaimer: This is not financial advice. Always do your own research and manage risk properly.
📚 Stick to your trading plan regarding entries, risk, and management.
Good luck! 🍀
All Strategies Are Good; If Managed Properly!
~Richard Nasr.

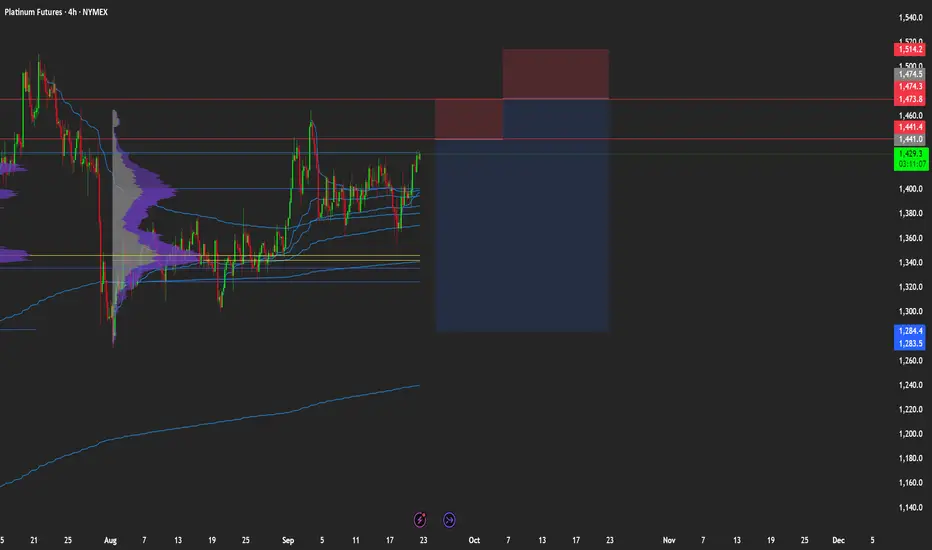
Short Idea on Platinum (PL1!)Based on :
- High Probability of a dxy rally and zb1! short could make precious metals drop
- VP and Avwap levels
- 2 Potential supply zones
GBP/USD - Multi Timeframe Forecast🕰 Weekly View
Weekly is looking toppy near that 1.38–1.39 rejection zone.
Big weekly BOS already in play → momentum pointing down.
Liquidity targets sit way lower at 1.28–1.29 (weekly demand + swing range).
📉 Daily Structure
Daily broke structure → now printing lower highs.
A daily supply zone sits heavy overhead near 1.36–1.37.
If sellers keep pressing, the magnet is clear: 1.30–1.31 daily demand (stacked with fib + HV buy zone).
Any bounces are likely just snack stops for liquidity 🍟 before rolling lower.
⏱ 4H Breakdown
Price is hunting between two short-term options:
1️⃣ Option 1: Tap into the 4H supply around 1.3450–1.3500, reject hard → continuation down.
2️⃣ Option 2: Push a bit higher into the high-volume sell zone at 1.3550–1.3600 → then dump to new lows.
Below, key demand sits at 1.3200 → 1.3000, so that’s the landing pad 🎯.
🎯 Summary
Bias : Bearish until proven otherwise.
Weekly → Failed top, heading toward deeper demand.
Daily → Lower highs into supply, eyes on 1.30.
4H → Watch for rejection at sell zones before shorting.
Big picture → GBP/USD looks like it’s loading up for a multi-week selloff 📉 unless buyers defend hard at 1.32.

EUR/USD - Multi time frame Analysis 🕰 Weekly View
Price recently tapped weekly demand around 1.1600 and reacted strong.
But that wick rejection above 1.1900 screams liquidity sweep 🧹—it failed to hold as a true breakout.
Until we see a clean weekly BOS (Break of Structure) above 1.1900, this is still looking like a range play between 1.16–1.19.
📉 Daily Structure
We’ve got a failed break at the highs, confirming liquidity grab.
Daily is chilling near the 71% fib retracement + demand zone. That’s the hot buy area 🏦.
If price bounces here → eyes on 1.1750–1.1800.
If it fails → expect a sweep into 1.1500 zone before any rocket 🚀.
⏱ 4H Breakdown
Two clear scenarios loading…
1️⃣ Idea 1 (deeper dip): Price breaks below current lows, sweeps liquidity into 1.1550–1.1600 (4H demand). Then we catch buys for a run back to 1.1700+.
2️⃣ Idea 2 (bullish push): Price flips short-term highs at 1.1750 → confirms momentum → next stop 1.1850–1.1900 retest.
Both ideas align with higher-timeframe liquidity games—just depends which way market makers want to hunt first 🎯.
🎯 Summary
Weekly = Range between 1.16–1.19 until proven otherwise.
Daily = Sitting on golden demand/discount.
4H = Watch for liquidity sweep down or break above 1.1750.
Big picture → Still bullish bias if demand holds, but don’t be surprised by one more dip before the climb.

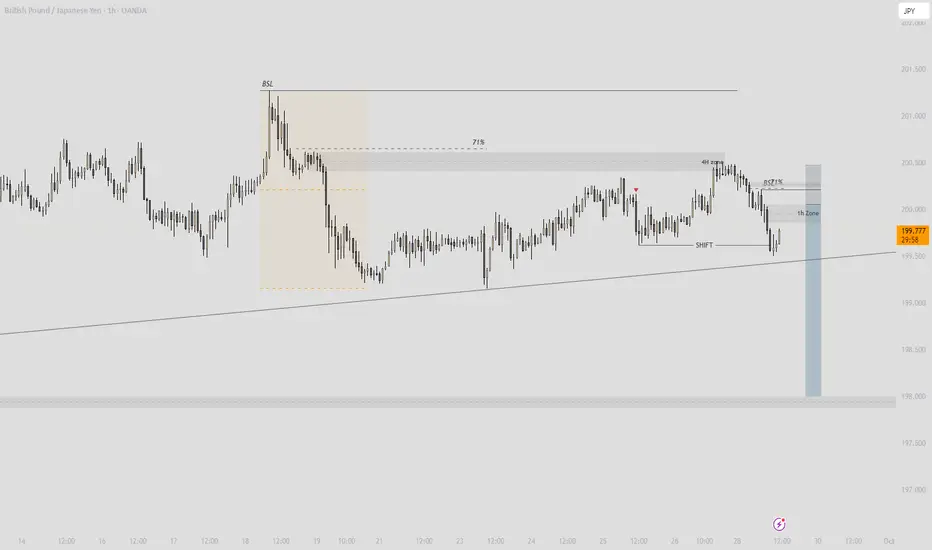
GBP/JPY - NO CONFIRMATION! (Possible failed resistance break)🔥 GBP/JPY – 4H Forecast 💷💴
This pair is dancing inside some serious supply, and sellers are warming up. Let’s break it down 👇
🕰 Market Context
Price tagged into a weekly supply zone and instantly reacted. Sellers defended heavy.
Liquidity sweep above the highs (BSL) → classic stop grab before turning south. ⚡
Daily zone + 8H imbalance already filled, giving sellers control.
📉 Bearish Flow
Market structure flipped bearish with a lower high (LPL) being printed.
1H zone is aligning with 4H supply = confluence for shorts.
Buyer attempts are fading; sell-side pressure is loading for a move into deeper demand.
⚡ Key Zones
Resistance / Supply:
200.40–200.80 (daily/4H supply pocket)
201.20 extreme high liquidity sweep
Support / Demand:
199.00 (short-term intraday demand)
197.80–198.20 = main target demand zone 🎯
🎯 Forecast Path
Expect a possible tiny push back into 200.0–200.4 zone for liquidity grab 📈.
From there → sellers should kick in → drive down toward 198.0 demand. 🕳
Break below 197.8 opens door to 195.5–196.0 macro support.
📝 Trade Idea
Bias: Bearish (supply reaction + liquidity grab confirmed).
Plan : Short from 200.0–200.4 retest.
Targets : 199.0 → 198.0 → extended 196.0.
Invalidation : Clean 4H close above 201.2 kills the short bias.
📌 Summary : GBP/JPY just faked out above highs into weekly supply and is now setting up for a deeper sell-off. Smart money is eyeing the 198.0 demand zone — shorts are the play until 201.2 breaks.

GBP/USD - Sell side Liquidity Available (4H forecast) 🔥 GBP/USD – 4H Forecast 💷💵
Cable’s chart is serving us some spicy structure — let’s break it down 👇
🕰 Market Context
Price rejected hard from that RSL (Resistance Supply Level) at the top of the range.
We’ve since seen a BOS (Break of Structure) to the downside — bears flexing their muscles. 💪🐻
Market reacted cleanly from a daily demand zone earlier, but momentum is stalling.
📉 Bearish Flow
Clear shift in market structure (SHoF) confirmed.
We’re chilling inside a 4H supply zone, which already pushed price down once.
Internal range showing liquidity being swept → fuel for a possible continuation lower.
⚡ Key Levels
Support zones:
1.3400–1.3410 (extreme range support)
1.3350–1.3370 (internal range demand)
Resistance :
1.3500–1.3520 → sell-side zone of interest.
🎯 Forecast Path
Expect a reaction bounce into the 4H supply (1.3490–1.3520) 📈.
If supply holds, watch for continuation down toward 1.3350–1.3370 🕳.
Breaking below that → opens the door to 1.3150 strong support (next liquidity magnet).
📝 Trade Idea
Bias : Bearish until market proves otherwise.
Plan : Look for shorts on pullbacks into 1.3490–1.3520 zone.
Targets : 1.3400 → 1.3350 range.
Invalidation : Break & close above 1.3550 kills the bearish play.
📌 Summary : GBP/USD is in bearish flow after the RSL rejection & BOS. Supply zones are respected, liquidity is building below — shorts into demand are the play until 1.3550 breaks

USDJPY - Red Low or Orange Resistance: Your Trigger Map!USDJPY squeezed off 146.0 and is testing the 148.8–149.2 orange resistance on the 4H while momentum cools.
Here’s the plan 🔑
If the last low in red is broken downward, the bears take over, and I’ll look for 147.2 first, then the 146.0 support zone.
If the orange resistance is broken upward and holds, I’ll expect continuation toward the upper supply at 150.7–151.0 (with 150.0 as a waypoint).
What’s your move => fade a failure at the orange band, or buy a clean break and hold into 150s? 🤔
⚠️ Disclaimer: This is not financial advice. Always do your own research and manage risk properly.
📚 Stick to your trading plan regarding entries, risk, and management.
Good luck! 🍀
All Strategies Are Good; If Managed Properly!
~Richard Nasr

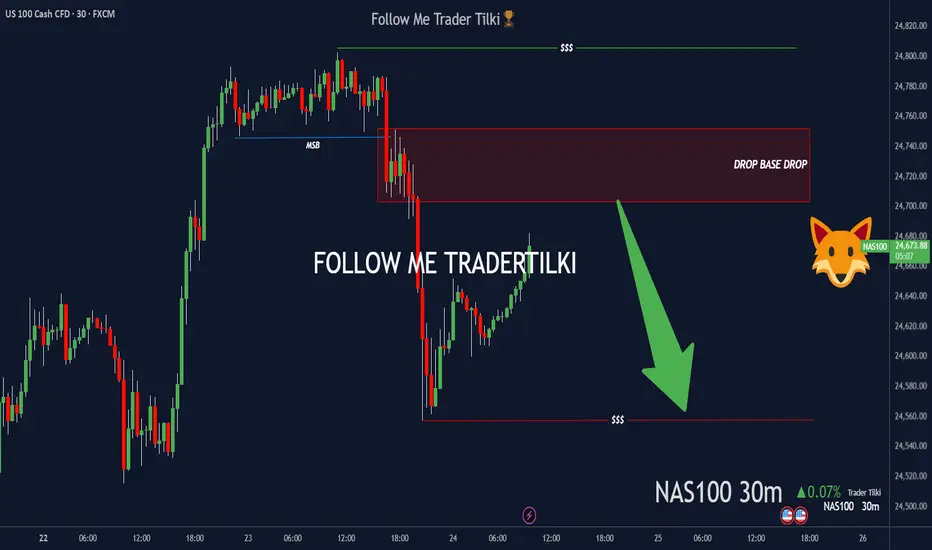
Pressure’s buildin’ on NAS100—could pop any minute.Hey Guys,
Once NAS100 hits my SELL zone, I’m pulling the trigger—targeting 24557.06
• Entry: 24752.05 or 24703.29
Set the stop point according to your own margin, my friends.
Every like you drop pushes me to share more setups like this. Big thanks to everyone showing support!
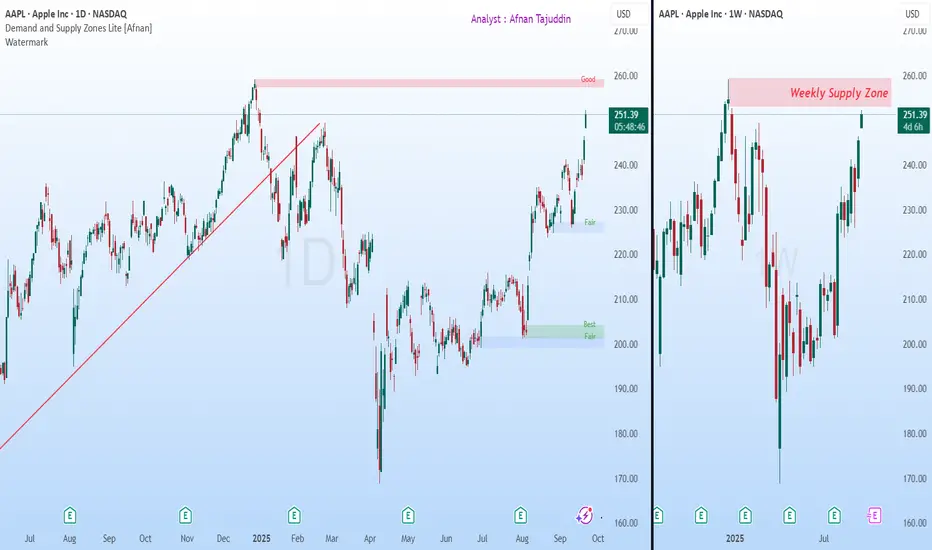
Apple (AAPL): Price Nears Critical Supply Zone at All-Time HighsApple’s chart is currently showing signs of caution as the price climbs into a significant supply area. Both the weekly and daily timeframes highlight strong supply zones that traders should carefully observe.
Weekly Supply Zone
On the weekly chart , Apple is approaching a very strong supply zone
The supply area coincides with all-time highs , making it even more significant.
🔎 Daily Supply Zone Confluence 🔎
The daily chart adds further weight to this setup:
The current daily supply zone is nested inside the weekly supply zone .
This supply zone is powerful because its follow-through candle not only rejected higher prices but also broke the uptrend trendline .
In simple terms, this supply zone has already shown its strength once by shifting the trend from up to down .The fact that this zone caused a trend change earlier makes it a major obstacle for bulls.
Now that price is revisiting this zone again, it signals a possible area for profit booking.
With Apple near its all-time highs and supply confluence in place, risk-reward favors caution.
🎯 Trading Perspective
Traders should keep an eye on this zone, Consider booking profits as price approaches this heavy supply area.
“Strong supply zones often act like brick walls — they don’t break easily without significant force.”
⚡ At these levels, patience and discipline are key — don’t let greed take over when charts are signaling caution. 📉🍏
💡 Trading is not about catching every move — it’s about protecting capital and letting opportunities come to you. 🚀📊
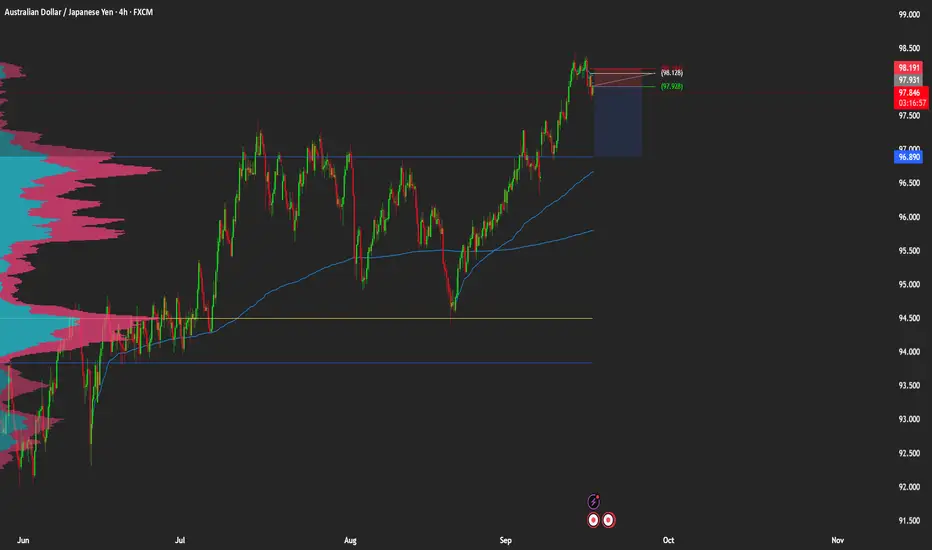
Short Idea On AUDJPYBased on :
- Supply zone and weekly avwap as entry level
- VP target 4rr
- Cot Analysis
- Quantitative Analysis
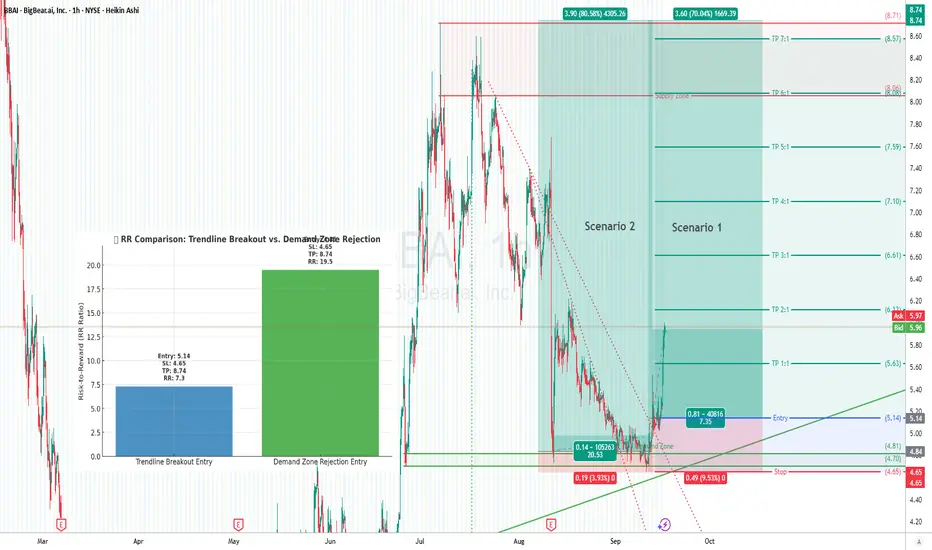
Demand Zone Rejection vs. Trendline Breakout📚 Trading Education:
Demand Zone Rejection vs. Trendline Breakout Entries
In trading, where you enter makes a massive difference in your Risk-to-Reward (RR) ratio. Two common approaches:
🔹 Scenario 1: Entry at the Trendline Breakout
Wait for confirmation → price breaks the downtrend line.
Entry: $5.14
Stop Loss: $4.65 (below demand)
Risk: 0.49
Target: $8.74
Reward: 3.60
RR = ~1:7.3
✅ Higher probability (confirmation from breakout).
❌ Smaller RR because you’re entering later.
🔹 Scenario 2: Entry at the Demand Zone Rejection
Enter aggressively on the first demand zone bounce.
Entry: $4.85
Stop Loss: $4.65
Risk: 0.20
Target: $3.90 upside → $8.74
Reward: 3.90
RR = ~1:19.5
✅ Insane RR potential.
❌ Higher risk of fakeouts (price might pierce deeper before breakout).
The Takeaway
Breakout Entry = safer, confirmed, good RR (~1:7).
Demand Rejection Entry = aggressive, riskier, but monster RR (~1:19).
👉 The best traders scale in: small position at demand, add on breakout. That way you capture the high RR edge while also waiting for confirmation.
⚖️ Risk Management Rule
Always risk just 1–3% of account equity.
Huge RR setups don’t mean overleveraging — stick to risk discipline.
"Opportunities come infrequently. When it rains gold, put out the bucket, not the thimble." – Warren Buffett
DEX 30 - Forecast🕰 Weekly
Sitting right on top of that weekly demand (22,700–23,200). Buyers are trying to defend, but if this floor gives way, we’re diving deeper. BOS is still intact from the upside, but momentum looks tired.
📉 Daily
Heavy drop straight into demand. Now the real question → do we bounce back into 23,700–24,000 supply for a cheeky rejection… or do we crack lower straight away? 👀
⏱ 8H
Clean ChoCH to the downside. Market tapped demand, so a little relief rally is on the cards. But watch that supply zone — sellers waiting up there with bags packed.
🎯 Outlook
Short-term → bounce into supply ✅
Mid-term → bearish pressure still in control 🔻
Lose 22,700 and we could easily hunt liquidity towards 22,000–22,300.
Bias : Short-term pullback → Mid-term bearish

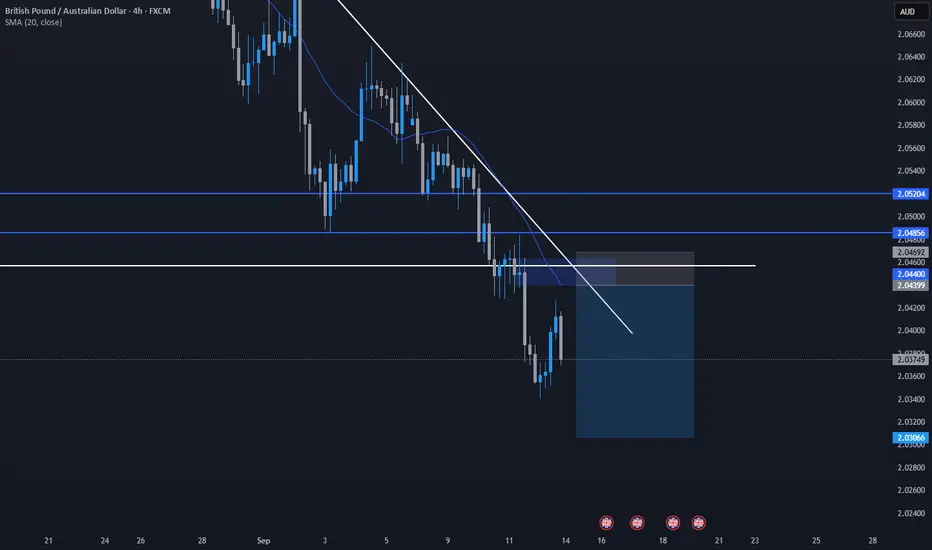
High Probability Setup on GBPAUDSupply zone + support turned resistance + trendline makes this a high probability trade but please wait for entry confirmation
NZD/USD - Forecast🕰 Weekly View
Price is still respecting the monthly downtrend. Strong support sits lower at 0.55–0.56, but as long as price stays above recent structure, buyers could defend. Weekly imbalance still unfilled above.
📉 Daily Structure
Resistance: 0.61–0.62 (no clear supply above until that zone).
Support: 0.58–0.59 demand block.
Currently ranging mid-structure, building a base for the next push.
⏱ 4H Breakdown
Price is holding an 8H demand zone at 0.59 and has built a buyer level there. Short-term resistance sits near 0.61, where rejection could send us back to retest 0.59 before continuation.
🔎 Outlook
Scenario 1 → Retest 0.59 demand, then push into 0.61–0.62 supply.
Scenario 2 → Failure to hold 0.59 leads to deeper move into 0.56 strong support.
Bias: Pullback into demand → bullish continuation toward 0.61–0.62.

USD/CHF - Forecast 🕰 Weekly View
Price remains under the weekly downtrend, with structure holding below new resistance at 0.84. Market continues to respect the wedge pattern, with downside pressure aiming toward 0.78–0.79 weekly demand.
📉 Daily Structure
Resistance: 0.82–0.84 supply block.
Support: 0.78–0.79 demand zone.
Price is stuck in compression — either we sweep into resistance for rejection lower, or break above wedge to shift momentum bullish.
⏱ 4H Breakdown
Price is consolidating inside a wedge formation. Overhead resistance sits at 0.80–0.805, while a clean break below wedge support opens the door toward 0.79–0.788 demand.
🔎 Outlook
Bias remains bearish while under 0.82 resistance, with potential pullback into 0.79 demand. However, a breakout above 0.82–0.84 could flip structure bullish.
Bias: Bearish pressure → mid-term bearish unless breakout above 0.82–0.84.

Price Reacting at Supply ZoneMarket is bearish and came back up to supply zone so we will wait for break of structure and to go short

USD/JPY - Weak Support suggests breakoutHi all traders. Ive done a few breakdowns of this market now all following similar fundamentals.
Here is my conclusion:
Market is currently ranging. We are approaching a Strong 8H Supply zone facing close to a much tested Support.
Im looking for a strong rejection off this Supply into this support with enough pressure to make Bearish movements through this zone. Monthly Imbalance suggests Buyers are sitting lower so I will be aiming beyond this support.
Good luck to all and I follow me for more updates.

NZD/USD Approaches Key Supply ZoneThe NZD/USD is currently approaching a notable supply zone on the daily chart, indicating a potential area where selling pressure may intensify. According to the Commitment of Traders (COT) report, there has been a slight increase in short positions among Non-Commercial traders, suggesting that large speculators are beginning to bet on a decline. Conversely, retail traders are predominantly going long, which often acts as a contrarian indicator, hinting at possible exhaustion or a forthcoming reversal.
This confluence of signals points toward the possibility of an additional bearish impulse in the near term. Our forecast aligns with this view, as the DXY (US Dollar Index) shows signs of potential strength and could surge higher, further pressuring the NZD/USD pair. Moreover, seasonal analysis indicates a historically bearish trend during this period, adding another layer of confirmation to the outlook.
What are your thoughts on these developments? Do you see the potential for a downside move reinforcing, or are there other factors to consider?
✅ Please share your thoughts about NZDUSD index in the comments section below and HIT LIKE if you appreciate my analysis. Don't forget to FOLLOW ME; you will help us a lot with this small contribution.

EUR/USD Nears Key Supply Zone Amid Rising Short PositionsThe EUR/USD is currently approaching a significant daily supply zone. This is an area where, in the past, the price briefly touched before reversing and heading downward. Now, the currency pair is nearing a second test of this supply level, which could signal that institutional traders are preparing to add more short positions. Historically, these supply zones tend to act as resistance points, and the repeated testing suggests a potential buildup of selling pressure.
Looking at the recent positioning of different market participants, last week saw an increase in short positions among Non-Commercial traders, indicating that large speculators are betting on a decline in the EUR/USD. Conversely, Commercial traders are at their lowest levels since August 2024, which typically signals that those involved in hedging or commercial transactions are less inclined to support the current price levels. Meanwhile, retail traders continue to add to their positions, often acting as a contrarian indicator.
In tandem, the US dollar itself is entering a demand zone, as evidenced by the increase in Non-Commercial contracts on the dollar index. This suggests that speculative traders are betting on the dollar strengthening, which aligns with the potential for a downside move in EUR/USD.
Given these combined signals—the approaching supply zone, the increase in short positions among large traders, and the dollar entering a demand area—I am looking for a possible shift towards the downside for EUR/USD. This could lead to a strengthening of the US dollar as the market prepares for a potential reversal or continuation of the bearish trend.
Additionally, I will include my analysis of the DXY (US Dollar Index), which remains valid and supports this perspective. The DXY’s current positioning and technical setup reinforce the likelihood of the dollar gaining strength in the near term. Overall, the market is showing signs that favor a downside move, and I will be monitoring these levels closely for confirmation.
✅ My DXY Point of view:
✅ Please share your thoughts about EURUSD index in the comments section below and HIT LIKE if you appreciate my analysis. Don't forget to FOLLOW ME; you will help us a lot with this small contribution.

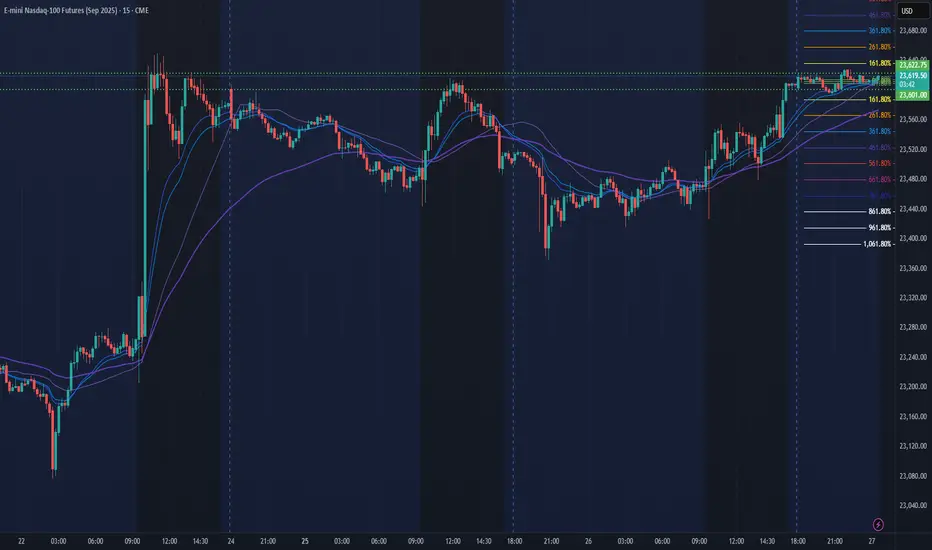
NQ Power Range Report with FIB Ext - 8/28/2025 SessionCME_MINI:NQU2025
- PR High: 23622.75
- PR Low: 23601.25
- NZ Spread: 48.0
No key scheduled economic events
Session Open Stats (As of 12:25 AM 8/28)
- Session Open ATR: 284.71
- Volume: 15K
- Open Int: 280K
- Trend Grade: Long
- From BA ATH: -1.8% (Rounded)
Key Levels (Rounded - Think of these as ranges)
- Long: 24382
- Mid: 23239
- Short: 22096
Keep in mind this is not speculation or a prediction. Only a report of the Power Range with Fib extensions for target hunting. Do your DD! You determine your risk tolerance. You are fully capable of making your own decisions.
BA: Back Adjusted
BuZ/BeZ: Bull Zone / Bear Zone
NZ: Neutral Zone
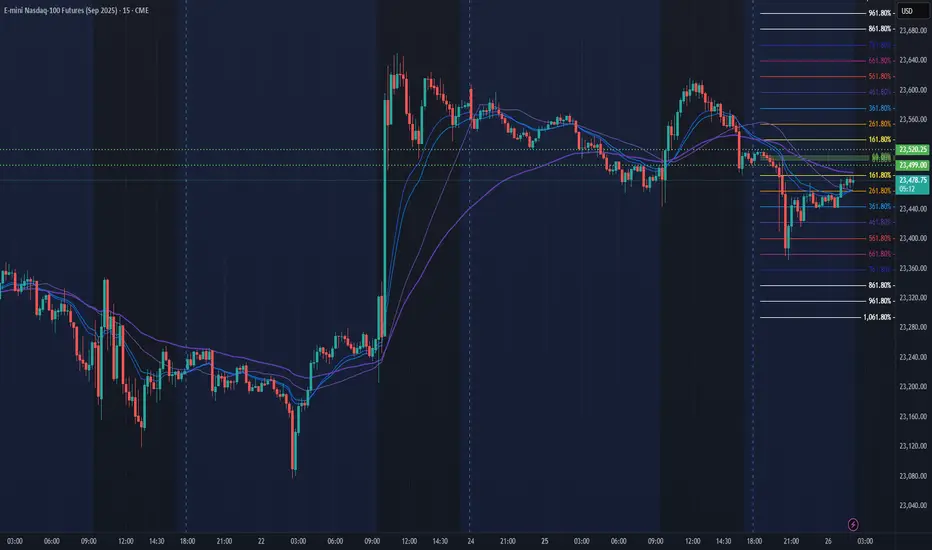
NQ Power Range Report with FIB Ext - 8/27/2025 SessionCME_MINI:NQU2025
- PR High: 23520.25
- PR Low: 23499.00
- NZ Spread: 47.75
Key scheduled economic events:
08:30 | Durable Goods Orders
10:00 | CB Consumer Confidence
Session Open Stats (As of 12:25 AM 8/27)
- Session Open ATR: 297.44
- Volume: 43K
- Open Int: 281K
- Trend Grade: Long
- From BA ATH: -2.6% (Rounded)
Key Levels (Rounded - Think of these as ranges)
- Long: 24382
- Mid: 23239
- Short: 22096
Keep in mind this is not speculation or a prediction. Only a report of the Power Range with Fib extensions for target hunting. Do your DD! You determine your risk tolerance. You are fully capable of making your own decisions.
BA: Back Adjusted
BuZ/BeZ: Bull Zone / Bear Zone
NZ: Neutral Zone