BTC/USDT 4H Chart Review🧭 1. Main Market Structure
The chart shows:
A broad downward channel that has been in place since the end of October.
The price bounced off the upper line of the channel, made a local upward impulse (orange trend line), and then broke it, returning back towards the lower regions of the channel.
➡️ This means that the dominant trend is still downward, and upward bounces are corrections.
🧨 2. Current Chart Situation
BTC has broken through:
the local uptrend (orange line)
fell below the 88,500–89,000 zone (green)
is heading towards further support levels
Currently, the price looks like a typical retest of the broken structure and a continuation of the decline.
🟩 3. Key Price Levels (S/R)
Resistance (upper – green):
91,600 – 92,000 – key level, a breakout would negate the local downtrend
95,000 – 97,500 – upper range of the descending channel
Support (lower – red):
85,300 – 85,800 – local support (price is currently reacting here)
83,000 – 83,100 – strong horizontal support
79,800 – strong support, historically strong in this timeframe
76,600
75,000 – lower band of a potential drop + near the lower boundary of the channel
➡️ The most logical downside targets are 83,000 and 79,800.
📉 4. Descending Channel (black) (lines)
The price has rebounded from the upper range of the channel and is heading towards the lower range.
The middle line of the channel has been broken down → a signal of trend continuation.
The lower boundary of the channel indicates a potential low around 75,000–78,000.
🔄 5. Stoch RSI
Currently oversold in the oversold zone, it is starting to curve upwards.
In a downtrend, long signals are weaker, but a short-term rebound is possible.
🧭 6. Scenarios
📉 Bearish scenario (more likely)
Technical rebound to 88,500 – 89,000
Rejection from this zone → continued decline
Targets:
83,000
79,800
Extremes: 76,000 – 75,000
➡️ This scenario is consistent with the trend and a rebound from the upper channel.
Support

Ethereum (ETH) Rejected from $3K — Key Support AheadETH recently got rejected at the critical $3,000 resistance, a psychological and technical level that’s held firm amidst broader market volatility. However, bulls shouldn’t panic just yet — Ethereum is now approaching a major support zone between $2,640 and $2,770, where it has previously found strong buying interest. If macro conditions stabilize, momentum could return quickly from this level.
💡 Trade Setup
Entry Zone: $2,640 – $2,770
Take Profit Targets: $3,370 and $4,000
Stop Loss: $2,187
This setup offers a strong risk-reward profile, especially if ETH rebounds as it has done historically from this zone. Watch for volume confirmation and potential bullish divergences on lower timeframes to time entries.

GBPJPY: BUY IT!Hello Traders
This is the 1Y channel!
we are around a strong static level and mid of a bullish channel!
As it is obvious!
If we see a smooth correction! We will enter the trade!
Have fun!

AUD/JPY-Supply Zone Rejection Signals Potential Bearish ReversalAUD/JPY is showing signs of weakening bullish momentum as price reacts sharply from the Strong Supply Zone at the top of the chart. This area has historically acted as a major distribution zone, and the latest rejection suggests that sellers are stepping back into control.
After forming multiple double-bottom rallies, price pushed upward but failed to sustain momentum beyond the supply ceiling. The sharp rejection indicates that liquidity has been collected from trapped buyers, and the market may now be preparing for a deeper corrective move.
The structure around the neckline and mid-buyer zone is critical. A break below this area—especially below the 100.000 level—would confirm a bearish shift. The chart already highlights a possible breakout-retest scenario, where price could break the buyer zone, retest it from below, and continue downward.
If sellers maintain pressure, the next target lies near the Support Zone around 98.500, aligned with previous range lows. A deeper move could even reach the broader Demand Zone Area, completing a full bearish correction.
Overall, the chart is signaling a potential reversal from supply, with sellers gaining strength and momentum shifting toward the downside as long as price remains below the supply zone and fails to reclaim the neckline.

USD/JPY — Poised for Bullish Reversal at Key Demand ZoneUSD/JPY is currently testing a major demand zone, a level where price has historically found strong buying interest. This area has acted as a structural support multiple times, making it a high-probability zone for a bullish reversal.
The recent price action shows slowing downside momentum, with smaller candles and wicks rejecting lower levels — signaling that buyers are stepping in. If the market holds this zone, we could see:
A bullish engulfing candle or pin-bar formation confirming rejection.
A strong upward impulsive move targeting previous swing highs.
Increased buying momentum as traders enter at a low-risk point.
For traders looking to go long, this setup allows for strategic entry near the support zone, with a stop-loss just below the demand area to manage risk. The upside potential aligns with prior highs, making it an attractive risk-to-reward opportunity.
Key Point: Wait for confirmation via a bullish candlestick pattern or a retest of the zone before entering to maximize probability of success.

RANGE BREAKOUT WITH RETEST & DOWNSIDE CONTINUATION SETUPRANGE BREAKOUT WITH RETEST & DOWNSIDE CONTINUATION SETUP
The EUR/GBP chart displays a well-defined market structure transition from accumulation ranges into a broader bearish cycle. Initially, the price moved through multiple tight ranges, indicating accumulation and liquidity building on both sides. Each breakout from these ranges created short-term bullish impulses, but the upward momentum consistently weakened as price approached the strong supply zone.
Once price tapped the major supply zone, selling pressure increased sharply, marking the start of a clean descending channel (seller zone). This channel represents controlled distribution by sellers, which pushed the market back below the previous mid-range support.
The most important structural event is the bearish breakout from the central range support. After the breakout, price returned for a textbook retest, where previous support flipped into resistance — a classic confirmation of bearish continuation.
The market is now positioned between key liquidity levels, and unless the retest zone is reclaimed, probability favors a continuation move towards the next support level. If this level breaks, further decline toward the lower support base becomes the next logical target.
Overall sentiment remains bearish, with sellers controlling the flow, and any long positions remain risky unless the market reclaims the broken support area and breaks structure to the upside.

BNB/USDT ANALYSIS - 4H interval🔶 1. Current Trend and Market Structure
The chart shows:
A clear short-term uptrend – the price is respecting the ascending yellow trend line.
An increase after a bounce from the SMA 50 (green).
However, there are still no new higher highs – the market is consolidating between 888–910.
➡️ Short-term trend: up
➡️ Medium-term trend: neutral/consolidation
🟩 2. Key Support/Resistance Levels
Resistance:
910–912 USDT – currently a key resistance, tested multiple times.
930–935 USDT – local higher resistance (green zone on your chart).
957–960 USDT – stronger resistance from D1 (blue SMA95 visible in the screenshot).
Supports:
USDT 889–893 – local support and the current battleground.
USDT 871 – SMA 50 + previous swing low.
USDT 849 – powerful support from the HTF.
USDT 837 – the final “lifeline” of the bullish structure.
📈 3. Indicators (MACD, RSI)
MACD
MACD > 0 – positive.
The MACD line is starting to point upwards → a signal of bullish momentum.
No divergence.
➡️ MACD supports the bullish scenario.
RSI
RSI ~59 – a healthy zone, far from overbought.
RSI breaks the local downtrend → increasing buyer strength.
➡️ RSI confirms the bullish trend.
🟧 4. Key Price Action Now
The price is currently approaching resistance at 910–912 USDT and simultaneously touching the local trend line.
This is the market's decision point.
A breakout → opens the way to 930–935.
A rejection → a return to 889, and below 871.

BTC Short-Term 15m Chart📉 BTC 15M — Short-Term Analysis
1. Key Levels from the Chart
Support
$90,400–$90,450 – strong, repeatedly tested (orange zone).
$90,178 – lower support (thin red line).
$89,460 – deeper daily support.
Resistance
$90,900–$91,000 – local resistance zone.
$91,214–$91,545 – SMA 72 / SMA 200 (yellow and blue) = strong dynamic resistance.
$91,800–$92,200 – higher structural resistance.
🧠 2. Market Structure
Short-term trend (15m)
Price remains below the SMA 200 and SMA 72 → bearish momentum.
Lower highs and lower lows are visible → bearish structure.
Narrower range: 90,400 – 90,900 → price compression / consolidation.
📊 3. Indicators
MACD – neutral / slightly bearish
Histogram hovers around zero → lack of strong momentum.
Recent downward crossover → downward pressure.
RSI – 48 (neutral)
Not oversold yet, but:
RSI is forming a bearish divergence from previous highs.
RSI often bounces from 50 in a downtrend → confirms bearish pressure.
🔎 4. What's happening now?
The price is retesting the $90,400 zone, a key defensive level for bulls.
The structure indicates:
supply pressure,
buyers exhausting themselves below the 200 SMA,
possible breakout below if 90,400 breaks.
🎯 5. Short-Term Scenarios (15m)
🔻 Bearish Scenario (more likely)
If 90,400 falls:
Target 1: 90,180
Target 2: 89,460
Target 3: 88,960
The structure strongly suggests this because:
Price below the 200 SMA
Weak momentum
No strong rebound from the lows
🔼 Bullish Scenario (only after breaking 90,900)
If the market rebounds from 90,400 and breaks 90,900:
Target 1: 91,200 (SMA 72 + 200)
Target 2: 91,550
Target 3: 91 800

ETH/USD 1D chart review1️⃣ Trend and general context
• ETH is trading after a sharp decline from its local high of ~4,000+.
• The price rebounded from a quite strong support zone around ~2,750–2,800.
• Current price: ~USD 3,034 → the market is testing the first local resistance.
Short-term trend: down, but a rebound and the first signs of reversal are visible.
Long-term trend: still upwards (HL/HH on large intervals).
⸻
2️⃣ Key Levels (from your chart)
🟩 Resistances
• USD 3,475 – key resistance + SMA (blue)
👉 if ETH breaks this level and closes 1D above → strong bullish signal.
• USD 4,061 – major resistance from previous highs.
🟥 Support
• USD 2,757 – the nearest strong support after breaking the trendline.
• USD 2,126 – very key macro support (bottom of consolidation).
⸻
3️⃣ Medium SMA
From your chart:
• Red SMA #1 – price is just above it → first positive signal.
• Blue SMA #5 – Acts as resistance and is currently being tested from below.
• Green SMA #2 – higher, acts as resistance at ~USD 3.475.
➡ The price must return above the blue and green SMA to confirm the return of the upward trend.
⸻
4️⃣ MACD
• The MACD at the bottom of the chart begins to curl upwards.
• The histogram decreases towards zero → the downward momentum weakens.
• Bullish cross is still missing, but it's getting closer.
Conclusion: Early signal of trend reversal, but not confirmed.
⸻
5️⃣ RSI
• RSI is in the zone around 40 → quite low, but not extremely.
• Slight divergence: the price made a lower low, the RSI made a higher one.
👉 This is a bullish signal, but only in combination with a resistance breakout.
⸻
6️⃣ Price Action
You can see:
• A long rising candle after a bounce from below.
• We are approaching the first important resistance at ~3.100–3.150.
To confirm continuation, you need:
✔ Closing of the 1D candle above ~3.150–3.200.
⸻
🎯 What might happen next?
Bull scenario (more likely if BTC also increases)
1. Breakout 3,150–3,200 → retest → move to:
• USD 3,475 (major resistance + SMA)
• then 3,800+
2. MACD makes a bullish cross → momentum is growing.
Probability: ~60%, but confirmation only after the breakout.
⸻
The Bears Scenario
1. Rejection from SMA (blue) and return below 3,000
2. Down to 2,750-2,800 again
3. If this breaks → move towards $2.126
Probability: ~40% at this point.

Swiss Franc: Approaching Key ER SupportThe Swiss franc is now testing the lower boundary of the Expected Range (ER) — a zone for potential pause or bounce.
Also
this ER level aligns perfectly with a visible liquidity cluster (marked with arrow) .
📌 In other words:
It's not only a statistical support — it’s a confluence = higher probability reaction.

QUICK ANALYSIS (1H) — BTC BOUNCED FROM RESISTANCE✅ 1. Breakout from the downward trendline
On the chart, I see:
a yellow downward trendline—it has been broken,
the candlestick dynamically breaks through it and closes above it.
➡️ This is the first signal of a shift in momentum to upward.
✅ 2. Price is testing the 200 SMA (blue)
BTC is currently:
touching the 200 SMA,
bounces slightly downward—a classic reaction to strong resistance.
➡️ Until we break through the 200 SMA, the market remains in a downtrend.
🟩 3. Nearest resistance levels (green levels on your chart):
90,400 USDT – current resistance (reaction already visible)
92,500 USDT – next important level
93,200–94,000 USDT – strong supply zone
94,900 USDT – strong level from previous bounces
➡️ The closer the price gets to 94–95k, the greater the chance of a downward rebound.
🟥 4. Nearest support levels
From your red levels:
88,700 USDT – first level of defense
87,500 USDT – key support
85,500 USDT – major local bottom
84,150 USDT – extreme support
➡️ If BTC returns below 87.5k, the correction will deepen.
📊 5. RSI — Neutral-Bullet
RSI ~ 55,
Not yet overbought,
RSI trend is increasing.
➡️ There is room for further upward movement.
📉 6. MACD — Bullish Signal
MACD has crossed the signal line upward,
the histogram is rising.
➡️ Upward momentum, shorting here is risky.

EURUSD: double Scenario
Hello Traders,
this is the long-term channel!
We are truly in the way of more bearish days!
However, in the more natural timeframe we see a possible Head and shoulders!
I'm not a pattern trader! but sellers were not able to goes further than the HEAD!
So???
They are not strong enough! new buyers are in! may be a peace in Ukraine could alter it!
but I'm still more bearish for the term of my trade length! Although I aim to long after confirming the H&S and also breaking the latest strong level and breaking the bearish channel up!!

Will LINK recover after the information about the ETF?📌 1. Main trend
• A clear downward trend, confirmed by a strong, long-term downward trend line (black).
• The price is testing this line from below for the first time in a long time → a key moment.
If the price breaks it and retests, the trend structure changes.
⸻
📌 2. Current situation
Price currently: ~13.02 USDT
Upcoming levels:
Support
• 12.71 – local support (yellow line).
• 11.75 – strong support, here a demand reaction appeared.
• 9.95 – the greatest support on the chart (red line).
Resistances
• 1:30 p.m.–1:50 p.m. – trend line test; key resistance.
• 15.25 – the first significant resistance in the upward trend.
• 17.78
• 19.77
• 21.70
⸻
📌 3. Stoch RSI (at the bottom of the chart)
• The oscillator is high, approaching the overheating zone (80+).
• This signals a possible short-term correction, unless the downtrend breaks out - then it may stay high for a long time.
⸻
📌 4. Key setup
🔵 Bullish (upward scenario)
Confirmation of growth appears only if:
✔ The price will break the black downtrend line
✔ Will close the 12H candle above approximately 1:50 p.m
✔ Will retest and bounce up
Targets after breakout:
1. 15.25
2. 17.78
3. 19.77 - only here it will encounter stronger resistance
⸻
🔴 Bearish (downside scenario)
If the price does not break the trendline and is rejected ↓:
❗ Downside targets:
• 12.71 (local support – first test)
• If it breaks → 11.75
• And in case of market panic → 9.95
The latter is a powerful level - the level of accumulation from earlier months.
⸻
📌 5. What looks best?
Currently:
• The market rebounded from the support at 11.75 – healthy demand response.
• However, the price is below a strong trendline, so this is a place where it may be rejected.
➡ If I were to indicate the most likely short move:
Light correction → retest 12.71 → decision.
⸻
📌 6. Summary
• A key moment for LINK - it decides to break the downward trend.
• Only a close above 1:50 p.m. gives a real upward signal.
• Failure to break the trendline = possible return to 12.71 → 11.75.

GBP/USD – 4H Technical OutlookMarket Bias:
Range (buyers holding support, sellers defending resistance)
Key Levels:
• Resistance: Major 4H zone where sellers are consistently active
• Support: Strong 4H demand + order block recently respected
• Market Structure: Price has already formed a higher high, signaling bullish intentions
Reasoning:
Price is currently trapped between a strong resistance above and a strong support/order block below.
Buyers successfully defended the support, creating a higher high — a sign of bullish strength.
However, sellers are still aggressively positioned at the resistance zone, creating a tug-of-war scenario.
Trade Idea:
Look for bullish continuation only if support continues to hold and price rejects the zone with strength.
Potential Entry:
• At/near the 4H support or after a clean bullish rejection candle
Stop Loss:
• Below the order block / support structure

Ripple Is Still Bullish Despite Recent Spike LowerRipple is still bullish despite the recent spike lower, which can act as a strong support from a technical and Elliott wave perspective.
Ripple is a blockchain-based digital payment protocol designed for fast, low-cost international money transfers. Its native cryptocurrency, XRP, helps facilitate transactions between different currencies, making cross-border payments quicker and cheaper compared to traditional systems like SWIFT.
Ripple sold-off recently and it made a huge spike lower due to the market manipulation, but these spikes usually act as a strong support. It still looks like a complex W-X-Y correction in wave IV on a daily chart, which can now resume the bullish trend within final wave V of (V).
In the 4-hour chart, we can see a massive spike down, but out of wave (B) triangle pattern, so it’s a penultimate move into wave (C) of Y. With the current strong rebound and recovery, seems like bulls are back in the game, and it looks to be forming a bullish setup with waves 1 and 2. So watch out for further rally within wave 3 of a five-wave bullish cycle, especially if jumps back into 2.7 area and later above 3.10 bullish confirmation level.

BTC/USDT 4H Chart Review1. Local trend
The chart shows:
✔️ Clear upward trend - the price respects the rising trend line (black diagonal).
✔️ The last candle broke strongly upwards, which suggests bullish momentum.
⸻
🟢 Key resistance levels (green lines)
1. 90,352 USDT - the first stronger resistance (it looks like the price is just reaching it).
2. 93,271 USDT - another strong resistance; there may be a clearer sell-off here.
➡️ If it breaks 90,352 with high volume, the path to ~93k is open.
⸻
🔴 Key support levels (red lines)
1. 86,890 USDT - Local Support/Trendline Retest.
2. 84,989 USDT - Stronger support.
3. 82,545 USDT - key support for the growth structure.
➡️ Loss of 86,890 + breakout from the trendline may mean a correction to around 85,000.
⸻
📉 RSI / Stochastic (bottom of the chart)
Stochastic RSI is:
✔️ In the growth phase
✔️ Approaching overheating level (80-100)
➡️ This often means that the upside momentum continues, but a local correction may be imminent, especially at the 90,352 resistance.
⸻
📌 Summary
🔼 Bullish Signals:
• Uptrend intact
• Breakout with an upward impulse candle
• The price is rebounding from the trend line
🔽 Bearish Signals:
• Stochastic RSI is approaching the “high” zone
• The price is under important resistance at 90,352
• Local pullback possible if resistance is not broken
⸻
⭐ Short-term scenarios (4H)
👉 Bullish scenario
• Maintaining price above 88,800-89,000
• Breakout 90,352
➡️ Target: 93,000 – 93,300 USDT
👉 Bears scenario
• Rejection from 90,352
• Back below 88,900
➡️ Downside target: 86,900 → 85,000 USDT

BTC/USDT 1W chart review📉 1. Market structure – trend and break
• The chart shows a black upward trend line that has led the market since 2023.
• This line has been clearly broken, which means:
✔ weakening of the structure
✔ the first serious threat to the upward trend
✔ possible move towards lower support levels
A breakout of the weekly trendline usually ends a medium-term upward trend.
⸻
📉 2. Current price
BTC is around USDT 87,770 and the weekly candle is heavily bearish.
This means that buyers do not react to the first support.
⸻
🟥 3. Most important support levels
1) 92,086 USDT – local resistance zone (previously support)
• Price has broken this support from above → now acts as resistance.
• To return to growth, BTC would have to close the week above this zone.
2) 84,583 USDT – first major support
• Price is just above the zone.
• If this fails → there will be an increased chance of continued declines.
3) 74,324 USDT – key macro support (MAIN LEVEL)
This is the most important level of the chart.
• This is the level where demand must occur if BTC is to maintain its long-term structure.
• Breaking this barrier will open the way to declines even to around 60-65k.
⸻
🟩 4. Resistance levels
1) USDT 92,086
Closest resistance – key to recovery.
2) USDT 100,794
Big weekly resistance that stopped the market earlier.
Only a breakout → continuation of the bull market.
⸻
📊 5. Stochastic (week) – very important
At the bottom you can see Stochastic sliding down, almost at the value of 0-20 (oversold).
Interpretation:
• There is no buy signal yet because the lines have not turned upwards.
• Weekly momentum is still down, so the pressure on support continues.
📈 7. Scenarios
Bullish (less likely for now)
1. Maintaining 84.5k
2. Stochastic weekly turns upwards
3. Price returns above 92k
➡️ Target: 100.7k
Bearish (more likely)
1. Breakthrough 84.5k
2. Retest from the bottom
3. Drop to 74.3k
➡️ If 74k breaks → 65-68k

XRPUSD testing monthly 20EMA supportCritical area for XRP bulls. If the Monthly 20EMA holds (overlayed on this 4H chart) we could see price retrace to the high 2.20s/low 2.30s to test the resistance at the Monthly 10EMA. Needless to say that the RSI is oversold on multiple time frames but with the algorithm set to "sell off" the RSI has become useless for now. As always, on a play like this, tight SL and sniper entries.

ETH/USDT 1W review1. Broken uptrend
The black upward trend line has been clearly broken down.
➡️ This is a signal of a change in the market structure from uptrend → downtrend.
⸻
2. The current candle is under the important support of USD 3,070
You marked the ~3070 level as previous support.
Now the price is clearly below it, which suggests:
• breaking support,
• a retest from below may occur,
• continuation of declines is likely.
⸻
3. Another important support on the chart
I see strong levels:
🔴 #1 Support: $2,830 - $2,900 (current price)
This is the zone where the price is trying to hold – but it looks like there is a weak reaction.
🔴 Backer #2: $2,147
This is a wide zone where the upward impulse previously began.
➡️ If ETH drops below 2800-2830, the next logical target is 2150-2200.
⸻
4. RSI (1W) shows a downward trend
• RSI is around 40, which is close to the oversold zone.
• The RSI trend has been down for months.
• No bullish divergence (no trend reversal signal).
➡️ This supports the narrative of further declines.
⸻
5. Candle structure - clear downward momentum
Some previous candles:
• large red bodies,
• no aggressive buying,
• reflections are weak,
• The weekly candle currently looks bearish.
⸻
📊 Technical Summary
Based on the chart:
Short-term and medium-term trends: downward
The price broke key supports
Most likely scenario:
➡️ Continued declines to USD 2,150-2,200
if the 2830 level is broken and the weekly candle closes below.
⸻
📈 When would things look like they would turn around?
Only if:
✔️ Price will return above 3070
✔️ And will maintain a weekly close above this level
✔️ RSI will bounce up and divergence will appear
Then we can talk about a greater chance of returning to 3,500 and beyond.

HBAR | Retraced into Key Support Zone – Long Spot SetupHBAR has pulled back into a major support zone at $0.13–$0.14, which has historically acted as a strong demand area. This presents a potential long spot opportunity for traders watching for a bounce or trend continuation.
🟢 Trade Idea
Entry Zone: $0.13 – $0.14
Take Profit 1: $0.19 – $0.21
Take Profit 2: $0.25 – $0.29
Stop Loss: $0.12
🔁 The plan is to ladder in through the support zone and scale out at the outlined targets, aligning with previous resistance levels. A clean break below $0.12 would invalidate the setup and suggest reevaluating the trend.
📌 Watching price action and volume closely in this zone. Always use proper risk management and size positions accordingly.

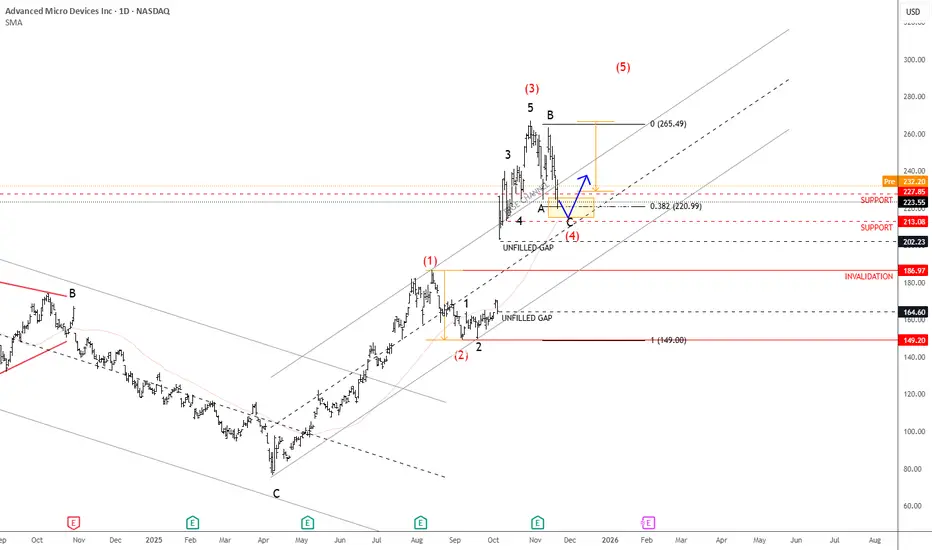
AMD Is Approaching Support, While Finishing A CorrectionAMD is in a very strong uptrend, supported by the impressive rally since early October when it gapped higher on positive AI news. Since then, the stock has gained more than 50%, and this bullish momentum could continue after a retracement, especially considering latest company’s better-than-expected earnings report.
But based in latest price action, we assume that the market is now in a corrective pullback before resuming higher, ideally forming wave four within a broader five-wave sequence. The previous high around 220 could act as the first key support, followed by the 200 area, which also aligns with upper range of unfilled gap. So if we are correct, then later this month or early in December, the market can once again stabilize and turn up for a new high, while the price is above 187 invalidation level.
Highlights:
Trend: Strong uptrend, wave four correction in view
Support: 220 / 200 zone
Invalidation: Below 186
Note: Wait for a pullback to complete before considering new long opportunities
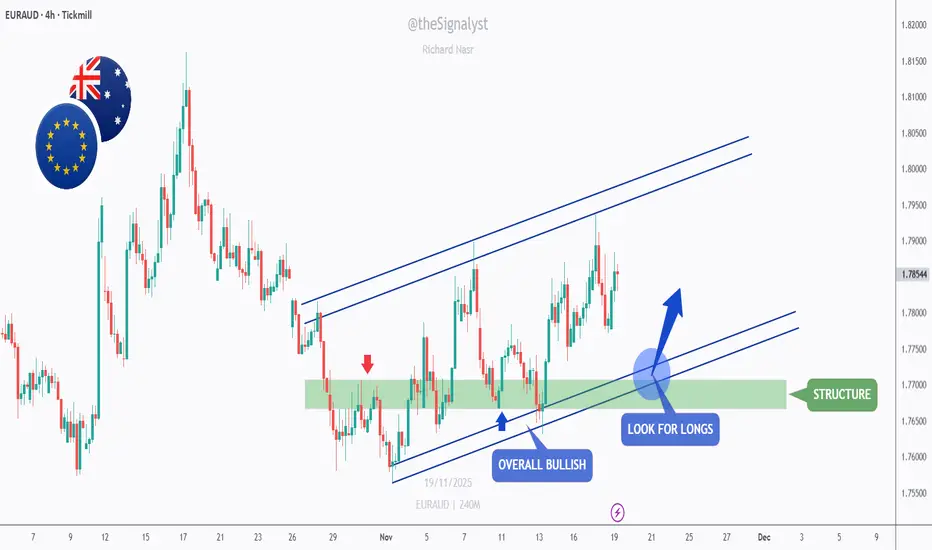
EURAUD - Bulls Still in Control… Waiting for the Next Retest!📈EURAUD continues to hold a clean bullish structure , trading inside an ascending channel while respecting the major support zone around 1.7650–1.7700.
⚔️This green zone has acted as a strong rejection area multiple times , showing clear buying pressure each time price dips into it.
As long as EURAUD remains above this structure, the bullish bias stays intact. I will be looking for longs on the next retest of the channel’s lower boundary, which aligns perfectly with the green demand zone - a powerful confluence area for trend-following entries.
🏹If the bulls manage to defend this zone once again, the next wave upward toward the upper boundary of the channel becomes the most likely scenario. But if price breaks below the structure, the bullish outlook would weaken.
We’re now waiting for the market to make the next move… will the bulls step in again at support? 🤔
⚠️ Disclaimer: This is not financial advice. Always do your own research and manage risk properly.
📚 Stick to your trading plan regarding entries, risk, and management.
Good luck! 🍀
All Strategies Are Good; If Managed Properly!
~Richard Nasr.
TECHNICAL ANALYSIS – BTC (4H)📉
1. Main trend – still down
I see a clear downward trend channel (yellow lines) on the chart. The price is moving in the lower half of the channel, which means that supply pressure is still dominant.
2. Rebound, but under strong resistance
The recent upside breakout looks more like a correction in a downtrend than a reversal.
The closest resistance levels I see on the chart:
94,500 – 95,000 → EMA + local level
96,000 – 96,500 → next EMA
98,000 – 99,000 → key level where the SMAs are located
Until BTC breaks above 96,500–97,000, there's no way a sustained trend reversal will occur.
3. Current Reaction at the SMA/EMA
The price touched the red moving average (SMA?) but was rejected—a classic reaction in a downtrend.
This signals:
a lack of buying power,
a predominance of supply in the 93,300–94,500 area.
4. Support Levels I See
At the bottom, you have specific lines that make sense:
89,900–90,000 → key support
89,500 → marked level
87,600–86,500 → lower part of the channel + previous bounce
If BTC loses 89,500, a move to the 87,000–86,500 area is very likely.
5. MACD – early, but cautious signal
The MACD has started to move up, but:
there is no clear crossover yet,
the histogram is weak.
Interpretation:
The rebound continues, but there is no confirmation of a trend change.
6. RSI – slightly bullish, but neutral
RSI ~49, so:
it is not oversold,
it is not overbought,
there is room for both a further rebound and a decline.
The RSI does not provide a strong directional signal.
📌 Summary – what looks most realistic?
Baseline scenario (60% chance): continued decline
Price will rebound to:
94,000–95,000,
possibly to the upper band of the channel (95–96K),
and be rejected → a decline to 89,500, and then 87,000–86,500.
Bullish scenario (40%): breakout of the channel
We need to see:
a 4-hour candle close above 96,500,
preferably a retest and hold,
only then can we talk about a trend reversal and a move towards 98,500–100,000.
📈 Market assessment (neutral–bearish)
Everything indicates that we are only in a correction within the descending channel. Until BTC breaks ~96.5K, the advantage is on the bears' side.
