It's my form to mark my order clock combined with zones monthlyThis is a show up!!!
It's so beautiful and modern when I will go to make a backtesting only analyzing in the past time.
Support

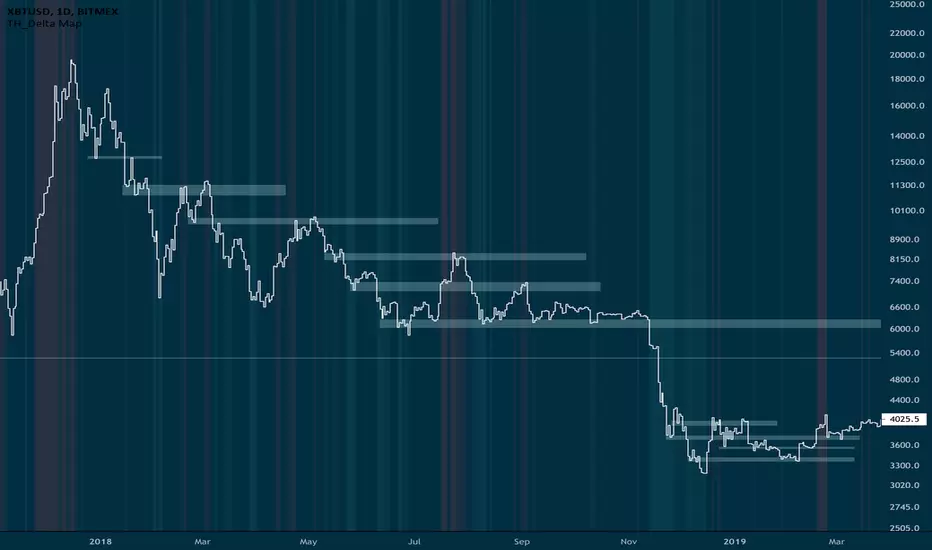
Analyzing BTC trends using muli-plane grid techniqueTIP: Did you know that you can watch the price, volume and orderbooks (bids and asks) fluctuate on a bag of 10 different stable coins on our stable coin index @ vcdepth.io - This really helps to see when money is flowing in and out of the sidelines.
This chart depicts how I see trends and its applicable to almost any chart. I see an intersecting graph paper like grid with lines on different planes. Most of those lines I just copy and paste and move up or down. Here there are a total of 3 planes that provide the bulk of support and resistance for all the price action in this chart. Arguably there could be additional lighter lines on each plane in between some of the larger gaps. I tried to color each plane differently and emphasize the perceived strength of each line on its plane. Notice when price action occurs at the intersection of multiple planes, support and Resistance are usually stronger with combined support from the multiple trendlines, the more trend lines in support, the stronger the support. Furthermore I add Orange horizontal lines that depict horizontal historic support and resistance. The sharp descending channel we just broke out of appears to be a freefall and is now is trying to snap back to the grid.
From here there are 4 likely paths,
-The continuation of the sharp descending trendline, seemed the least likely, we have halted descent and broke the channel and have at least 3 planes of support with one of the other 3 paths are more probable. That said, we just broke all the supports while I was typing this, in support of this arrow. This path could see a low around $7800 as early as a week from now. This would most likely be a great entry point and the lowest we will see BTC for a long time.
-Continue along the bottom of what may become a large descending channel with an absolute low of $8000 possible mid-March. Right now this is definitely possible but it feels like one of the others may be more likely based on global order book support @ vcdepth.io
-There has been a decent amount of support and resistance sitting almost perfectly $1000 above the long term ascending trendline. This could hold and in fact could be bottom of a long term ascending channel with the top of channel sitting around $10k right now and also in a lighter red. If we are stuck in this channel we end up in the same place as the next option.
-There is a chance we take this little sub ascending channel to $9450 by mid-March where there is a large chance we will confirm this as a descending channel and likely follow it all the way down to the 5 year trend line before making its next big run to hopefully surpassing February highs with a low around $8400 mid-april.
*Note there is a chance if we drop to $8200 that we could form a nasty head and shoulders. Also watch all these lines, whichever direction we go from here, it will likely bounce between a set of these lines which can help identify entry and exit points.
This is not investment advice, do your own research!

GBPNZD SUPPORTThis is a good example of using support to your advantage when trading.
If you look at the two highlighted areas at support price created bullish engulfing candles.
It was a matter of time before price was going to take off.
Finally price slow down giving some consolidation this could be a potential entry for a buy.
Been able to secured an overall of 160 pips with only risking 30 pips.
This is just an example of how you can support or resistance and candlestick structures when you maybe unsure about a trade.

EW Analysis: Crypto Is Selling-Off; Btc At 6-7K Sup. ZoneHello traders!
Today we will talk about cryptocurrencies and their current decline.
Let's start with Bitcoin against the ALTs dominance. BTC was losing its dominance against the ALTs since the beginning of September that can be clearly seen in the BTC.D/OTHER.S chart, but as you can see a decline was corrective only in three waves a-b-c, ideally in wave 4, which means that BTC Dominance could be back in the game for wave 5 soon, especially if we consider that strong a=c and base channel resistance line support area.
Due to a lost of BTC dominance, BTCUSD just hit new lows again compared to some other ALTs like NEOUSD and ZRXUSD, which were stronger in the last couple of weeks. However, we still see a corrective W-X-Y structure from the highs on Bitcoin and it's still trading around important 61,8% Fibonacci area, so we would not be surprised if we will see a bounce soon, maybe already here around 7000-6000 support area, especially if we take a look on NEO and ZRX.
In the Crypto market we always have to respect correlations. And what we see is that both, NEO and ZRX can be unfolding pretty clear bullish setup here with a strong five-wave rally away from the lows followed by a three-wave a-b-c corrective pullback that can stop right here around important 61,8% Fibonacci support area and channel support line.
Well, what we want to point out is despite that current sell-off in the Crypto market, we still see limited downside with a strong support levels and potential bullish reversals. Also, if we are right and BTC dominance comes back, then BTC could be the strongest cryptocurrency again, which means that ALTs against the BTC pairs (XXX/BTC) may continue even lower.
This is just how we currently see the Crypto market; Crypto market can see a bounce and a recovery sagain, but only against the USD, while XXX/BTC will stay mostly bearish or sideways.
If you like what we do, please like and share.
Disclosure: Please be informed that information we provide is NOT a trading recommendation or investment advice. All of our work is for educational purposes only.

Best trading strategy for beginner!Basic charting skills for novice traders
Understanding Support and Resistance levels are a fundamental part of learning how to chart and trade.
It's the most basis concept but plays a tremendous role in technical analysis.
When one has a good understanding of support and resistance levels, he/she can start trading S/R flips.
Which is a relatively easy trading strategy. A S/R flip is when a Support level turns into a Resistance level and vice versa.
The first step is to learn how to identify key support and resitance levels. You'll get a hang of this fairly quick by practicing on Daily, 4H and hourly charts.
I would advice to stay away from lower timeframes in the beginning, due to the fact that it can be a little more tricky to identify clear levels there.
Once you get a hang of identifying support and resistance levels, try practicing with the trading strategy of trading S/R flips.
Select a chart, identify the relevant support and resistances that are close to the current price level and mark them with horizontal rays. (I have done this with the LTC/EUR chart for this idea).
For a select period (depending on which timeframe you selected; 1D, 4H, 1H), try monitoring the way the price reacts to the levels which you have drawn.
You might notice a certain patterns of the price breaking levels, and then re-testing them. This is called an S/R flip.
It shows that the previous resistance (which has been keeping the price from going up), has now turned into support (keeping the price from going down).
The same may apply for support levels turning into resistances.
How does one trade S/R flips?
In a bull market, traders can wait for price action to break through a previous resistance level.
If the price manages to break through the resistance and close above it, that indicates that the resistance has been broken and now functions as support.
Traders can enter a trade from the moment the candle closes above the resistance level, OR play it more safely and wait to enter on the retest of the broken resistance.
The trade is invalidated when there is a failed retest attempt where the price falls through the level.
However, do note that prices can always "wick" through a level, without actually closing below it (which is a clear sign to get out).
In a bear market, traders basically trade the same way only in a different direction.
Traders will wait for the price to fall through a support level and open a short when the candle closes below the support lvel OR wait for the price to retest the broken support level.
Off course, the information provided here is a bit short-sighted. It is definitely as "black and white" as i have described it here.
There are other things to consider, like volume in-or decreases. Or larger chart patterns which are directing the price action.
However, the tutorial provided here should help you get well on your way!
Please note i am doing this for educational pruposes and am still learning myself!
I am not a professional trader or financial adviser.

EW Analysis: Wave structure Suggests Limited Downside For BTCHello traders!
After that deeper corrective decline called double zig-zag W-X-Y pattern on Bitcoin , it's time to take a look at potential support levels.
We decided to take a look at Bitcoin dominance ( BTC .D) against the ALT dominance (OTHERS.D), where we clearly see a corrective decline in wave 4 that can find support soon, ideally around previous wave »iv«, 38,2% Fibonacci retracement and 14.00 – 13.50 area. So, seems like BTC Dominance will come back, which can be supportive for Bitcoin , especially if ALTs are looking for the potential support or bottom, but according to dominance, BTC should be still doing it better than ALTs!
We also decided to take a look on BTC Futures chart, because it's more accurate than those from exchanges. As said above, we are tracking a double zig-zag W-X-Y corrective pattern, which can be approaching the end soon, ideally once BTC .D/OTHERS.D chart finds support. From technical perspective, previous wave 4 and 61,8% Fibonacci retracement are actually ideal support zone and if we also consider an open GAP from May, which usually acts as a reversal point once it gets filled, then we should be really aware of a potential bounce around 7000 area, specifically 7400 – 6300!
As always, the count always needs to be confirmed, so we will be watching very closely when/if comes into the support zone . And, if BTCUSD is really going to rebound in strong and impulsive manner later, then we will be looking for longs, but until then we have to patiently wait!
Trade smart!
Disclosure: Please be informed that information we provide is NOT a trading recommendation or investment advice. All of our work is for educational purposes only.

Profit on NZDUSD!Hi @FollowMyForex fans!
After our last update, all our targets were hit netting us a nice profit of +43 pips. By actively managing the position we were able to identify a change in the market momentum, adjust accordingly and take full advantage of it! Gotta love it when a plan works out like this ;)
On to the next!

Support and ResistanceIn a strong trending market like GAS currently in, support and resistance flip happens very often. Although other chart setups might not be as clean as this example, this technique can be used for all markets.
Broken Support turns into Resistance.
Broken Resistance turns into Support.
So how do we determine if a Support has been broken or not?
3 ways to view it:
- A lower low (Even if it is just a wick)
- A lower close (Candle must close below previous candle close) - Safe
- Candle close through previous low - Safest
Personally, i prefer to used the safest method to view my support and resistance. There are many nuances to trading support and resistance, try them out yourself and see what works for you! Safe trading out there!

Map Resistances using Support. No Fibs, MA, EW bs. SimplicityHi ladies.
If you are using tons of tools to identify supply/support and demand/resistances zones. STOP.
All you need is to apply this simple approach using past price action.
Switch to line chart on M, W and Daily timeframes and identify the Lower closes where price bounces. Map the zone to the left et voila.
All these zones are likely to represent important resistance zones in the future once price goes under them again. We can also look into zones with higher volume signatures which give higher significance to these resistances as well as consolidated sideway at those lows.
Best.
TH
Great example of how resistance often becomes support.This is a great example of how resistance often becomes support (and vice versa) with multiple tests of both. It is always worth extending trendlines beyond current price action. It is very common to see a break through support or resistance come back and retest the same trendline from the other side.

How to determinate support and resistance line. Hello everyone!
Thanx for subscribing on my channel.
Today is my first educational video. I hope to hear a feedback about it!
If it's interesting for you I will continue to make it!
Like my video if you enjoying it!
Have a good one!

Basics: Support and ResistanceSupport, a market position where a downtrend will be obstructed by a historical price level that establishes a demand zone.
Resistance, a market position where an uptrend will be obstructed by a historical price level that establishes a supply zone.

EURGBP - 5/2/19Here is a perfect example of the Elliot 5 Wave with the ABC correction waves. We can see how price broke out the downtrending channel and tested the previous support. I'm looking to go long on this pair.

Using Boxes To Understand Support & Resistance LevelsOn any given time period, you can place a box from a wick and span it across the chart. No interference of a price level usually means that outstanding orders still exist. Thus, buyers or sellers may be present at that level again to fight opposite of the trend since they were just pushing from those levels before.
It's a great gauge to understand how much price will struggle to pass through these distinct zones. For example, since Ethereum is bearish but found buyers at $89, $87, and $84, we can expect some support at these levels. The bigger the wick, the more it will struggle to pass through. This idea on its own does not indicate a bounce, especially because price failed to hold action above these levels. It just means it will fall less quickly in these areas, re-testing these same zones again.
I made the first level green because it should be the easiest zone to pass through; small wick, with small amount of buyers at that wick before price turned over again. The second level is yellow, because the wick is larger and had substantial buyers following that wick's action. The third level is red, because that wick is the largest in the series and had a very large amount of buyer's following it.

Supports and Resistances : Everything You Need to KnowSupports and resistances are horizontal lines on the edges (borders) of congestion areas. The bottom line is the support: the level where buyers strength overcome sellers, and buys are strong enough to reverse the downtrend. The top line is called the resistance: level where sellers strengh overcome buyers, and sells are strong enough to reverse the uptrend.
It is more preferable to create your support and resistance lines along congestion area's borders than extreme price action, since these borders illustrate the point where most traders changed their mind, whereas the extremes are only reflecting a few people panicking.
Psychology
Traders remember at which price they bought or sold, and this is what create supports and resistances.
Support and resistance zones often switch roles: when a support is broken it will become a resistance, and vice versa. This happens because as the market makes a breakout downwards, buyers feel pain and wait for a rally to free themselves without cost, whereas sellers regret and wait for a rally to have a second chance to short. The buyer's pain and seller's regret create the new resistance.
A support or resistance is going to be more significant if the preciding price action was steep rather than a slow ascending or descending trend.
Volumes
Low volumes around a resistance or support area indicates its fragility. Traders aren't feeling quite involved in it. However huge volumes show strength in this level.
Trading Rules
1. When you are surfing a trend that is reaching its support or resistance, move your protection stop closer. The trend will reveal its health at this point: it can either go faster and your stop isn't triggered or it can bounce on the Trend line and your stop securises your profits.
2. Supports and Resistances are stronger on a bigger timeframe. Weekly charts are stronger than daily charts. This way, if on the weekly the price is flat and on the daily the price action is hitting a support or resistance then the signal is less important than if price was reaching a support or resistance on the weekly.
3. Resistance and support levels are usefull to setup stoplosses and take-profits orders. If you are buying, the lowest value in a support area can be used as a stop if you place it just underneath.
Breakouts
A breakout happens when the price breaks out of its trading range, but most of breakouts are fake breakouts.
Be careful of fakeouts : it is more often an opportunity to position against them, with a protection stop.
"Fakeouts" or "fadeouts" are when the price tries to break a support or resistance but end up returning in its trading range. How to know when a breakout is fake or not?
True breakouts are confirmed by high volumes and technical indicators showing new highs or new low. Also we should be able to see the new trend on a higher timeframe.
Fake breakouts tend to happen on low volumes and indicators divergences.
In order to trade fadeouts, wait for price action to stop making new highs or lows. This is when prices fade. Then, place your stop on the extreme, risk is low, but chances are that price will make a pullback in its congestion zone.
You liked this article? Make sure to leave like or a comment :)
---------------------------------------------------------------------------------------------------
My Website - Automated Strategies with Backtest and Alert Setup
blockchainfiesta.com
PineScript Development, Reverse Engineering Comissions open (1 slot)

JD: Earnings Stock of the Day JD.com has been in a downtrend since it topped early this year. This weekly chart shows why it is no longer an ideal sell short. The stock has declined steadily, losing more than 50% of its price value and JD is now at a support level that is strong, where buyers are likely to start moving in. At this time, a sideways pattern is likely, or a bounce up today if earnings are showing growth and stronger revenues.

Support and Resistance Levels with auto Fibonacci Setup TutorialIdentify horizontal support and resistance lines using your choice of 6 methods.
Available options
Lookback window: Number of bars back to consider in calculations
Lookback window right (only applicable for methods 3 and 4): Number of bars to the right to consider in calculations
Number of S/R lines to plot: S/R lines to plot (currently the max setting is 4 so 8 lines due to pine limitations. I can post separate scripts for each method that allow more depending on user feedback)
Use Custom Time Frame? (M1, M6, M5 only work if viewing lower TF): Set a custom timeframe in minutes, then 1D for daily, 3D for 3 daily etc.
Calculation offset: How many of the most recent bars to ignore in the calculations.
Update Frequency: How many bars to wait until updating the lines since the last update.
Things to tweak.
I still need to test the methods, depending on that and feedback I can post separate scripts for each method that allow more depending lines or scrap some.
I'll tweak the parameters for using linebreaks to scrap them. Currently required a three close through it (so two in one direction and one in the other).
Fibs don't work on the static timeframe as I've reached certain restriction in the coding system.
Link to Indicator
Below are some examples using the default settings (which I have not optimized as of yet)
Method 1
Method 2
Method 3
Method 4
Method 5
Method 6
Referral Links
Bitmex 10% fee discount for 6 months
www.bitmex.com
TradingView (50% off after trial period ends)
tradingview.go2cloud.org
Tip Jar
BTC: 1FgEeDDMF7QKydQPJVCDjp7ypjREp8XG6c
LTC: LM9KsXz7GUxCN9g9EjTC8ayviDEmBK14rw

What Support Looks Like When It BreaksLooking at the m15 chart only can lead you to have the correct idea but in the wrong place.
By looking at high time frame charts you get a better picture of when a trend is in place, when a trend is no longer working or when there is no trend and we're in a range.
On the attached charts a daily time frame (top left) has a defined up trend and at 1.6700 the trend line and price meet for the 3rd time of Sept 27th. Here traders wanting to keep adding to long trade would initiate a long trade.
However by the close of the daily candle that idea is no longer valid, as the trend line did not hold as support.
Moving down through the smaller time frames we see that the days leading up to the 27th September have been consolidated into small daily moves. There is a clear line of support under these days that is clearly broken on the H1 chart etc. This equates to the time when the Daily candle approaches the rising trend line.
What we see happen next is that the broken daily horizontal support is now acting as horizontal resistance and price is trapped between this new horizontal resistance and the rising daily up trend.
When the horizontal resistance holds and the daily rising trend line are broke on the H1 candles traders waited for a quick retest and then went short. Accelerating the move.

FIBONACCI for beginners Part#3! How you can use FIBs!Hey everyone,
third Video about fibonacci.
In this video I talk about Fibonacci-Retracements and how you can use them for your trading. :-)
Peace and happy learning
Irasor
Trading2ez
Wanna see more? Don`t forget to follow me!
Any questions? Need more education or signals? PM me.

How you NOT use Fibonacci! Support&Resistance for beginners!Hey everyone,
welcome to my second Video about fibonacci and how you should and should not use retracement- and extension levels. :-)
There is way more to say about resistance and support-levels.
Since I only got 10 mins. for a video I can just talk about small pieces and highly recommend you to check more about this topic.
I just wanted to give you an example how the market works and how it respects resistance and support-levels.
There are more Traders than those who safe profit to cause resistance or support-zones.
Stop-Loss-Levels gets triggered, Take-profit, fundamentals, those who are flat and wait for signals and so on.
If you wanna see more about that topic just use the comment section and tell me more about your wishes. :-)
You can also PM me!
Peace and good trades
Irasor
Trading2ez
Wanna see more? Don`t forget to follow me. :-)
Need education or more signals? PM me. :-)

My Ichimoku Cloud notesUsing the current BITFINEX:BTCUSD chart as I learn more about Ichi clouds. Easier to learn by example for me at least.
Found that this one from Fidelity is quite brief and to the point,
www.fidelity.com
Thoughts or any other basic things to keep in mind, please do let me know. Thank you!

CHART ANALYSIS ALWAYS STARTS BY LOOKING AT A BIGGER PICTURE! Patience is everything in trading!. Successful traders always look at a bigger picture and rely on higher timeframe to get the required edge. Lower time frame like minutes to even hours and sometimes days dont tell you a bigger picture of what is coming. Yes you maybe successful for now but you might not be for a long time if you analyze your charts on shorter time frame. That is what i used to do and now i rely on higher time frame for my analysis, although the trade set up are less but they are of high probability.
This AUDJPY chart represents the first step that is advised to be taken whenever you want to do technical analysis. The chart shows the monthly support and resistance zones. It can tell you are really vital stories about the FX pair you wish to trade.
So always try looking at a bigger picture rather than a smaller one.
Follow me if you want to get latest in depth analysis and signals

Lesson 7: Support and Resistance LevelsHello Traders,
After being busy with work and all, I am finally back with yet another lesson. There are many traders out there who still do not understand the significance of support and resistance levels. So today we are going to go over that in detail. Note that this lesson will be only covering the horizontal support and resistance levels. I will have another lesson for the diagonal support levels later on.
This concept has been used by a lot of traders to mark price levels and borders for a price to prevent it from pushing it any further, or to even manipulate the price. You must be thinking that support and resistance is as simple as drawing a line where the price has touched more than a few times, but let me tell you it is not as easy as it looks. There are different ways to draw the support levels, and you will understand them all in this lesson which I am very sure about. So lets begin.
First, lets look at the topics I will be covering in this lesson:
1. What is support?
2. Where is support found?
3. What is resistance?
4. Where is resistance found?
5. Methods to draw support and resistance levels?
1. What is support?
In simple words, a support is formed when a price has been in a downtrend because of an increase in the supply, and suddenly we see an increase in demand due to which the price bounces upwards from the current trend. This increase in demand (if strong enough) stops the price from moving further down. It is considered a strong support level if the price has bounced from the same price/zone level several time in the past depending on the time frame you use.
In the image below we can see how a strong support level is formed on the 4H chart for BTC:
2. Where is support found?
Unlike the above image where the price is currently trending near the support level, support is usually found below the current price. Note that it is best to draw multiple support levels, because support levels are not always reliable. Having a support level doesn't mean that the price cannot go further down, which is why drawing multiple support levels helps as when price breaks one support level, it is very much likely to go touch the next support level below. Lets look at an image below where you can see TRX currently trending where the blue line is, and the red line is indicating the next support level. If the price goes on to break the first support level at 592, it is likely to go to the next support level at 490. However, it can also be a trade opportunity at the first support levels, if the price bounces at that support level.
See the image very carefully. Now, if the price goes below the 592 support level, that level will start acting as a resistance level when the price climbs its way up. We will go over that in detail.
Continue reading below....
