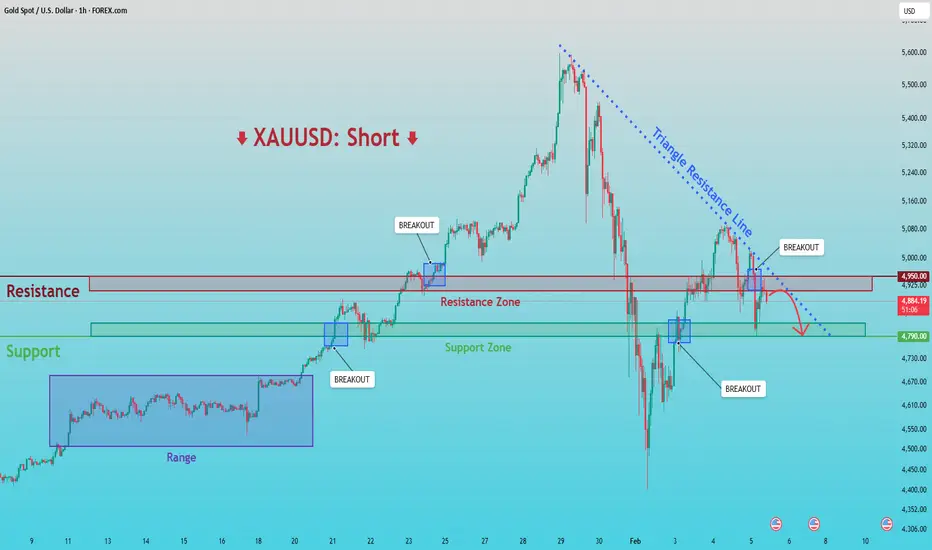
XAUUSD: Breakdown & Retest Signals Bearish ContinuationHello everyone, here is my breakdown of the current XAUUSD setup.
Market Analysis
XAUUSD previously traded within a well-defined consolidation range, where price moved sideways for an extended period, indicating balance between buyers and sellers and gradual liquidity accumulation. This range eventually resolved to the upside, triggering a clean bullish breakout and a strong impulsive rally. Following the breakout, gold expanded higher aggressively, confirming bullish intent and attracting momentum buyers. However, after reaching the upper highs near the peak of the move, bullish momentum began to fade, and price formed a clear swing top.
Currently, XAUUSD is trading below a key Resistance Zone around 4,950, which previously acted as support but has now flipped into resistance. Several breakouts above this zone failed, suggesting lack of acceptance and strong seller presence. At the same time, price recently broke below the descending triangle support and is attempting a weak pullback toward the broken structure — a classic bearish retest scenario.
My Scenario & Strategy
My primary scenario favors a short continuation, as long as price remains below the descending triangle resistance line and below the 4,950 Resistance Zone. The recent breakout attempts above resistance appear corrective and liquidity-driven rather than signs of a trend reversal. As long as these levels cap price, rallies are viewed as selling opportunities rather than bullish continuation signals. From a structural perspective, the market is transitioning from a bullish expansion phase into a broader corrective or distribution phase. The loss of higher highs and repeated rejections from resistance support the bearish case. The first downside objective lies near the 4,790 Support Zone, which represents a key demand area and a prior breakout level. This zone is expected to act as the first major target where buyers may attempt a reaction. If price reaches the support zone and shows strong rejection or consolidation, a temporary bounce is possible.
However, a clean breakdown and acceptance below 4,790 would confirm bearish continuation and open the door for a deeper move toward lower demand areas. The short bias remains valid as long as price stays below resistance and the descending structure remains intact. Any strong breakout and acceptance above the triangle resistance and the 4,950 zone would invalidate the short scenario and shift focus back to bullish continuation. Until then, structure favors sellers.
That’s the setup I’m tracking. Thank you for your attention, and always manage your risk.
Support and Resistance
GOLD - Consolidation in a symmetrical triangle. Up or down? FX:XAUUSD showed signs of recovery on Friday, but the price is stuck within the boundaries of a symmetrical triangle, which generally indicates market uncertainty.
Key fundamental factors
The ADP, JOLTS, and unemployment claims reports pointed to weakness in the labor market, supporting expectations of two Fed rate cuts this year, which is positive for gold. Upcoming US-Iran talks are supporting demand for safe-haven assets, despite the conclusion of the Ukraine talks. Other central banks (the ECB and the Bank of England) easing policy has strengthened the dollar, putting pressure on gold.
Gold's attempt at recovery looks vulnerable. Although weak employment data and geopolitical risks provide support, the main counterforce remains the global rotation of capital in favor of the US dollar.
Technically, the market may have a chance to break through the correction resistance, but will there be support from traders?
Resistance levels: 4901, 5021, 5100
Support levels: 4811, 4751, 4670
I expect that before attempting a breakout, the market may try to test liquidity in the 4812 zone. However, if the market breaks through the resistance conglomerate and manages to close above 4901, then the market will be able to continue its growth towards 5000.
Otherwise, if 4812 does not hold the price, the market will close within the boundaries of a symmetrical triangle (flat).
Best regards, R. Linda!

Bitcoin to $90k - February 2026Remember those dizzy heights seven days ago?
** The weeks ahead, void after May 2026 **
You read correctly, Without-worries has a bullish idea. For most of quarter 4, 2025 it has been a stream of bearish ideas, mostly all falling on deaf ears. Today is a bullish idea. A bullish idea with a time limit.
On the above 2 week chart we can see price action has collapsed 42% (The Answer to the Ultimate Question of Life, the Universe, and Everything) as retail traders provided the necessary exit liquidity to allow legacy holders to exit the market at $126k.
Today sellers continue their enthusiasm for locking in losses by selling into past resistance. Not just any resistance, a resistance that took most of 2024 to break. Folks selling into an obvious area of support test use emotion as their guidance.
Higher highs higher lows. On this timeframe price action continues to be in a bull market until a lower high print AND a break of market structure, that’s a 2 week candle body below $54k
The 0.382 Fibonacci retracement level, where price action is today, is not only a support backtest, but also a Fibonacci level Bitcoin price action has continued to respect throughout most of its history.
Notice the Head & Shoulders pattern? Whether it confirms or not is up to the market, there’ll be clear identifiers which way it should go. Remember, extremes in a market is marked by extremes in volume. If the right shoulder should form with an absence of volume, expect confirmation and continuation to the downside. Either way the right shoulder identifies a date and price when it would be better not to have exposure to the market. Think escape hatch, that’s your moment to jump from this sinking ship and spare yourself another 2025.
Conclusions
Bitcoin remains structurally bullish on the 2-week timeframe. The trend of higher highs and higher lows is still intact, and price is currently reacting at a historically respected confluence: former macro resistance, now support, aligned with the 0.382 Fibonacci retracement. This is not where long-term bull markets typically fail impulsively.
The recent 42% drawdown appears corrective rather than terminal. Capitulation behaviour is coming from late cycle participants selling into support, not from long-term holders distributing into strength. Until a decisive break of market structure occurs, defined as a 2-week candle body close below ~$54k, then the bullish thesis remains valid.
That said, this is a time boxed idea. The developing Head & Shoulders formation provides a clear decision framework. If the right shoulder forms on declining volume, downside continuation becomes the higher-probability outcome, and risk should be reduced aggressively. If the pattern fails, it reinforces the broader bull trend and opens the door for continuation later in 2026. The key takeaway is not blind optimism, but asymmetric positioning:
Support holding + volume confirmation → stay engaged
Right shoulder + volume divergence → use the escape hatch
After May 2026, clarity diminishes. Volatility is expected to increase, structure may degrade, and probabilities flatten. This idea expires there. Not because Bitcoin must fail, but because the edge does. Bullish for now, but be prepared to exit when the market tells us to.
Ww
=========================================================
Disclaimer
Let me be very clear. This is not financial advice. Nobody gives better non-financial advice than me. People say it all the time. Tremendous disclaimers. The best disclaimers.
I’m not telling you to buy Bitcoin. I’m not telling you to sell Bitcoin. I’m just looking at the chart, a beautiful chart by the way, and saying what I see. Very strong lines. Very smart lines. Some people don’t understand the lines. Sad!
If you lose money after reading this, that’s on you. Totally on you. I warned you. Many people warned you. You clicked the button anyway. Not my fault. Not even a little. Markets are brutal. Absolutely brutal. They don’t care about your feelings, your tweets, or your conviction. They will destroy weak hands. I’ve seen it. Terrible. Just terrible.
This is analysis. Entertainment. Maybe education.
But advice? No. Never said that. Didn’t even think it.

BTCUSD Heavy Dump → Buyers Step In at SupportBitcoin (BTCUSD) has experienced a strong bearish impulse, breaking multiple intraday supports and printing lower lows. After this aggressive sell-off, price is now showing signs of short-term stabilization near a key demand zone, where buyers are attempting to step in.
The current structure suggests a potential corrective rebound if price holds above the recent low. A higher low formation could open the door for a short-term recovery toward the next resistance zone. However, overall momentum remains bearish, and any upside move should be treated as a pullback unless a clear structure break occurs.
📌 Key Levels to Watch:
– Demand zone reaction
– Higher low confirmation
– Break above short-term resistance for trend shift
⚠️ This analysis is for educational purposes only. Not financial advice. Always manage risk properly.

BTCUSDT Lower Highs, Lower Lows - Bears in Full ControlHello traders! Here’s my technical outlook on BTCUSDT (3H) based on the current chart structure.BTCUSDT previously traded within a well-defined ascending channel, where price consistently respected both the rising support and resistance lines. This structure reflected a controlled bullish trend with higher highs and higher lows, supported by steady buyer demand. After reaching the upper boundary of the channel, price failed to sustain bullish momentum and formed a clear turning point near the channel resistance. This loss of momentum marked the beginning of a structural shift, as buyers were no longer able to defend higher levels. After the range breakdown, BTC entered a sharp descending channel, characterized by strong impulsive bearish candles and brief, shallow pullbacks. Price respected the descending resistance line well, confirming that sellers remained in control and that each rebound was being sold into. This structure highlights aggressive distribution rather than healthy consolidation. As price accelerated lower, it approached a key Resistance / Seller Zone around the 67,000 area, where previous reactions occurred. Currently, BTC has broken below this Seller Zone and is pushing into the Buyer Zone around the 62,300–63,800 region, which aligns with a major horizontal support level. This area represents the first significant demand zone where buyers may attempt to slow or temporarily halt the decline. The sharp move into this zone suggests strong bearish momentum, but also increases the probability of a short-term reaction or consolidation. My primary scenario favors bearish continuation as long as BTC remains below the broken Seller Zone and continues to respect the descending channel structure. Any pullback toward the 67,000 resistance area is viewed as a potential short opportunity rather than a sign of trend reversal. The first downside objective lies near the 62,300 Support Level (TP1), where partial profits can be considered due to expected demand reaction. However, if BTC shows strong acceptance and sustained buying strength above the Seller Zone, this would weaken the bearish bias and signal a possible deeper corrective phase. Until that happens, structure, trend, and momentum all favor sellers, with the market firmly positioned in a bearish continuation phase. Please share this idea with your friends and click Boost 🚀

THE KOG REPORT - UpdateEnd of day update from us here at KOG:
Yesterday we plotted the potential range we expected price to play with the higher and low hot spots on the chart. We wanted both to complete one way or another, which as you can see from the chart, they have. Price managed to stay within the range so far giving the opportunity for traders to capture the scalps on the indi’s.
We now have support at the 4840-45 level which will need to hold price up in order for us to attempt the immediate resistance level above sitting at 4930. We’re still in a short-term bearish structure and this could be the final swing so again, it needs extreme discipline and patience, the trades are coming but the levels need to be right to get the big captures, which the market is giving.
From Camelot this morning:
Price: 4882
RED BOXES:
Break above 4890 for 4899, 4910, 4915 and 4939 in extension of the move
Break below 4855 for 4839✅ and 4810✅ in extension of the move
As always, trade safe.
KOG

GOLD - Correction (local downtrend). Range?FX:XAUUSD is showing increased volatility on Thursday, fluctuating within a wide range of 4800-5100. The market may move into consolidation...
Key fundamental factors
The USD's rise to two-week highs is putting pressure on gold. A weak ADP private sector employment report (22K vs. 48K forecast) supports expectations of two Fed rate cuts this year (limiting gold's decline). The agreement on negotiations between the US and Iran in Oman on Friday temporarily reduces demand for safe-haven assets.
Today's JOLTS (job openings) data and weekly jobless claims may strengthen or weaken expectations for Fed rates.
Gold is balancing between conflicting factors: a strong dollar and reduced geopolitical risks are weighing on prices, while weak employment data and general uncertainty about Fed policy are providing support.
Resistance levels: 4941, 5021, 5100
Support levels: 4856, 4751, 4670
The market is in a correction phase, with pressure in the 4950-5000 zones intensifying local sell-offs ahead of the news. The structure will be broken if gold breaks through the 4950 conglomerate and downward resistance and consolidates above this zone. But at the moment, I am considering a decline to 4751-4670 and a possible rebound with the aim of forming a sideways range.
Best regards, R. Linda!

XAUUSD (Gold) – 30M Price Action & Key LevelsGold is trading within a corrective phase after breaking below the ascending channel. Price is currently reacting from a well-defined support zone, while the overall structure suggests bullish continuation if this support holds. A sustained move above the resistance zone may confirm strength and open the path toward the marked upside target.
Trend: Overall bullish structure, short-term correction completed
Support Zone: 4,850 – 4,870 (strong demand, price reacting upward)
Resistance Zone: 5,000 – 5,030 (key supply area)
Breakout Level: Above 5,030 (bullish confirmation)
Target 1: 5,060 – 5,080
Target 2: 5,160 – 5,170 (final upside target)
Invalidation: Daily/30M close below 4,840
Bullish as long as price holds above support; breakout above resistance may trigger strong upside momentum.
This analysis follows TradingView chart rules using price action, trend structure, and key support/resistance zones. For educational purposes only.

BITCOIN: One Last Drop And Then On The Way $200,000Dear Traders,
In our previous analysis, we predicted a price drop from 100k to 60k through multiple analyses. This prediction has come true as the price is currently plummeting sharply. We believe the price will likely fall between 63k and 58k, which would be ideal for swing buyers and a potential high volume zone.
We anticipate a final drop before the price reverses and potentially reaches a record high. Our initial targets are $100k, $150k and ultimately $200k. This is likely to be a significant reversal.
Please like and comment for more updates. Also, follow us for the latest news.
Team Setupsfx_

BTC is really bearish (3D)We are working extremely hard to provide timely updates and accurate market analysis. You might be wondering why the price ranges keep changing frequently. The reason is simple: our primary goal is to protect our users from potential losses and liquidation risks. In a volatile market like this, it’s crucial to adjust levels dynamically to reflect the latest price action and market sentiment.
For this current bearish wave, the primary target is the green zone. This is the area where we expect the downward momentum to pause or consolidate temporarily. Traders should watch this zone closely, as it represents a key support level in the short term.
Once the price reaches the green zone, we anticipate a rebound that could take the market up to the red box. This retracement provides a potential opportunity for strategic entries or partial profit-taking before the market resumes its main downward move.
After this retracement, the expectation is that the main drop will continue, following the overall bearish trend. For those trading Bitcoin, it’s important to align your trades according to this structure: monitor the green zone for support, watch for a corrective rebound to the red box, and prepare for the subsequent drop.
Remember, in volatile markets, staying flexible and adjusting your positions according to updated ranges is essential for risk management. By following this framework, you can optimize your trade entries and exits while minimizing exposure to unnecessary losses.
If you have a coin or altcoin you want analyzed, first hit the like button and then comment its name so I can review it for you.
This is not a trade setup, as it has no precise stop-loss, stop, or target. I do not publish my trade setups here.

BTCUSDT: Fake Breakout From Support Signals Potential Long SetupHello everyone, here is my breakdown of the current BTCUSDT setup.
Market Analysis
BTCUSDT previously traded within a large symmetrical triangle, where price was gradually compressing between the triangle resistance and support lines. This phase reflected market indecision and liquidity buildup, with neither buyers nor sellers in full control. Eventually, price broke out to the upside, confirming bullish intent and leading to a range expansion, where BTC consolidated within a well-defined range before continuing higher. After topping out near the range high, market structure shifted into a clear downward channel, characterized by lower highs and lower lows, signaling short-term bearish control and corrective pressure. Price respected the descending channel boundaries well, confirming an orderly pullback rather than a panic sell-off.
Currently, BTC is trading back above the support zone, reclaiming the key level that previously acted as a decision point. This recovery suggests that the breakdown was liquidity-driven rather than a genuine bearish continuation.
My Scenario & Strategy
My primary scenario favors a long continuation, as long as BTCUSDT holds above the 74,500 Support Zone and continues to defend this reclaimed structure. The fake breakout below support significantly strengthens the bullish case, as it indicates trapped sellers and potential fuel for a rebound.
From a structural perspective, the recent decline appears corrective within a broader bullish context rather than the start of a new bearish trend. As long as price remains above support, pullbacks are viewed as buying opportunities rather than signs of weakness. The first upside objective lies near the 78,300 Resistance Zone, which previously acted as strong resistance and aligns with prior breakdown levels. A successful break and acceptance above this resistance would confirm bullish continuation and open the door for a deeper recovery toward higher supply levels.
However, a decisive breakdown and acceptance back below the support zone would invalidate the long scenario and signal renewed bearish continuation. In that case, price could revisit lower demand areas. For now, structure favors buyers, with the fake breakout and strong reclaim of support suggesting that downside momentum is weakening. Price reaction around support will remain critical in determining the next directional move.
That’s the setup I’m tracking. Thank you for your attention, and always manage your risk.

Bitcoin Weekly Roadmap: 50_SMA(Weekly) Lost — $70K Break Next?Let’s start with my previous weekly analysis on Bitcoin from Jul 11, 2025 , which showed that when higher timeframe technical analysis is done right, it can be impactful and help capture key trends. Back then, we identified the All-Time High(ATH=$126,199) and the subsequent correction accurately.
Now, let’s explore what the next weekly move might be—stay with me!
Bitcoin, after losing its uptrend lines and the weekly 50_SMA(Weekly), has shown weakness in its bullish structure. Historically, on Bitcoin’s weekly chart, the 50_SMA(Weekly) has been a critical support. Each time it’s lost, Bitcoin has extended its correction. We’ve seen two similar moves on the weekly chart: Bitcoin pulled back to the 50_SMA(Weekly) and then dropped again. Right now, that pullback is complete, and we can anticipate a fresh decline.
While many analysts expect a bullish “head and shoulders” pattern to push upward, I see that as unlikely:
The S&P 500( SP:SPX ) is near its all-time highs and is more likely due for a correction. Given its correlation with Bitcoin, an S&P drop could pull Bitcoin down, especially with sharp moves.
Also, USDT.D% ( CRYPTOCAP:USDT.D ) has broken past a heavy resistance zone and may continue rising—this could add more pressure on crypto, including Bitcoin.
Additionally, the US 10-Year Government Bond Yield ( TVC:US10 ) is breaking resistance lines, which signals risk-off sentiment—another factor that could lead to declines in assets like Bitcoin and gold( OANDA:XAUUSD ).
Looking at Bitcoin’s weekly chart: Bitcoin is in a heavy support zone($76,600-$64,850) and there’s a CME Gap($84,560-$79,660) above.
From an Elliott Wave perspective, Bitcoin has completed its main 5-wave impulse. Signs include the loss of uptrend lines and the 50_SMA(Weekly).
I expect Bitcoin to break the heavy support zone($76,600-$64,850). It may bounce near $68,000, but if negative news increases, we could see a drop to the $58,000–$59,000 range in the coming weeks.
Note: Increased Middle East tensions could accelerate reaching these targets faster. Let’s stay vigilant!
What do you think? Can Bitcoin fall below $70,000, or should we wait for the price of Bitcoin to rise again?
💡 Please respect each other's opinions and express agreement or disagreement politely.
📌Bitcoin Analysis (BTCUSDT), Weekly time frame.
🛑 Always set a Stop Loss(SL) for every position you open.
✅ This is just my idea; I’d love to see your thoughts too!
🔥 If you find it helpful, please BOOST this post and share it with your friends.

AUDUSD Rally Into Sell Zone | Strong Dollar Theme Returns!Hey Traders,
In today’s trading session we are monitoring AUDUSD for a potential selling opportunity around the 0.70200 zone.
AUDUSD remains in a clear downtrend and is currently in a corrective pullback, approaching a confluence resistance area near 0.70200, where the descending trendline aligns with a key support-turned-resistance zone. This area could act as a sell-the-rally level if bearish momentum returns.
From a fundamental perspective, the recent Fed Chair nomination of Kevin Warsh is viewed as hawkish, which may support short-term USD strength. A stronger dollar typically pressures risk currencies like the Australian dollar, adding fundamental confluence to the bearish technical outlook.
As always, wait for confirmation and manage risk.
Trade safe,
Joe.

Gold Holds Demand - Long Scenario After Correction Toward $5,180Hello traders! Here’s my technical outlook on XAUUSD (1H) based on the current chart structure. Gold initially traded within a well-defined range, indicating a period of accumulation and market balance. This consolidation eventually resolved to the upside, leading to a strong impulsive move and confirming bullish intent. Following the breakout, price respected a clean ascending channel, forming higher highs and higher lows. Multiple bullish breakouts along the structure confirmed sustained buyer control. However, after reaching the Resistance / Seller Zone around 5,180–5,200, bullish momentum weakened, and price faced strong rejection, resulting in a sharp corrective drop. This pullback drove price into a major Buyer Zone around 4,880–4,925, which aligns with a key horizontal support level and a previous breakout area. Price briefly dipped below this zone but quickly reclaimed it, forming a fake breakdown — a strong sign of seller exhaustion and buyer defense at demand. Currently, XAUUSD is stabilizing above the Buyer Zone, suggesting the correction may be complete. As long as price holds above this demand area, the structure favors a long scenario on pullbacks rather than continuation to the downside. A healthy retracement and consolidation within or just above the Buyer Zone could provide a favorable long opportunity. Bullish confirmation from this area increases the probability of a continuation move toward the 5,180 Resistance / Seller Zone (TP1). This level represents the first major upside target and an area where partial profits can be considered. If bullish momentum strengthens and price breaks above the Seller Zone with acceptance, the move could extend further toward higher resistance levels, confirming trend continuation. The long scenario remains valid as long as price holds above the Buyer Zone and avoids acceptance below support. A decisive breakdown and acceptance below the Buyer Zone would invalidate the long bias and shift focus back toward bearish continuation. Until that happens, Gold remains positioned for a bullish recovery from demand within the broader market structure. Please share this idea with your friends and click Boost 🚀

Gold Breakout and Potential Retrace! Hey Traders, in today's trading session we are monitoring GOLD for a selling opportunity around 4,980 zone, Gold was trading in an uptrend and successfully managed to break it out. Currently is in a correction phase in which it is approaching the retrace area at 4,980 support and resistance area.
Trade safe, Joe.

US100 Price Update – Clean & Clear ExplanationUS100 is currently trading under strong selling pressure after failing to sustain above the ascending trendline and the previous supply zone around 25,700–25,900. The sharp rejection from this area confirms that sellers remain in control.
Price has now broken below key structure support near 25,200–25,000, signalling a bearish continuation rather than a simple pullback. The recent impulsive bearish candle shows strong momentum, suggesting that any short-term bounce could be corrective.
As long as price remains below 25,700, the bias stays bearish. A short-term retracement toward 25,300–25,500 could offer selling opportunities, followed by a continuation lower toward 24,500. Only a strong reclaim above the broken trendline would invalidate this bearish scenario.
“If you come across this post, please like, comment, and share. Thanks!”

Gold next move?Gold is facing a strong resistance around the 4900 level, and the price has been repeatedly rejected from this zone, causing it to move downward each time it reaches this area. As long as the market does not achieve a confirmed close above this level, it will remain difficult for price to sustain any upward movement.
Additionally, the market has already collected liquidity on the downside, which increases the probability of further consolidation or corrective moves. Therefore, it is advisable to wait for a clear market close above the 4900 level. Once a strong close is established above this resistance, gold may then continue its move toward the upside.

Eliana | BTCUSD – 30M – Intraday Market ConditionBITSTAMP:BTCUSD COINBASE:BTCUSD
After distribution near the 79,000–78,000 resistance range, BTC experienced a strong impulsive sell-off, confirming bearish dominance. The breakdown below 73,000 accelerated momentum toward the 69,000 liquidity pocket. Current bounce appears corrective rather than a trend reversal. As long as price remains below the broken structure and supply zones, overall bias stays bearish, with only intraday pullback opportunities for buyers.
Key Scenarios
❌ Bearish Case 📉 (Primary Bias) →
Rejection below 72,900 – 73,500 keeps sellers in control.
🎯 Target 1: 69,150
🎯 Target 2: 67,800
🎯 Target 3: 66,500
✅ Bullish Case 🚀 (Relief Bounce Only) →
Strong hold above 69,100 demand may trigger a corrective move.
🎯 Target 1: 72,900
🎯 Target 2: 75,000
🎯 Target 3: 76,800
(Bullish move is corrective unless structure flips)
Current Levels to Watch
Resistance 🔴: 72,900 – 76,800
Support 🟢: 69,100 – 67,800
⚠️ Disclaimer: This analysis is for educational purposes only. Not financial advice.

THE KOG REPORT - UpdateEnd of day update from us here at KOG:
Yesterday we gave the hot spots and range we expected price to play in, and although we missed the lower hot spot by a few pips, we got the bounce from that region into the defence box above. We mentioned this morning that there was no break above, and due to the price action, to expect another correction during the NY session. The defence held, the bias level broke and we managed to complete all of our targets in a matter of hours.
For now, I’m expecting more of this whipsawing and the mega range but I have two key levels here. 5040-50 resistance and 4810-30 support. I would like to see a break above to confirm the target we already have for the high, however, that lower wick is concerning. Another attempt to break below 4600 could be on the cards here, so let’s monitor the price action tomorrow and wait for Excalibur and the indicators to give us the direction.
All in all, another decent day on the markets, even though staying ahead is taking a lot of effort.
From Camelot this morning:
Price: 5054
RED BOXES:
Break above 5060 for 5090. 5110 and 5140 in extension of the move
Break below 5025 for 5010✅, 4999✅, 4970✅ and 4956✅ in extension of the move
As always, trade safe.
KOG

GOLD Forming a sideways StructureGold is currently trading inside a clear range-bound structure, following a strong bearish move earlier in the session. Price is consolidating between major support near 4,560 and key resistance around 5,100, forming a sideways.
Gold fell toward 4,750 today, extending a 3.8% loss from the previous session and remaining on track for its second consecutive weekly decline as selling pressure persists the pullback follows a period in which the metal repeatedly hit record highs in January, driven by heightened geopolitical risks, concerns over Federal Reserve independence, and speculative buying in China.
Technical Outlook
If price maintains support above 4,800, we could see an upside reaction toward 4,959 / 5,100.
If price breaks below this support, downside targets come in around 4,702, followed by 4,559.
Traders should wait for confirmation at these key zones to determine the next directional move.
You may find more details in the chart,
Trade wisely best of Luck Buddies.
Ps; Support with like and comments for better analysis Thanks for Supporting.

Gold Consolidation may move to bullish sidesGold is currently trading around 4,920, showing signs of stabilization after a corrective pullback. Price previously declined sharply but found strong demand inside a well-defined demand/support zone around 4,780–4,850, from where buyers stepped back in.
Tecnically Price rebound, price moved into a short-term consolidation, indicating market indecision. The structure now suggests a potential bullish continuation, provided the support zone continues to hold.
Key Levels;
Resistance Levels ; 5023 / 5158
Support Level ; 4890 / 4820
Tecnically if price holds above the support zone and breaks above bullish momentum may strengthen, opening the path toward 5023 / 5,158 and potentially higher if the price does not growth showing weakness and break the 4900 major support then price move toward the support zone is possible for liquidity collection. As long as price stays above 4,890 / 4820the overall bias remains constructive to bullish.
You ay find more details in the chart.
Trade wisely best of Luck Buddies.
Ps; Support with like and comments for better analysis Thanks for Supporitng.

EURJPY - Breaking through resistance. Ready for growth FX:EURJPY is consolidating above the previously broken resistance level of 184.75 as part of a bullish trend. If the bulls maintain support, the price will be able to continue growing.
The euro continues to strengthen against the weak Japanese yen. The market is consolidating above the interim high of 184.75. Support plays an important role before the continuation of growth
The trend is bullish, with the 182.7 long squeeze triggering a recovery phase in which the currency pair calmly overcame key resistance at 184.39-184.75 and formed consolidation above the level, confirming bullish intentions
Resistance levels: 185.53, 186.42
Support levels: 184.75, 184.39
Consolidation above 184.75 - 185.0 followed by a breakout of local resistance could trigger another rally within the bullish trend.
Best regards, R. Linda!

Underwhelming move to $3k for Ethereum - February 2026The most underwhelming move in Ethereum’s history is about to print over the next few months. I say underwhelming because 50% forecast in a market that can drop the same amount in a few hours is.. underwhelming if not depressing. Regardless, they’ll call it a win.
A 50% gain to $3k is where price action was in April 2021. Six years of nothing is not a win, it’s a sad confirmation of an asset no one needs or uses. Do you remember a strong Ethereum run in the past was indication of a strong alt season? The same will be true in reverse. This forecast is not a trading opportunity, it’s an escape hatch to exit a toxic, obsolete, and technological redundant asset class.
The black circles are the last three long and short ideas published by Ww. Click over the little triangles to see the idea, and more amusingly the comments that attempt to denounce the idea. Emotion in liquid form is a valuable commodity to help us understand the validity of an idea.
On the above 8 day chart price action has dropped around 60% since the shared a “mind idea” at 3500 in November past. Had zero bok to publish an idea. And that’s annoying because now there would be 4 little triangles. Auf jeden fall…
Why long now?
Price action, believe it or not, is in an uptrend. A break of the recent upper support was made as price action fell to the next resistance. If a lower high is to print, confirming a larger trend reversal, then the upper support shall confirm resistance, which is around $3k.
Conclusions
In conclusion, the anticipated 50% move to $3,000 represents not a triumph but a failure. It would merely return Ethereum to a price level first seen six years ago, confirming its stagnation and technological redundancy. This forecast bounce is not an opportunity for profit, but a final exit signal, a chance to leave an obsolete asset class before the broader multi year downtrend to lower lows.
Ww
==========================================
Disclaimer
Right, look. Before you get all excited or start crying into your ledger, a quick word. This isn't financial advice. I'm not your dad, I'm not a wizard, and I definitely don't care if you lose your house. I'm just a bloke pointing at a graph, having a giggle.
The idea that Ethereum shuffling back to a price it had when The Queen was still alive is being spun as a "win" is... well, it's clucking tragic, isn't it? It's like celebrating your hairline returning to where it was in 2018. It's not a comeback; it's a confession.
So, if you're one of those sentient beard-strokers who thinks this digital beanbag is the future because it can run a cartoon monkey casino slightly slower than a 1998 Tamagotchi... brilliant. Knock yourself out. Buy it. Mortgage your mum's shed. I genuinely hope it goes to the moon for you, because the resulting documentary when it all goes wrong will be hilarious.
But for the love of God, don't come whinging to me when this supposed "breakout" turns out to be the financial equivalent of a death rattle and you're left holding a bag of obsolete code. You were warned. It's not my fault you thought "decentralised" meant "can't go to zero."
